Call-center-dashboard
This is a call center dashboard created with data from October 2020. It has over 30,000 rows of data.
#Data used
-I used a dataset CSV file containing more than 30000 rows
- I did ETL using Excel
- I loaded it into Power BI and did the calculations using measures and adding new columns as required for the visualization using power query Power BI
- visual contains slicers to filter the data
#Quetions
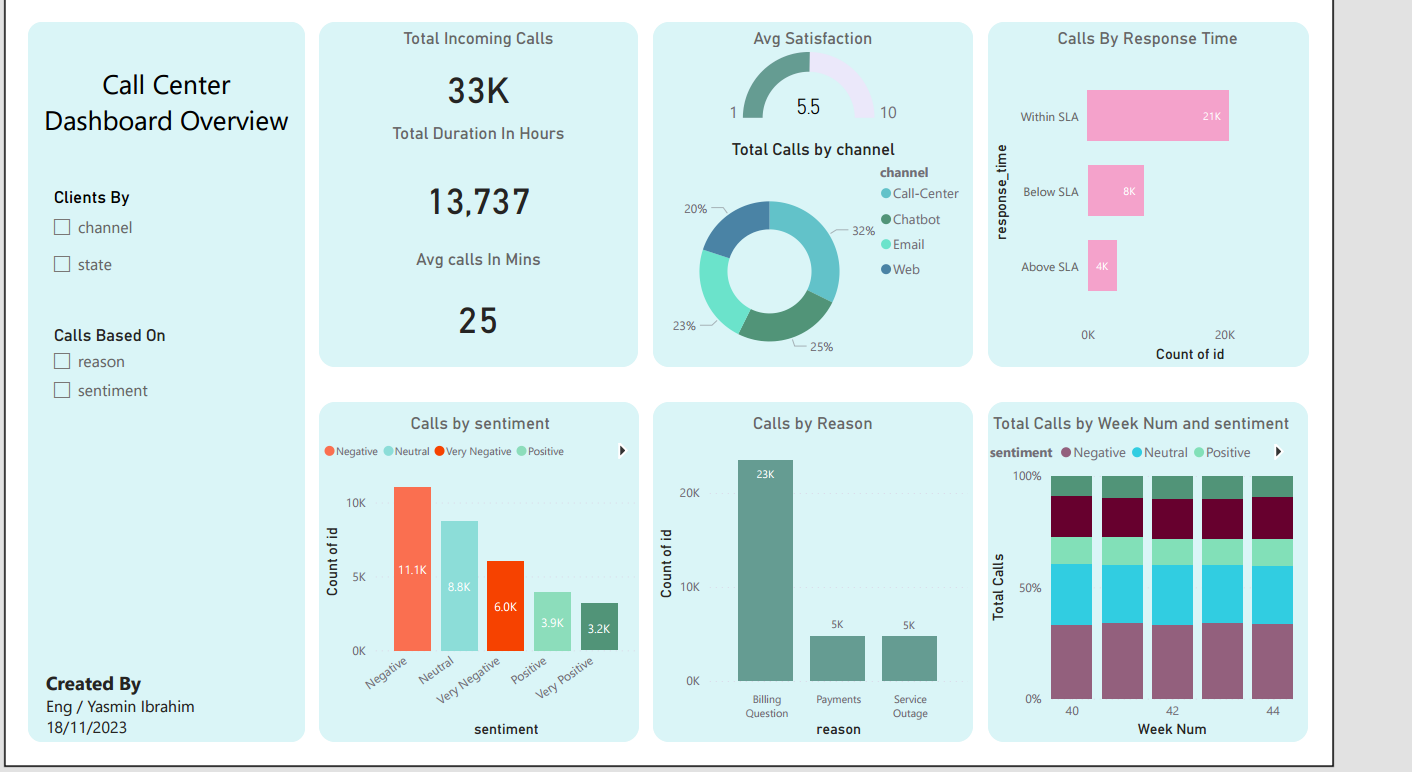
1- what is the total number of incoming calls?
2- what's the total call duration in hours?
3- what is the average number of calls in minutes?
4- how are the total calls by sentiment?
5- calls by reason?
6- what's the response time by call?
7- what are the total calls by week and sentiment?
8- what is the average satisfaction of the clients?
9- what is the total calls per channel?
findings
- average satisfaction for the clients was 5.5
- the call center channel had the biggest total of calls at 32%
- the response per call was within SAL by 21K
- the reason for calls was billing questions by 23K out of a total of 33K
- the sentiments of the client were negative by 11.1K which needs to be improved as soon as possible to not cause client loss
- Texas, California, and Florida had the highest states of number of calls