gwasTools
1.0.0
R腳本的集合可能對繪製GWAS結果有用。
需要安裝以下R Pakages來運行這些RScript:
optparse,data.table,rcolorbrewer,plotrix,pwr,map2ncbi,basisplotter,devtools devtools :: install_github('josephcrispell/basticplotter')
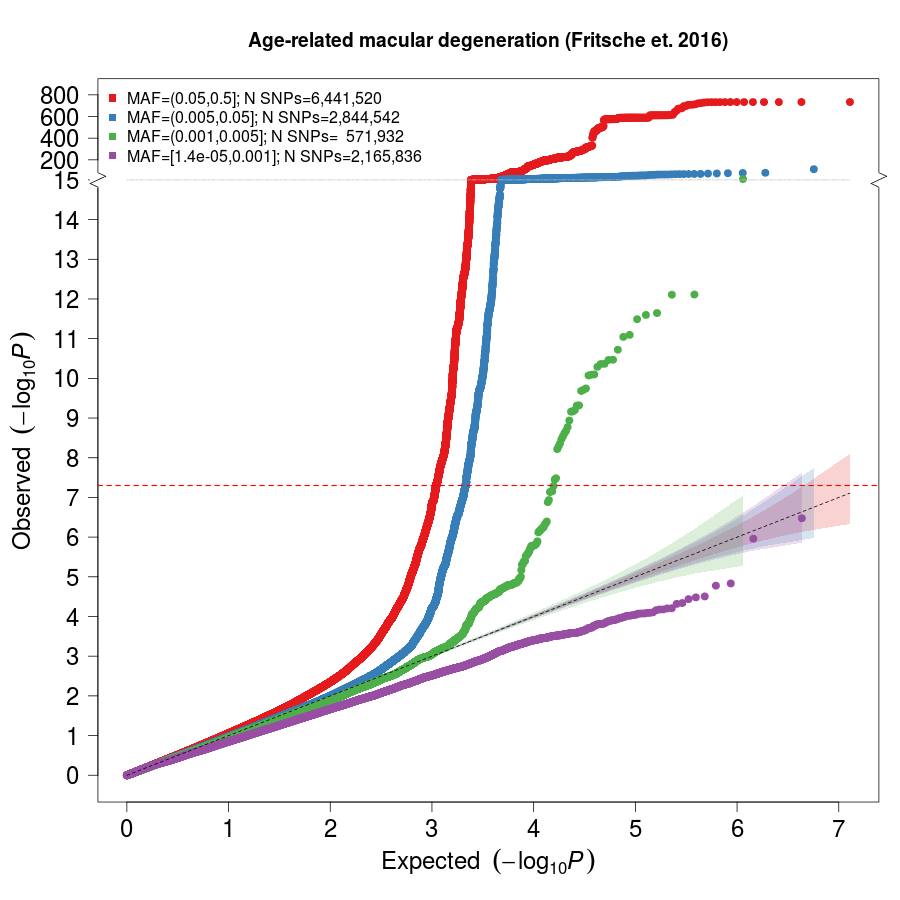
頻率bined and稀釋QQ圖。
請使用以下命令查看所需的/可用的RScript參數
Rscript QQplot.r --help
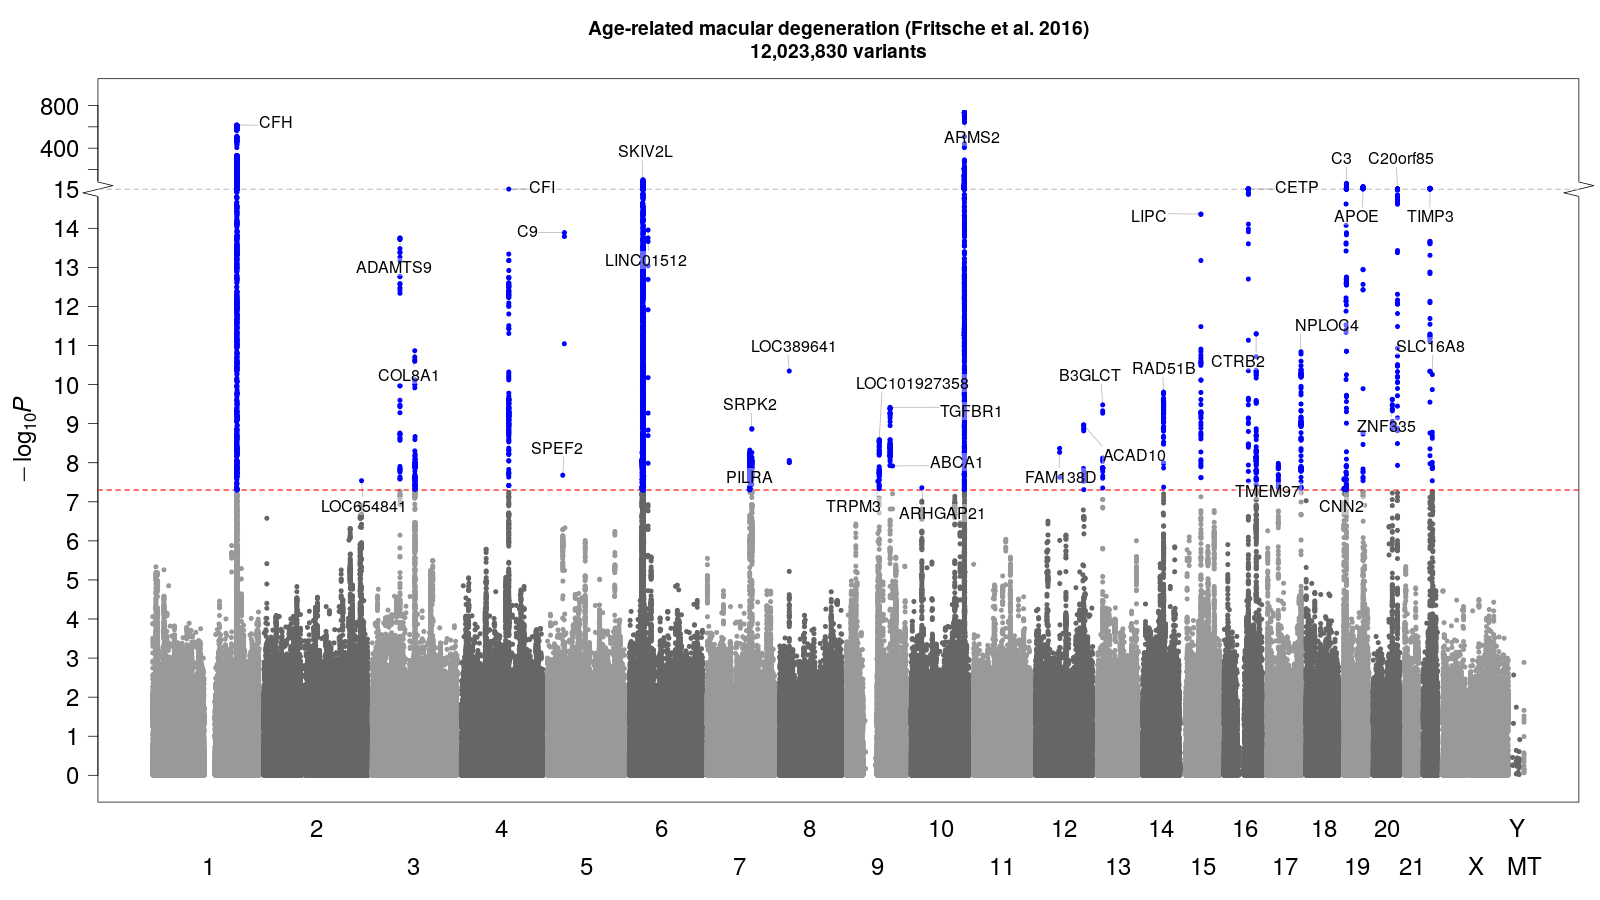
快速曼哈頓情節腳本。請使用以下命令查看所需的/可用的RScript參數
Rscript ManhattanPlot.r --help
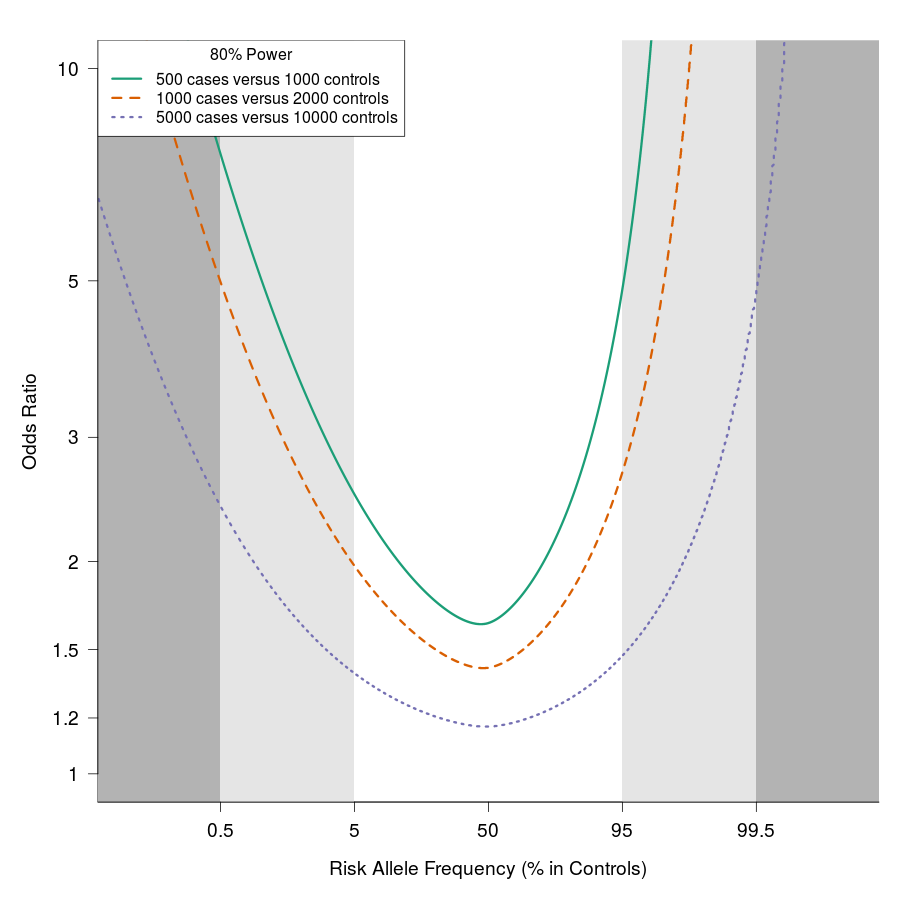
基於Cohen的效果尺寸計算的80%功率圖,如“ PWR” R軟件包中實現的比例計算
Rscript PowerPlot.r --help
| 鉻 | pos | MAF | PVALUE |
|---|---|---|---|
| 1 | 1 | 0.05 | 0.99 |
| 2 | 2 | 0.15 | 0.1 |
| 3 | 3 | 0.5 | 0.25 |
 Rscript QQplot.r
--input ExampleGWAS.txt
--prefix Example
--maf MAF
--pvalue PVALUE
--maintitle 'An Example QQ plot'


# GWAS results from http://csg.sph.umich.edu/abecasis/public/amd2015/Fritsche_2015_AdvancedAMD.txt.gz
Rscript ManhattanPlot.r
--input Fritsche_2015_AdvancedAMD.txt.gz
--prefix Example
--chr Chrom
--pos Pos
--pvalue GC.Pvalue
--coltop T
--maintitle 'Age-related macular degeneration (Fritsche et al. 2016)'
--threads 8


Rscript PowerPlot.r
--prefix Example
--cases 500,1000,5000
--controls 1000,2000,10000
--minMAF 0.001
--alpha 5E-8


