gwasTools
1.0.0
Une collection de scripts R qui pourraient être utiles pour tracer les résultats GWAS.
Les P-pakages suivants doivent être installés pour exécuter ces rscripts:
OptParse, Data.Table, RcolorBrewer, Plotrix, PWR, MAP2NCBI, BasicPlotter, Devtools Devtools :: install_github ('Josephcrispell / BasicPlotter')
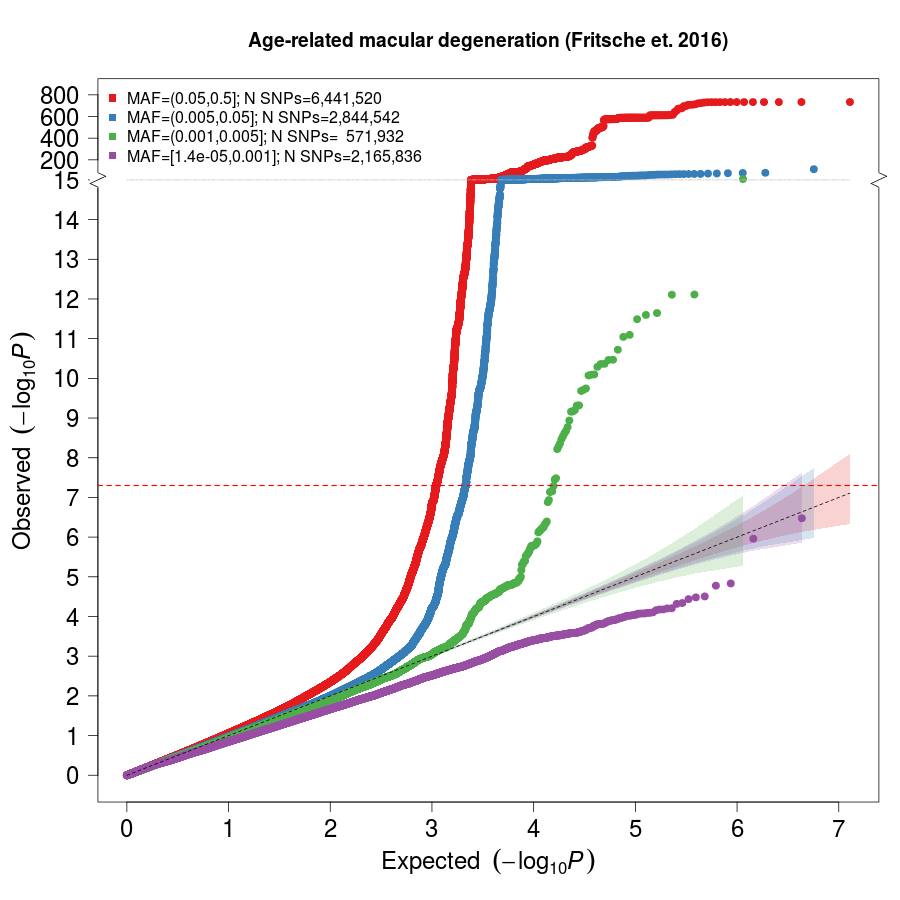
Fréquence Bacned et aminciez le tracé QQ.
Veuillez consulter les paramètres RScript requis / disponibles en utilisant la commande suivante
Rscript QQplot.r --help
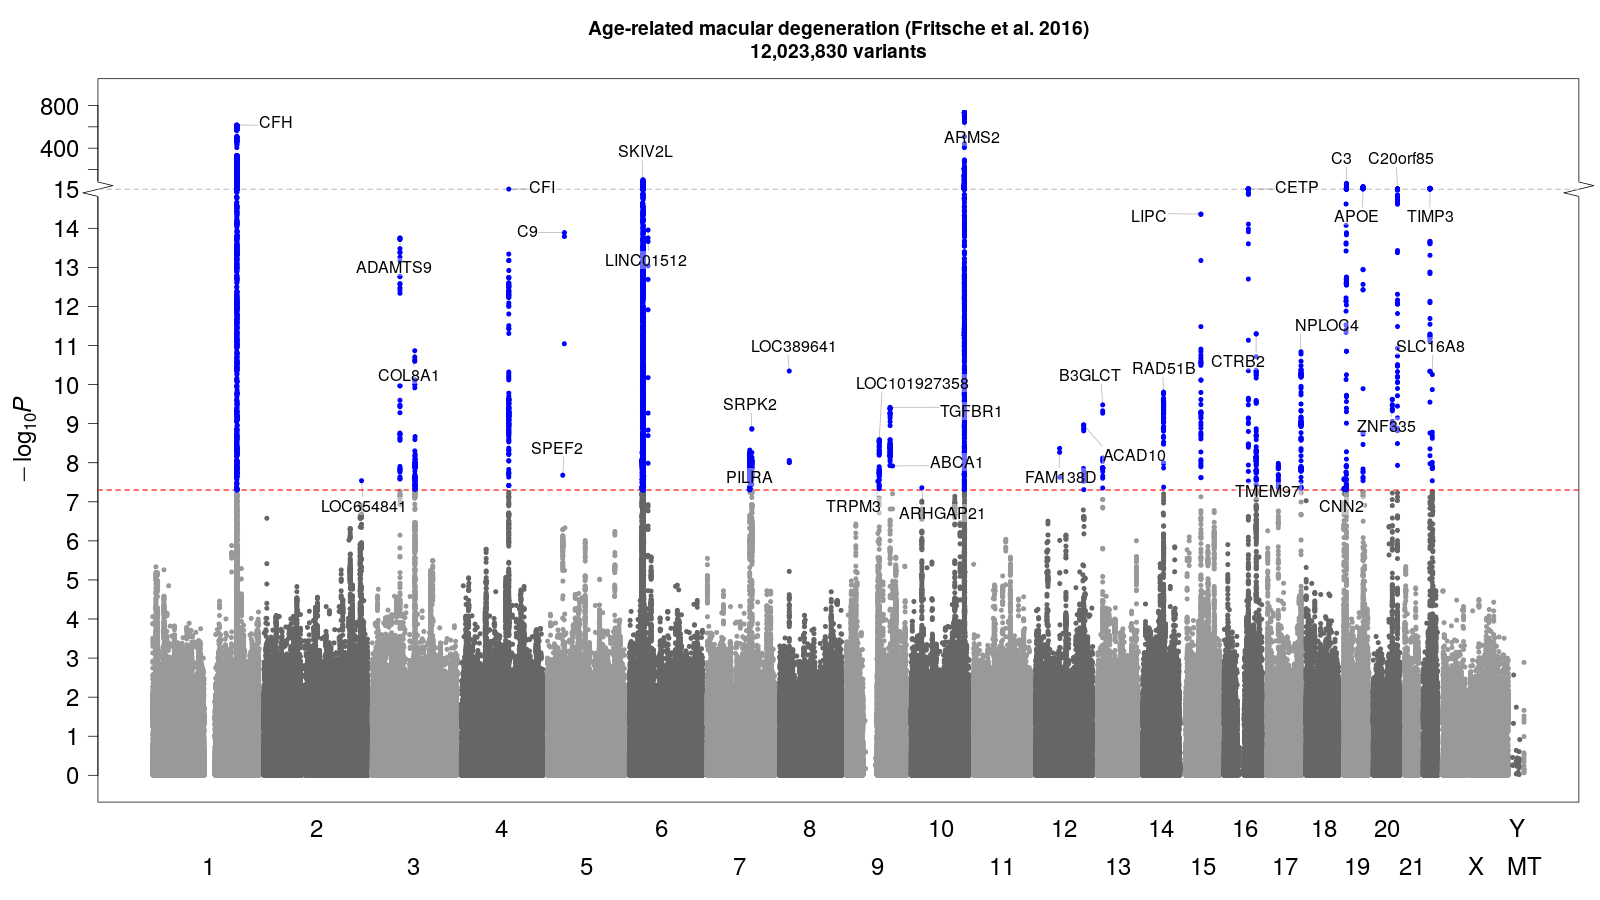
Script Fast Manhattan Plot. Veuillez consulter les paramètres RScript requis / disponibles en utilisant la commande suivante
Rscript ManhattanPlot.r --help
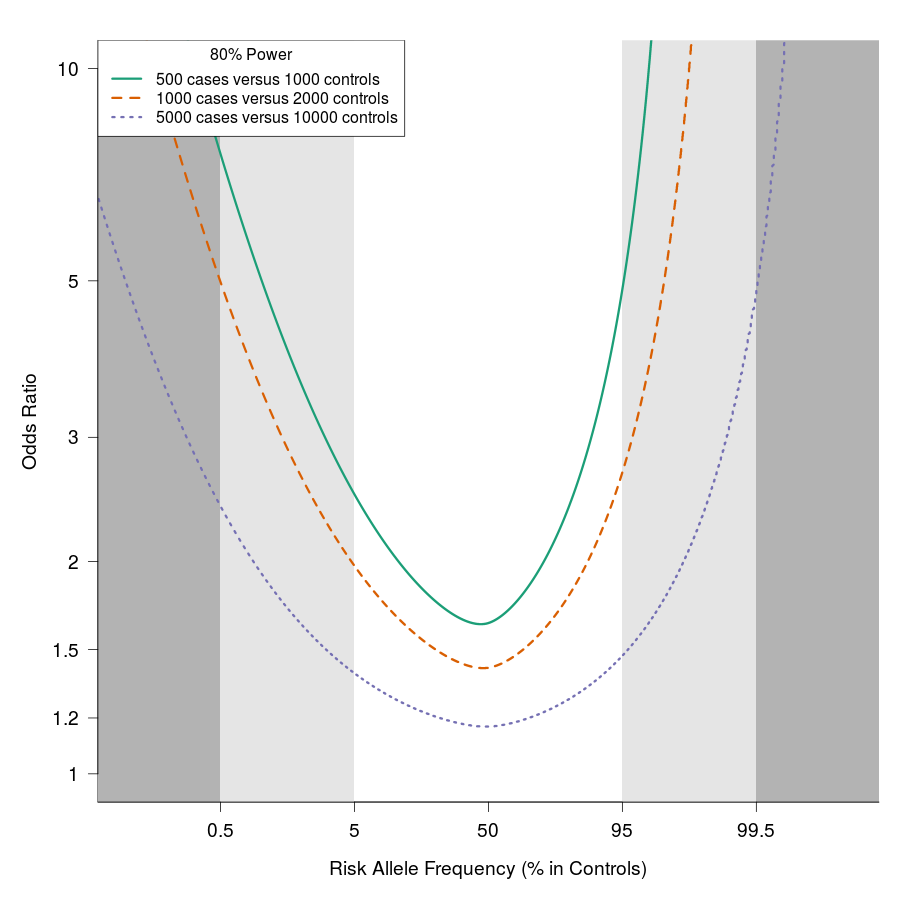
80% PLOCES PUIVENTS BASÉE SUR LE CALLACTION DE LA TAILLE EFFET DE COHEN POUR LES PROPORTIONS APPRÉPLÉS DANS LE POUR LE POURCE 'R' R
Rscript PowerPlot.r --help
| Chrom | Point de point | MAF | Pvalue |
|---|---|---|---|
| 1 | 1 | 0,05 | 0,99 |
| 2 | 2 | 0,15 | 0.1 |
| 3 | 3 | 0,5 | 0,25 |
 Rscript QQplot.r
--input ExampleGWAS.txt
--prefix Example
--maf MAF
--pvalue PVALUE
--maintitle 'An Example QQ plot'


# GWAS results from http://csg.sph.umich.edu/abecasis/public/amd2015/Fritsche_2015_AdvancedAMD.txt.gz
Rscript ManhattanPlot.r
--input Fritsche_2015_AdvancedAMD.txt.gz
--prefix Example
--chr Chrom
--pos Pos
--pvalue GC.Pvalue
--coltop T
--maintitle 'Age-related macular degeneration (Fritsche et al. 2016)'
--threads 8


Rscript PowerPlot.r
--prefix Example
--cases 500,1000,5000
--controls 1000,2000,10000
--minMAF 0.001
--alpha 5E-8


