gwasTools
1.0.0
A collection of R scripts that might be useful to plot GWAS results.
The following R pakages need to be installed for running these Rscripts:
optparse, data.table, RColorBrewer, plotrix, pwr, Map2NCBI, basicPlotteR, devtools devtools::install_github('JosephCrispell/basicPlotteR')
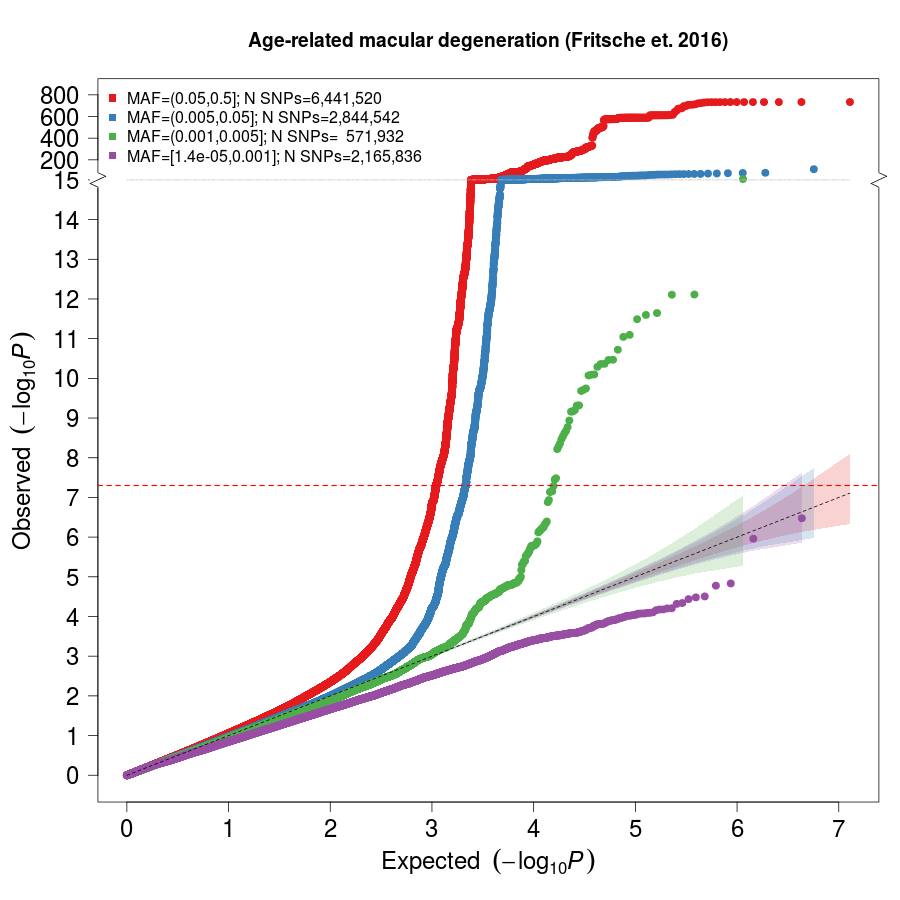
Frequency binned and thinned QQ plot.
Please check out the required/available Rscript parameters by using the following command
Rscript QQplot.r --help
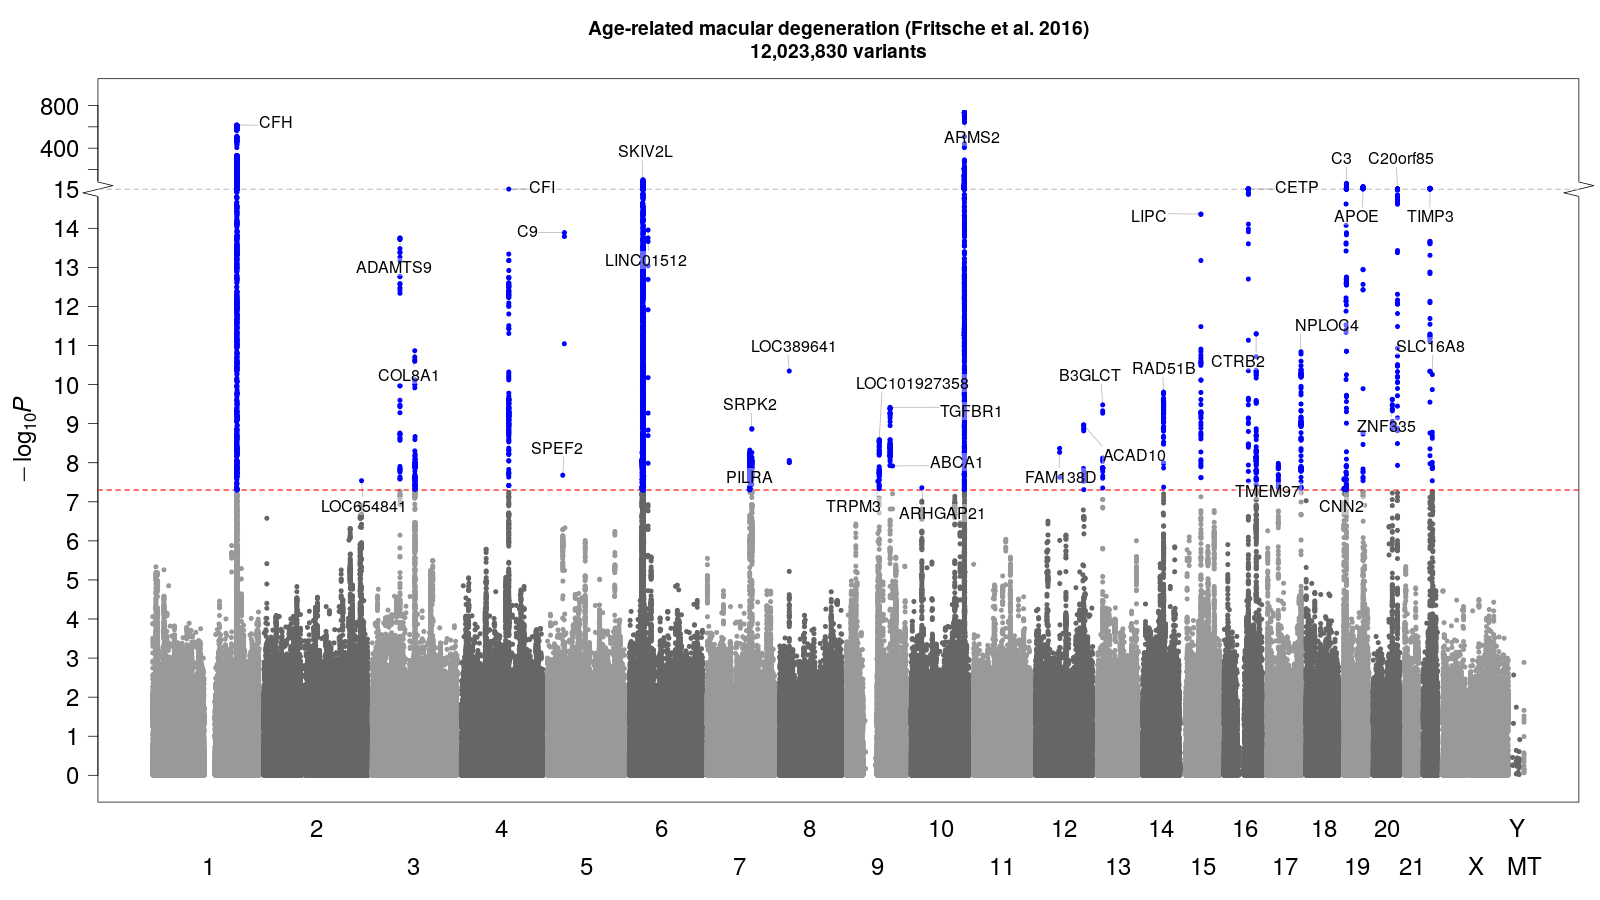
Fast Manhattan plot script. Please check out the required/available Rscript parameters by using the following command
Rscript ManhattanPlot.r --help
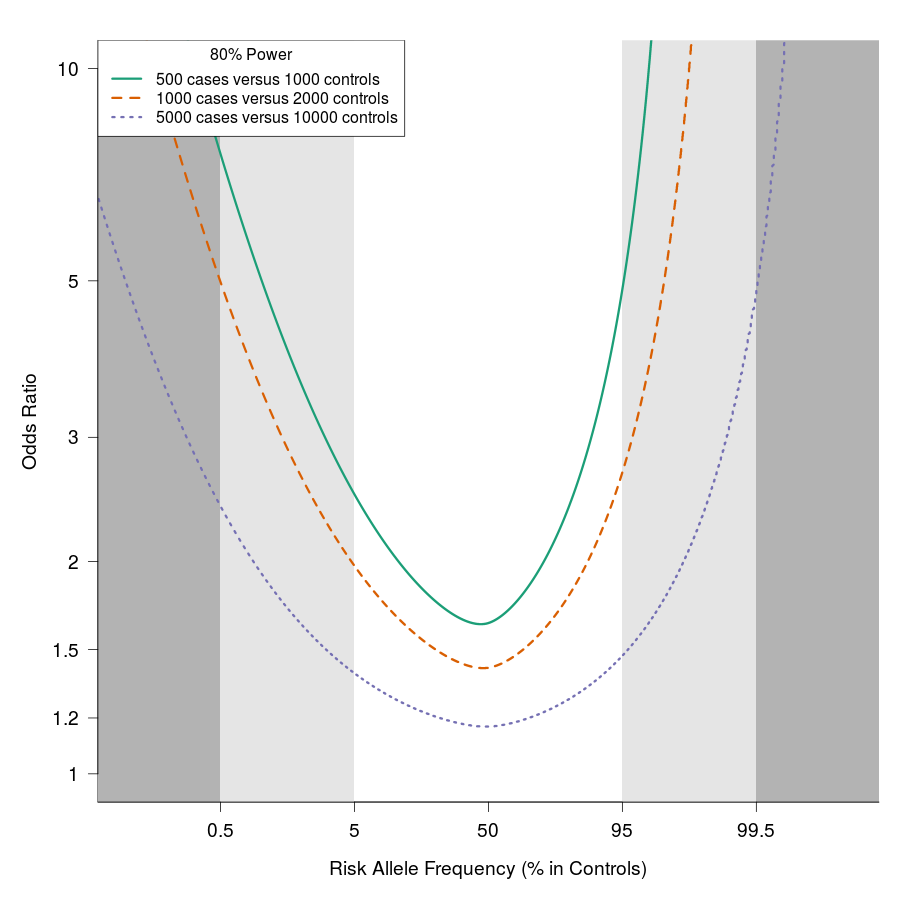
80% Power plots based on Cohen's effect size calculation for proportions as implemented in the 'pwr' R package
Rscript PowerPlot.r --help
| CHROM | POS | MAF | PVALUE |
|---|---|---|---|
| 1 | 1 | 0.05 | 0.99 |
| 2 | 2 | 0.15 | 0.1 |
| 3 | 3 | 0.5 | 0.25 |
Rscript QQplot.r
--input ExampleGWAS.txt
--prefix Example
--maf MAF
--pvalue PVALUE
--maintitle 'An Example QQ plot'


# GWAS results from http://csg.sph.umich.edu/abecasis/public/amd2015/Fritsche_2015_AdvancedAMD.txt.gz
Rscript ManhattanPlot.r
--input Fritsche_2015_AdvancedAMD.txt.gz
--prefix Example
--chr Chrom
--pos Pos
--pvalue GC.Pvalue
--coltop T
--maintitle 'Age-related macular degeneration (Fritsche et al. 2016)'
--threads 8


Rscript PowerPlot.r
--prefix Example
--cases 500,1000,5000
--controls 1000,2000,10000
--minMAF 0.001
--alpha 5E-8


