xai
v0.1.0
XAI是一个机器学习库,其核心设计具有AI的解释性。 XAI包含各种工具,可用于分析和评估数据和模型。 XAI图书馆由道德AI和ML研究所维护,它是根据负责任的机器学习原理开发的。
您可以在https://ethicalml.github.io/xai/index.html上找到文档。您还可以在伦敦Tensorflow伦敦查看我们的演讲,该想法首先是构思的 - 该谈话还包含了有关此库中的定义和原理的见解。
| 这场演讲的视频在伦敦Pydata 2019会议上介绍,该视频概述了机器学习的动机解释性以及使用XAI库介绍解释性和减轻不想要的偏见的技术。 | 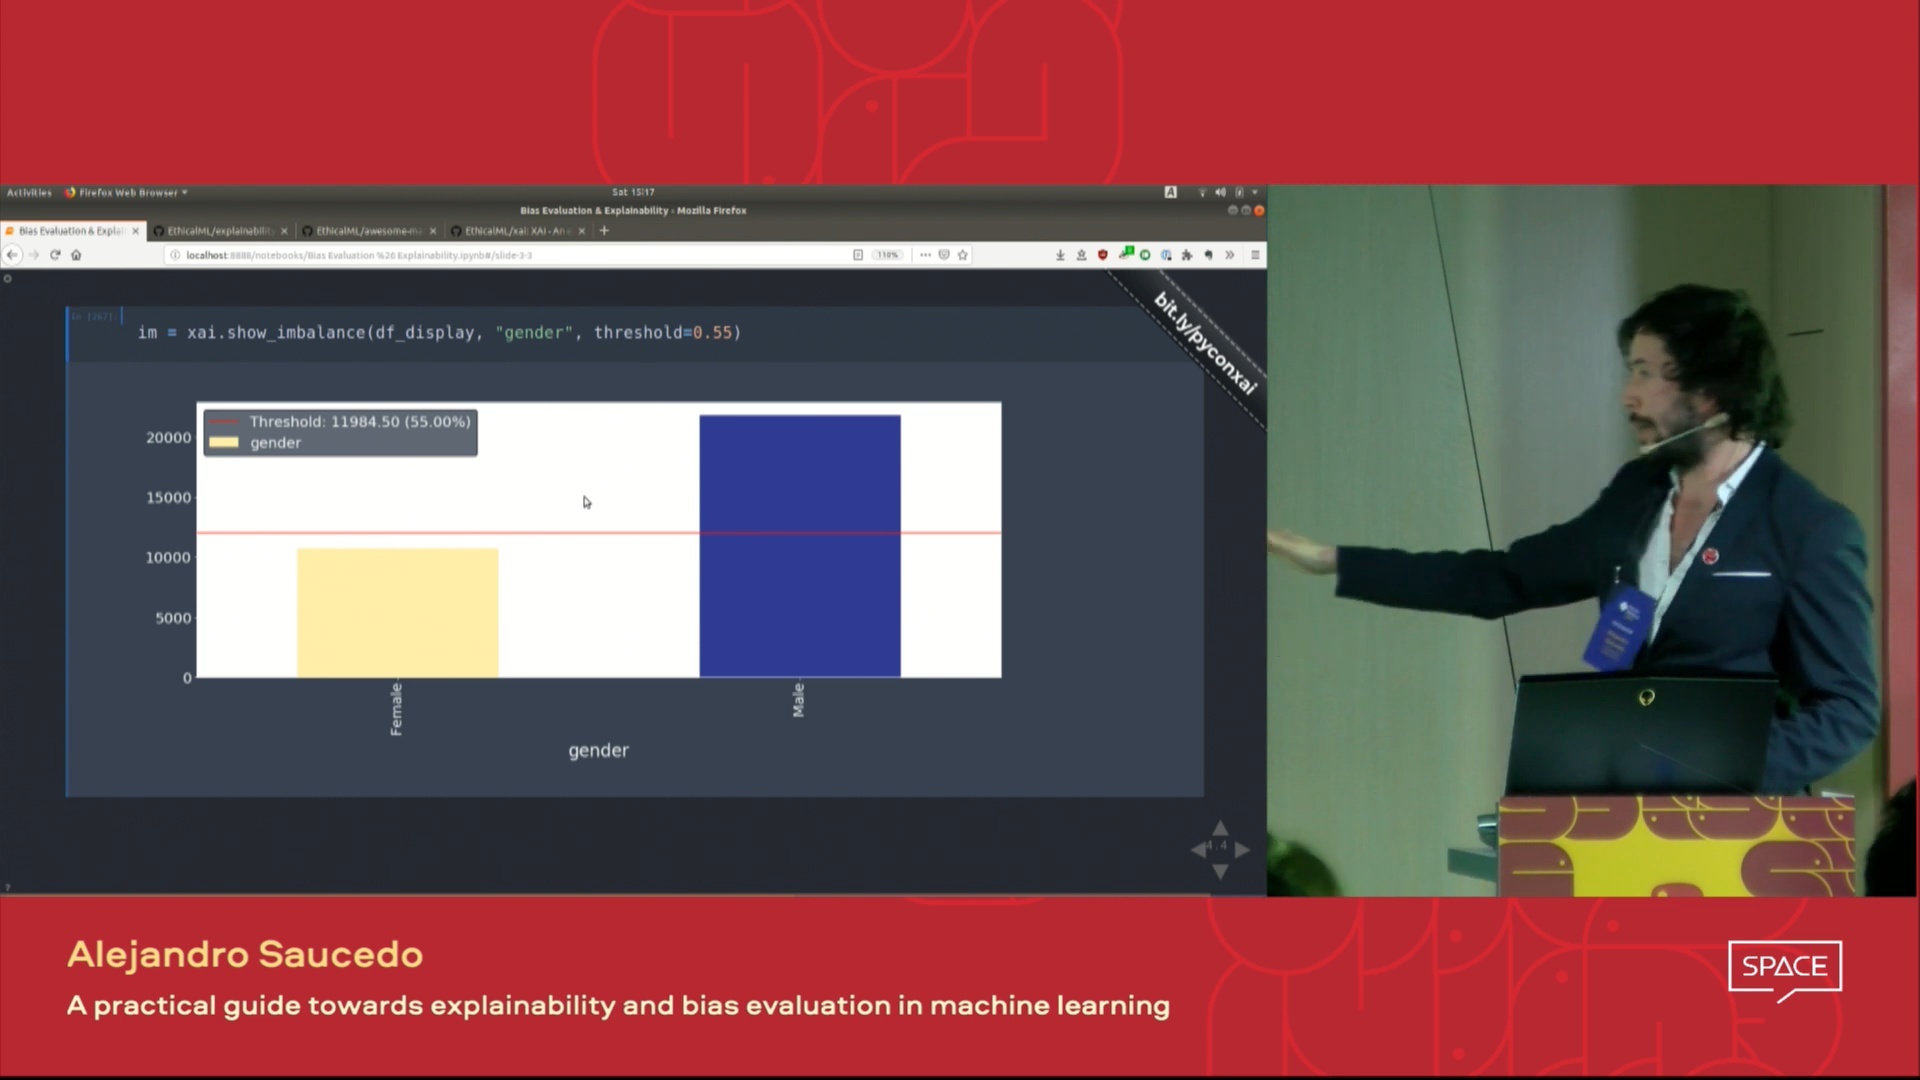 |
| 您想了解更多令人敬畏的机器学习解释性工具吗?查看我们社区建造的“令人敬畏的机器学习生产和操作”列表,其中包含大量的解释性,隐私,编排以及其他工具的列表。 | 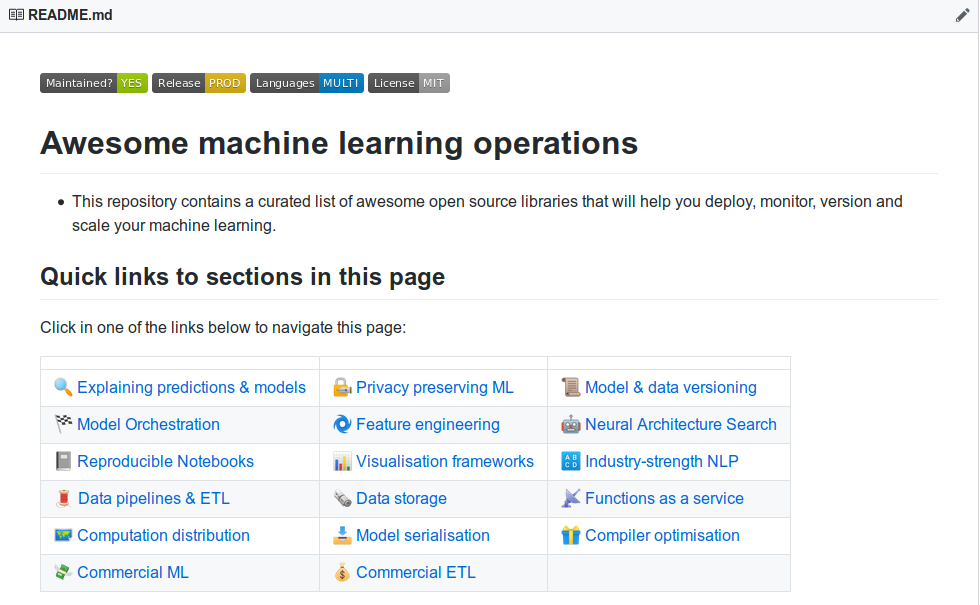 |
如果您想查看一个功能齐全的演示,则该仓库并在示例文件夹中运行示例jupyter笔记本。
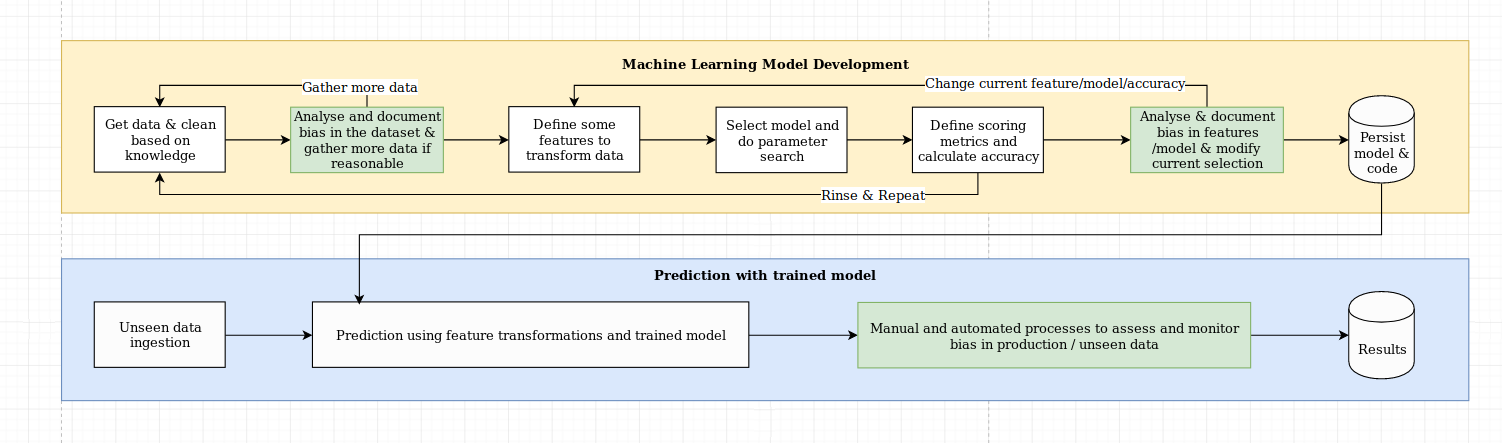
我们认为解释性的挑战不仅仅是算法挑战,它需要将数据科学的最佳实践与特定于领域的知识相结合。 XAI库旨在授权机器学习工程师和相关领域专家分析端到端解决方案并确定可能导致相对于所需目标而导致优势性能的差异。更广泛地说,XAI库是使用可解释的机器学习的三个步骤设计的,其中涉及1)数据分析,2)模型评估和3)生产监控。
我们提供了上图上面提到的以下三个步骤的视觉概述:
XAI包在PYPI上。要安装您可以运行:
pip install xai
另外,您可以通过克隆回购和运行来从源安装:
python setup.py install
您可以在示例文件夹中找到示例用法。
使用XAI,您可以识别数据中的不平衡。为此,我们将从XAI库中加载人口普查数据集。
 import xai . data
df = xai . data . load_census ()
df . head ()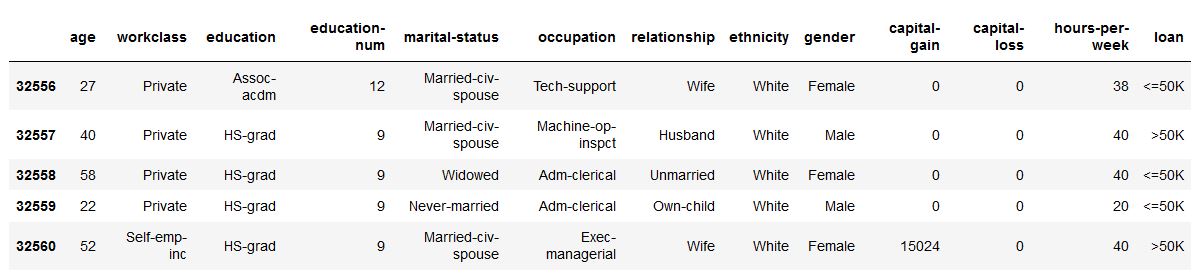
ims = xai . imbalance_plot ( df , "gender" )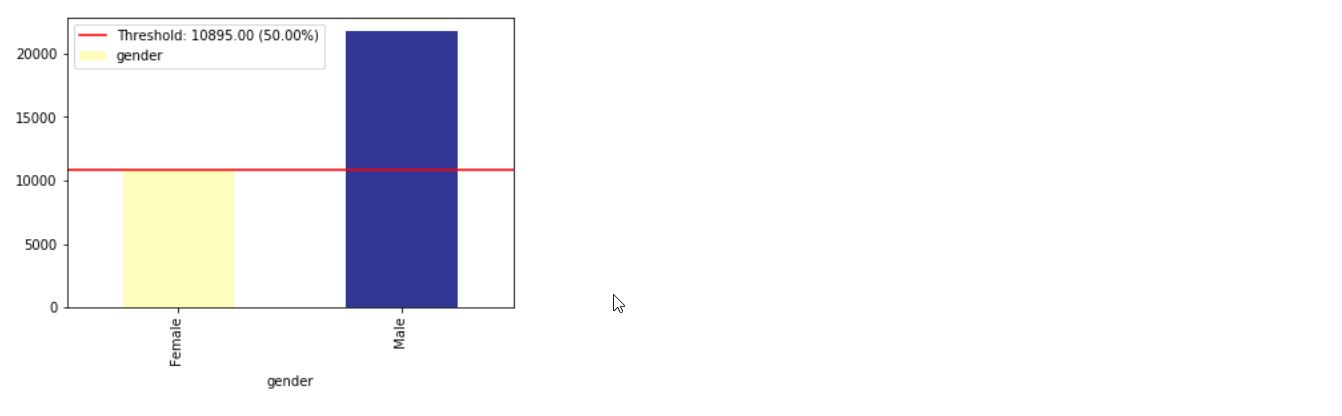
im = xai . imbalance_plot ( df , "gender" , "loan" )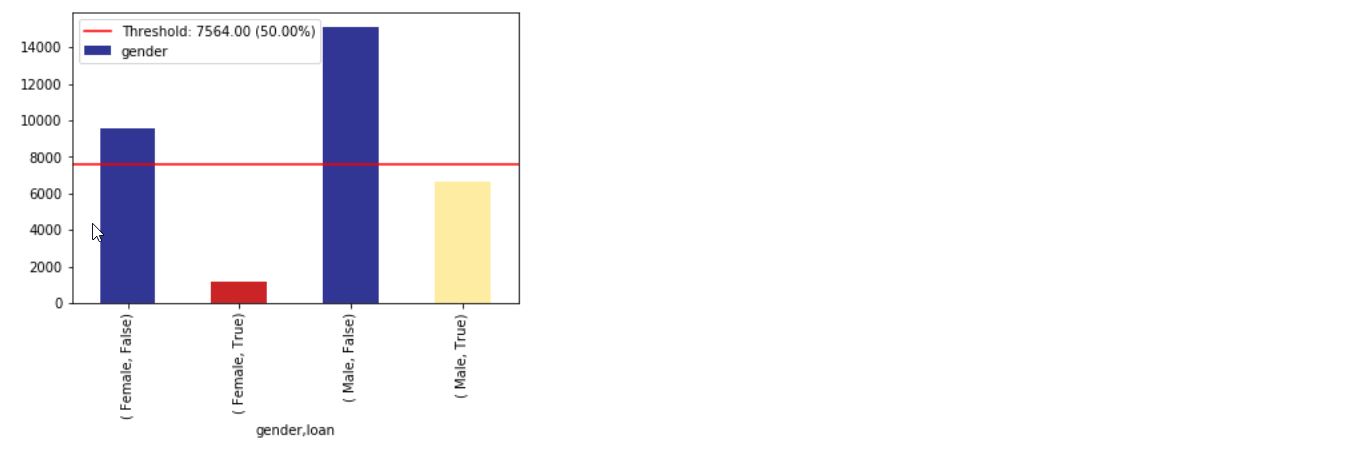
bal_df = xai . balance ( df , "gender" , "loan" , upsample = 0.8 )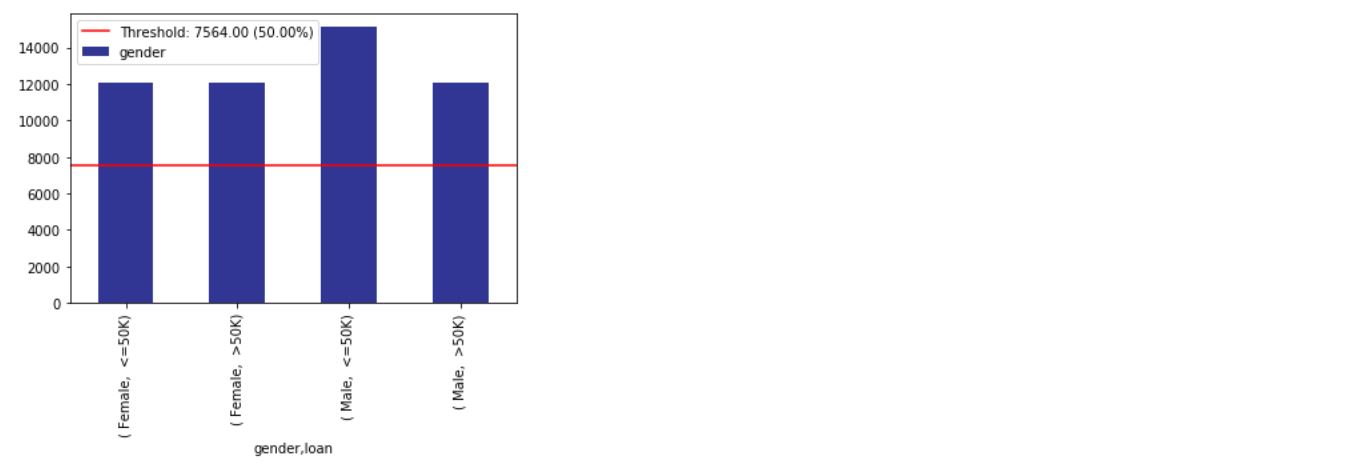
 groups = xai . group_by_columns ( df , [ "gender" , "loan" ])
for group , group_df in groups :
    print ( group )
    print ( group_df [ "loan" ]. head (), " n " )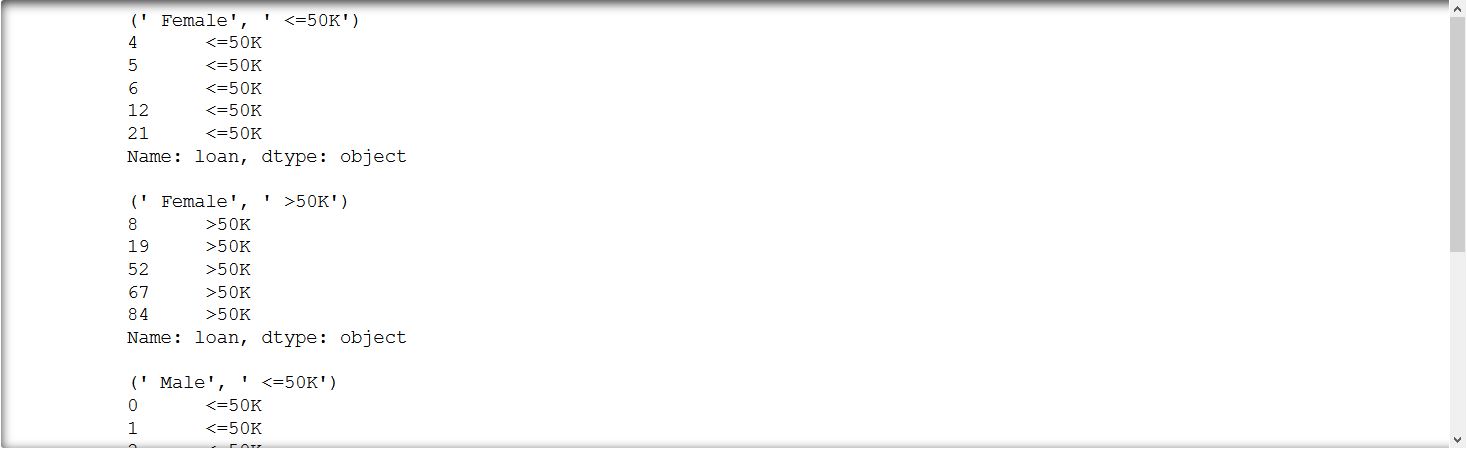
_ = xai . correlations ( df , include_categorical = True , plot_type = "matrix" )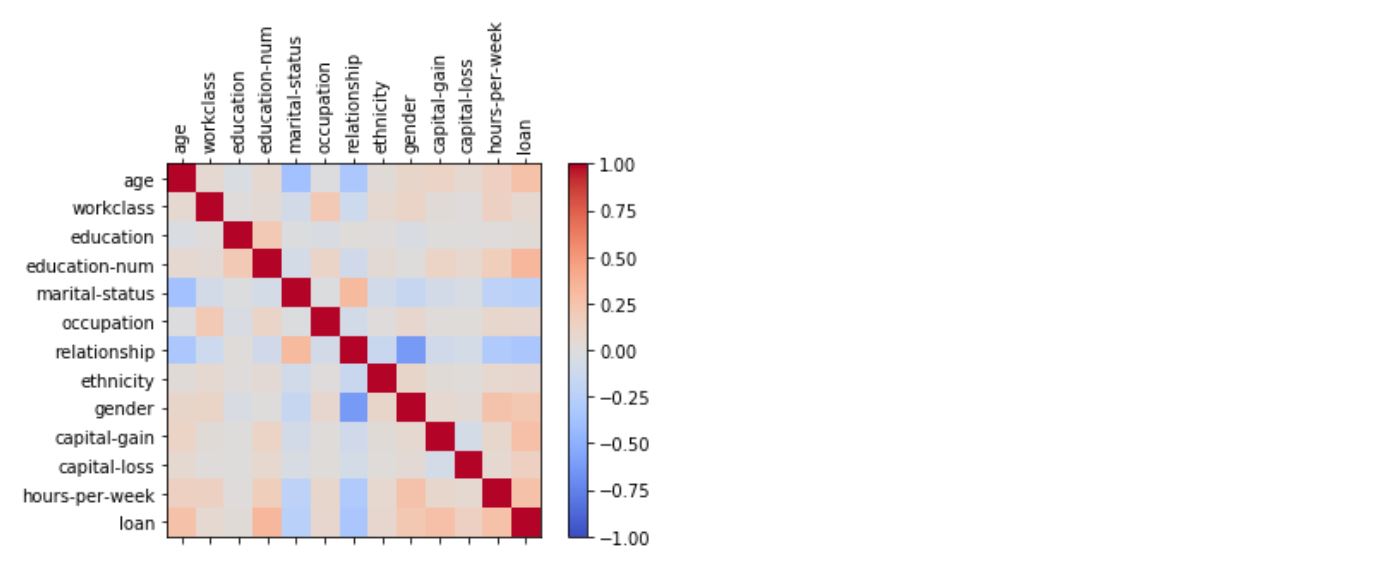
_ = xai . correlations ( df , include_categorical = True )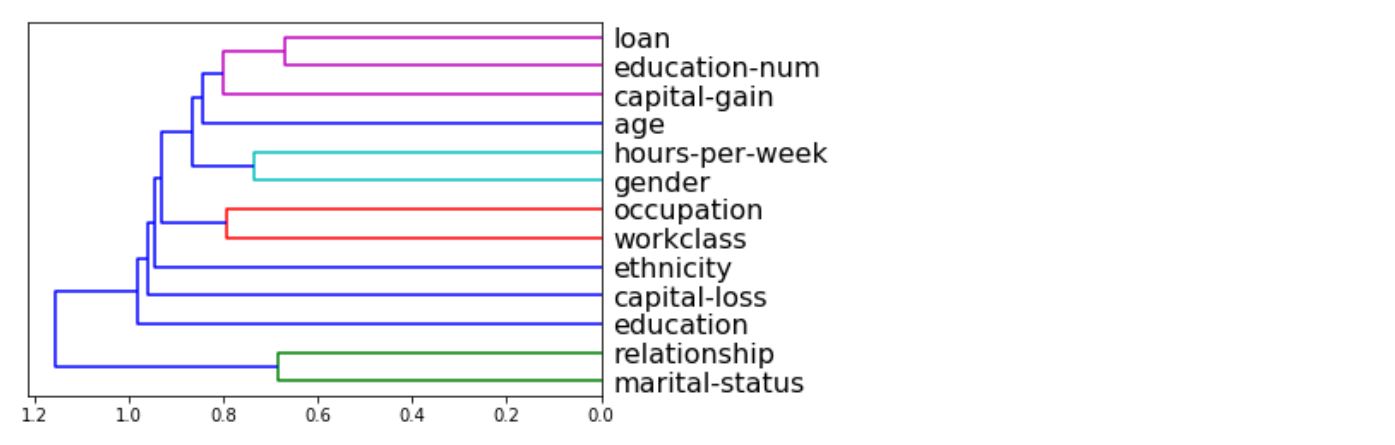
 # Balanced train-test split with minimum 300 examples of
#     the cross of the target y and the column gender
x_train , y_train , x_test , y_test , train_idx , test_idx =
    xai . balanced_train_test_split (
            x , y , "gender" ,
            min_per_group = 300 ,
            max_per_group = 300 ,
            categorical_cols = categorical_cols )

x_train_display = bal_df [ train_idx ]
x_test_display = bal_df [ test_idx ]

print ( "Total number of examples: " , x_test . shape [ 0 ])

df_test = x_test_display . copy ()
df_test [ "loan" ] = y_test

_ = xai . imbalance_plot ( df_test , "gender" , "loan" , categorical_cols = categorical_cols )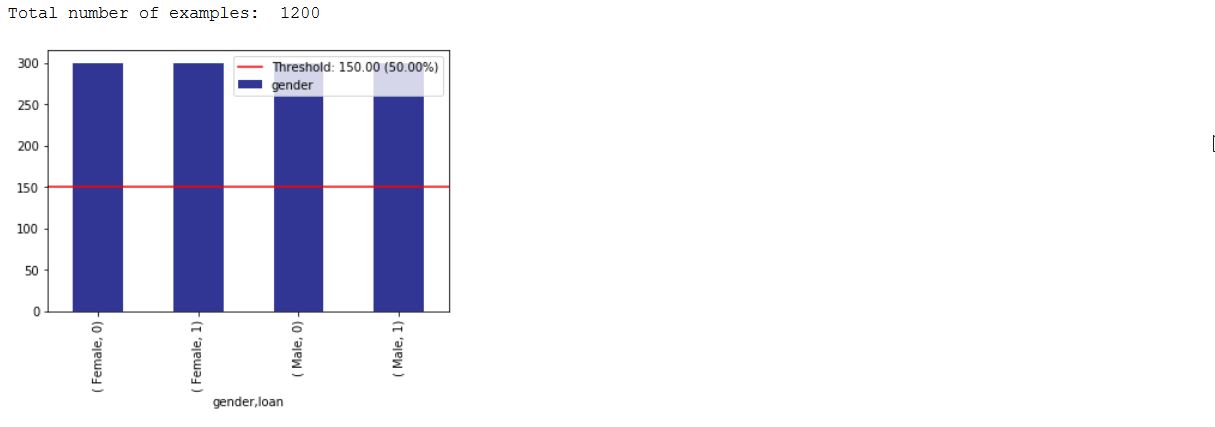
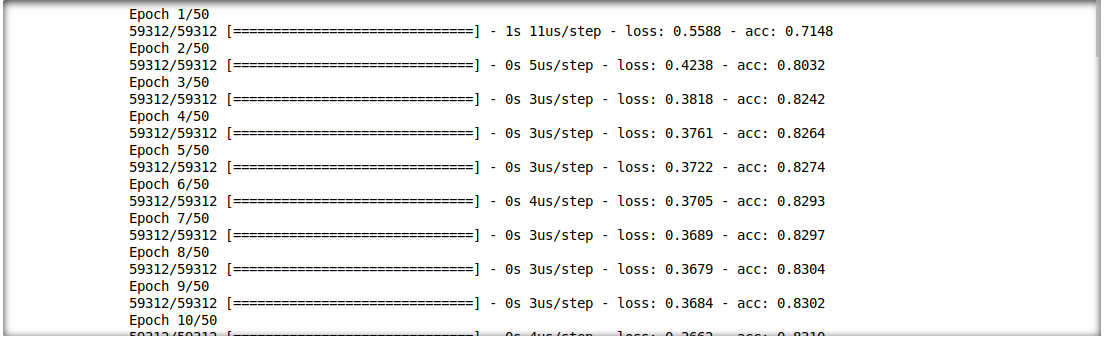
我们还能够分析推理结果和输入特征之间的相互作用。为此,我们将训练单层深度学习模型。
 model = build_model(proc_df.drop("loan", axis=1))

model.fit(f_in(x_train), y_train, epochs=50, batch_size=512)

probabilities = model.predict(f_in(x_test))
predictions = list((probabilities >= 0.5).astype(int).T[0])
 def get_avg ( x , y ):
    return model . evaluate ( f_in ( x ), y , verbose = 0 )[ 1 ]

imp = xai . feature_importance ( x_test , y_test , get_avg )

imp . head ()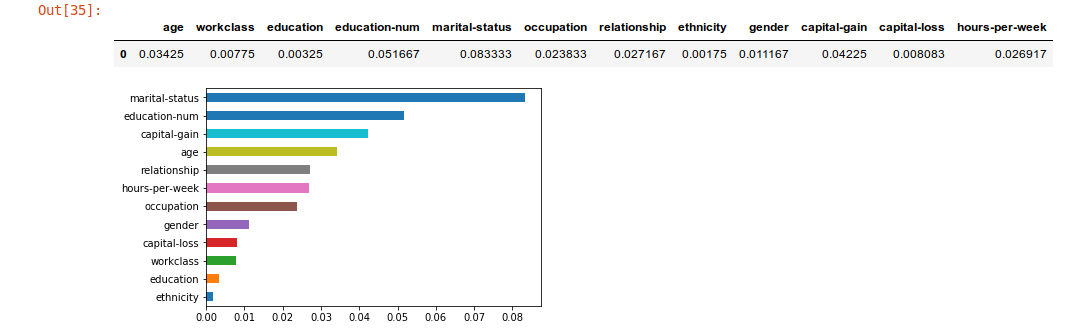
 _ = xai . metrics_plot (
        y_test ,
        probabilities )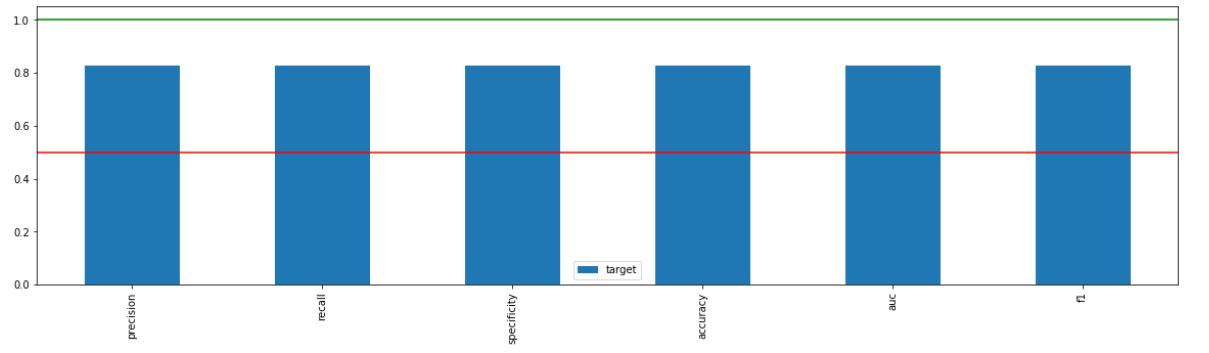
 _ = xai . metrics_plot (
    y_test ,
    probabilities ,
    df = x_test_display ,
    cross_cols = [ "gender" ],
    categorical_cols = categorical_cols )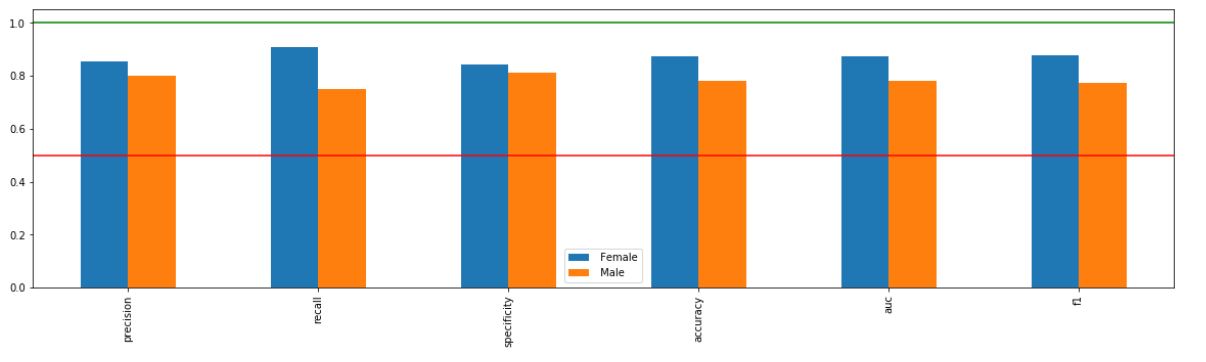
 _ = xai . metrics_plot (
    y_test ,
    probabilities ,
    df = x_test_display ,
    cross_cols = [ "gender" , "ethnicity" ],
    categorical_cols = categorical_cols )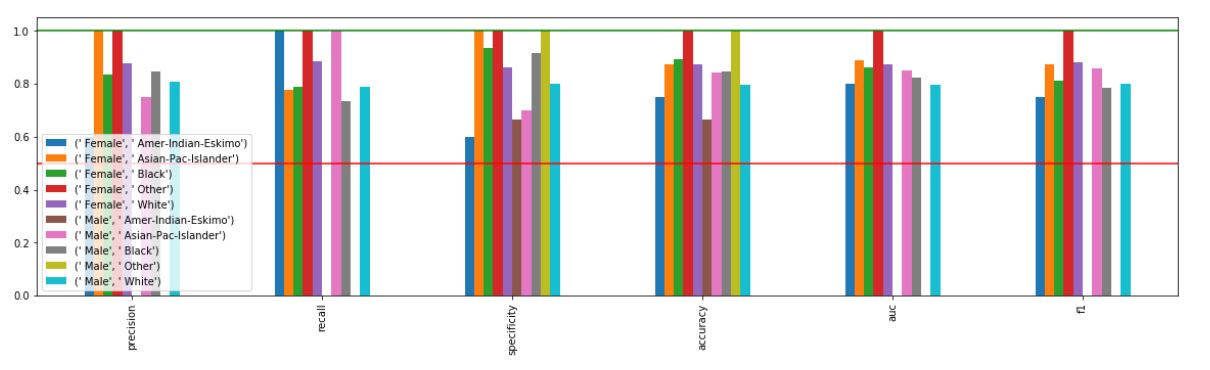
xai . confusion_matrix_plot ( y_test , pred )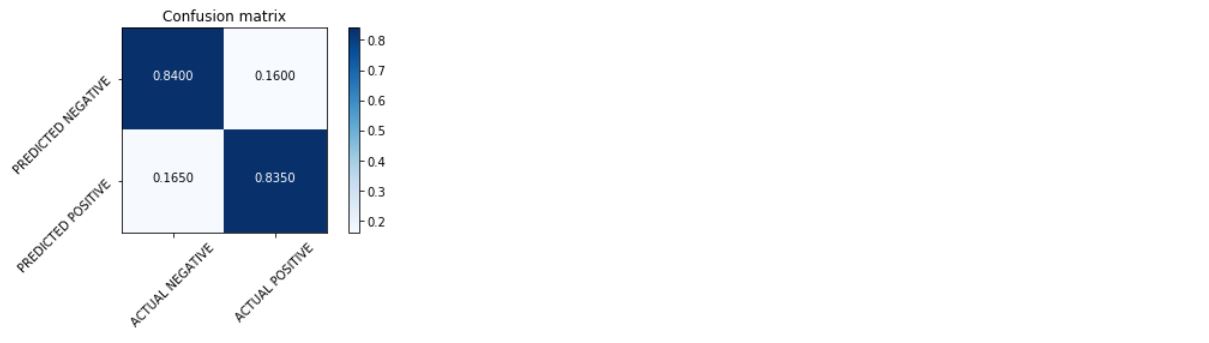
_ = xai . roc_plot ( y_test , probabilities )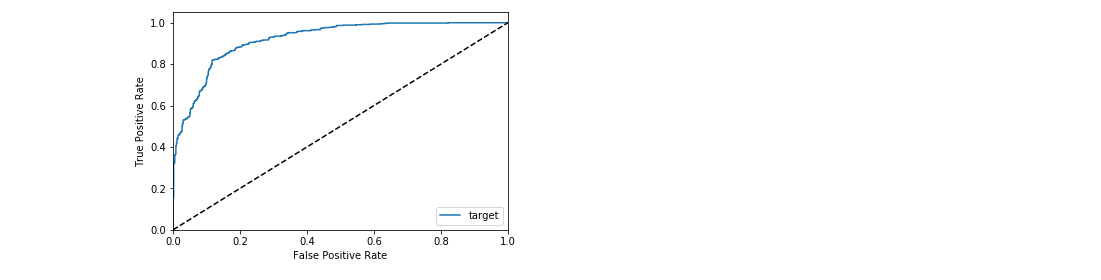
 protected = [ "gender" , "ethnicity" , "age" ]
_ = [ xai . roc_plot (
    y_test ,
    probabilities ,
    df = x_test_display ,
    cross_cols = [ p ],
    categorical_cols = categorical_cols ) for p in protected ]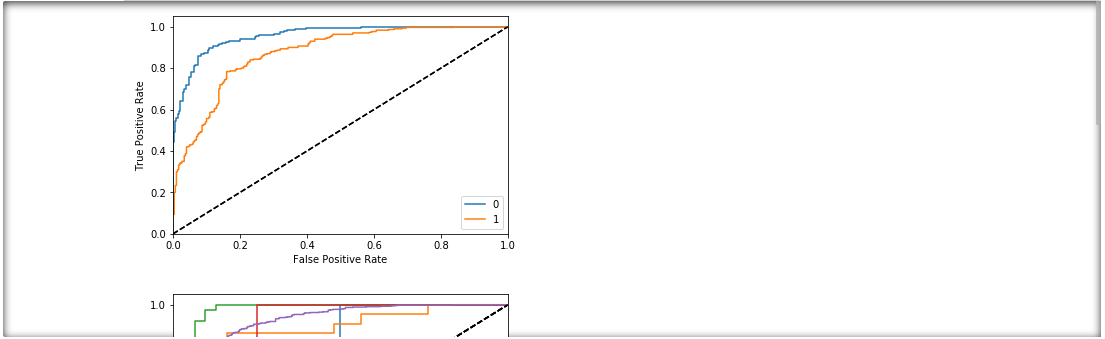
 d = xai . smile_imbalance (
    y_test ,
    probabilities )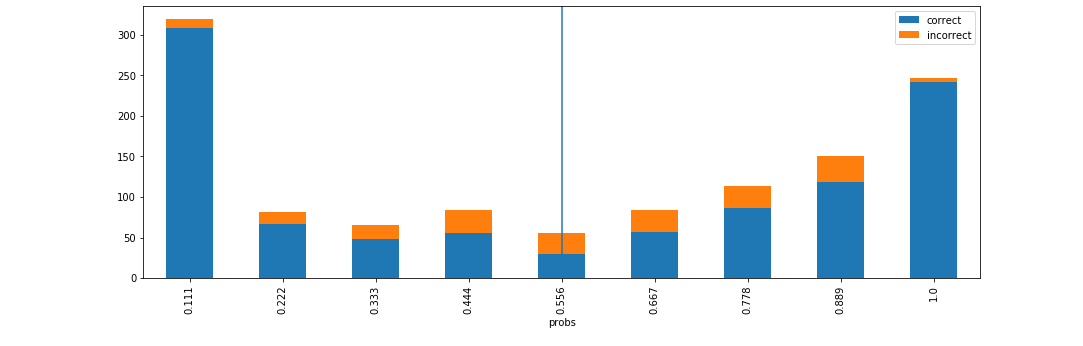
 d = xai . smile_imbalance (
    y_test ,
    probabilities ,
    display_breakdown = True )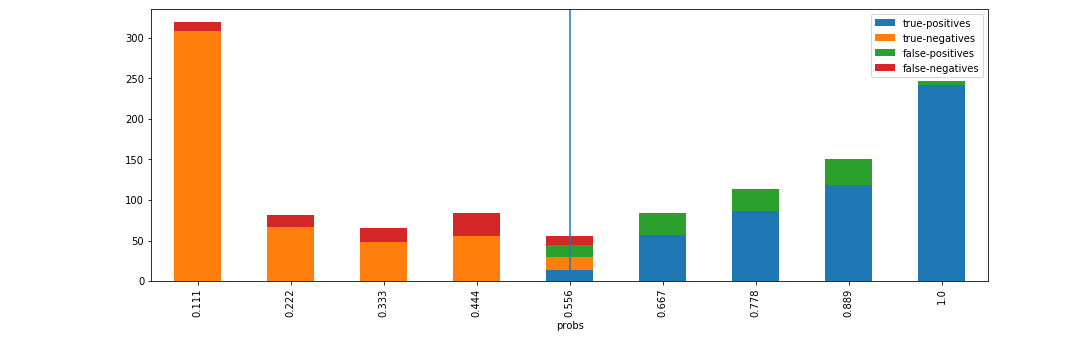
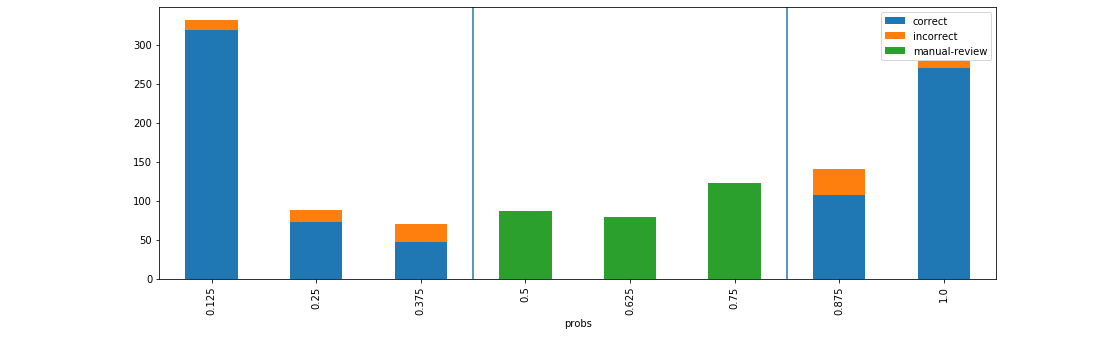
 d = xai . smile_imbalance (
    y_test ,
    probabilities ,
    bins = 9 ,
    threshold = 0.75 ,
    manual_review = 0.375 ,
    display_breakdown = False )