xai
v0.1.0
Xai는 핵심에서 AI 설명 성으로 설계된 머신 러닝 라이브러리입니다. XAI에는 데이터 및 모델을 분석하고 평가할 수있는 다양한 도구가 포함되어 있습니다. XAI 라이브러리는 Institute for Ethical AI & ML에 의해 유지되며 책임있는 기계 학습의 8 가지 원칙을 기반으로 개발되었습니다.
https://ethicalml.github.io/xai/index.html에서 문서를 찾을 수 있습니다. 또한 Tensorflow London에서 아이디어가 처음 고안된 대화를 확인할 수 있습니다.이 대화에는이 라이브러리의 정의와 원칙에 대한 통찰력도 포함되어 있습니다.
| 이 대화 비디오는 Pydata London 2019 컨퍼런스에서 발표 된 기계 학습 설명에 대한 동기와 XAI 라이브러리를 사용하여 설명 할 수없는 편견을 완화하는 기술뿐만 아니라 기술을 제공하는 기술에 대한 개요를 제공합니다. | 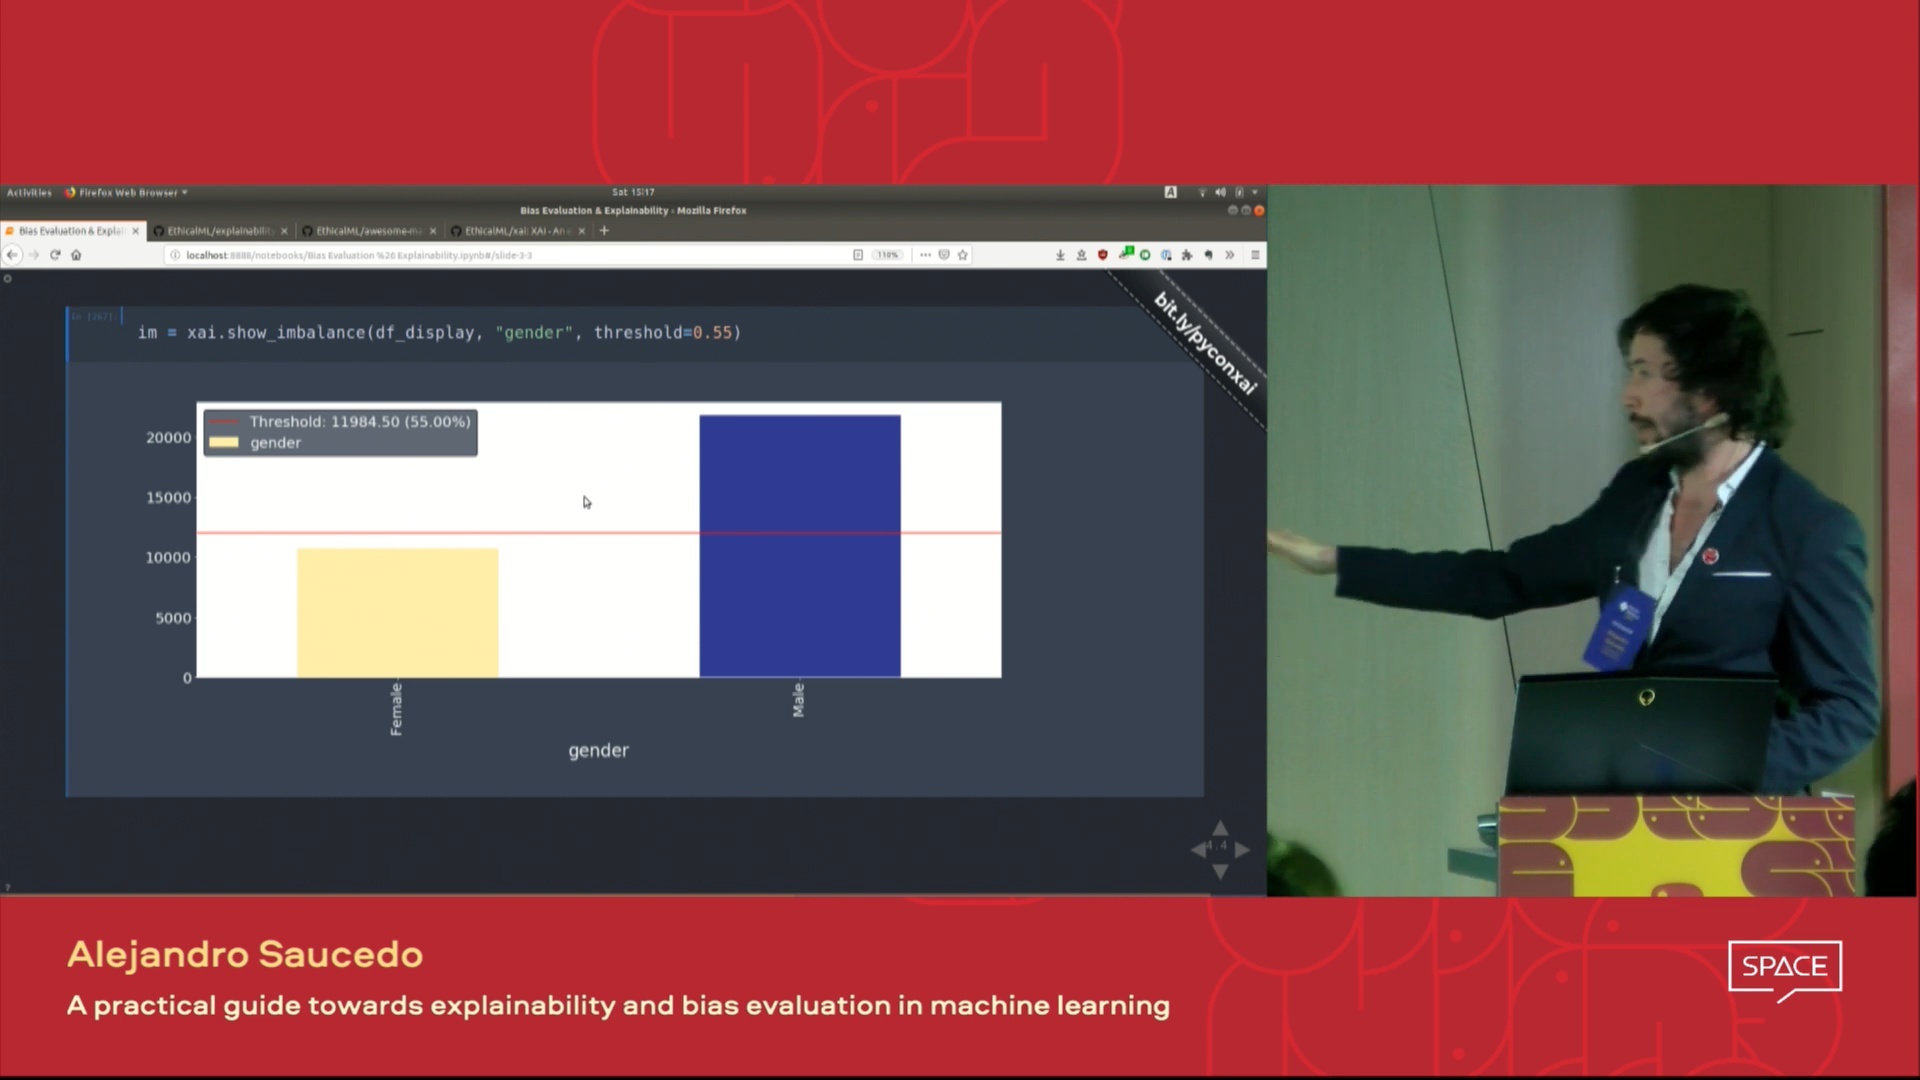 |
| 더 멋진 머신 러닝 설명 도구에 대해 배우고 싶습니까? 설명, 개인 정보, 오케스트레이션 등을위한 광범위한 도구 목록이 포함 된 커뮤니티 제작 "Awesome Machine Learning Production & Operations"목록을 확인하십시오. | 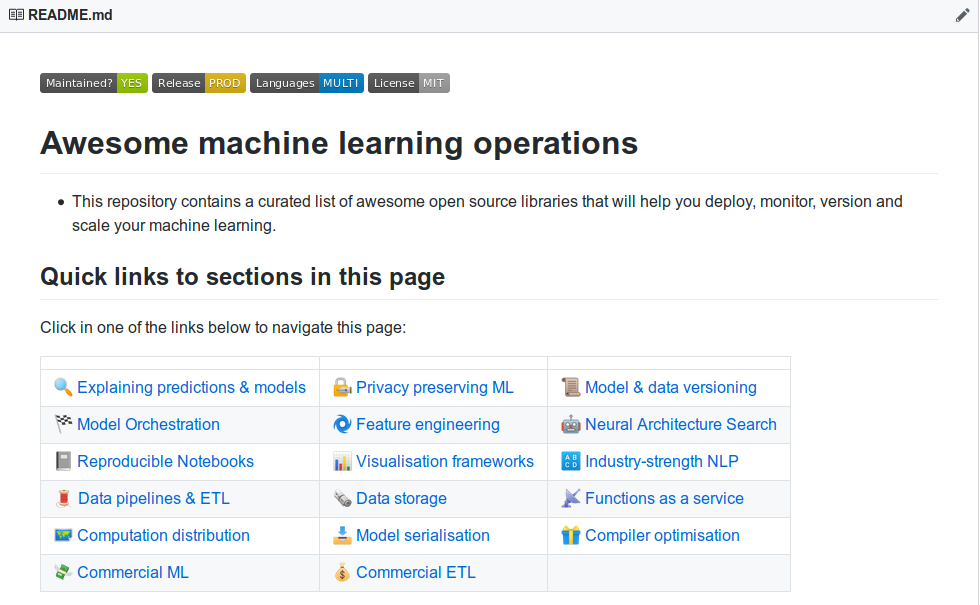 |
완전한 기능적인 데모를 보려면이 repo를 복제하고 예제 Jupyter Notebook을 실행하십시오.
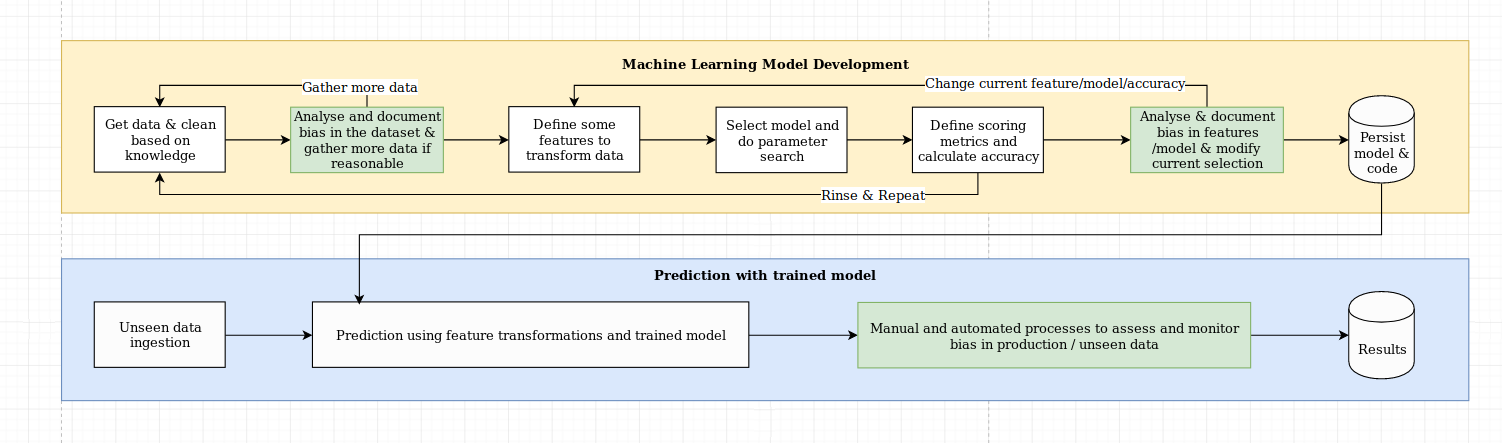
우리는 설명 가능성의 도전이 단순한 알고리즘 도전 이상으로, 데이터 과학 모범 사례와 도메인 별 지식의 조합이 필요합니다. XAI 라이브러리는 머신 러닝 엔지니어 및 관련 도메인 전문가가 엔드 투 엔드 솔루션을 분석하고 필요한 목표에 비해 하위 최적 성능을 초래할 수있는 불일치를 식별하도록 설계되었습니다. 보다 광범위하게, XAI 라이브러리는 1) 데이터 분석, 2) 모델 평가 및 3) 생산 모니터링을 포함하는 3 단계 설명 가능한 기계 학습을 사용하여 설계되었습니다.
이 다이어그램에서 위에서 언급 한이 세 단계에 대한 시각적 개요를 제공합니다.
Xai 패키지는 PYPI에 있습니다. 설치하려면 실행할 수 있습니다.
pip install xai
또는 REPO를 복제하고 실행하여 소스에서 설치할 수 있습니다.
python setup.py install
예제 폴더에서 예제 사용을 찾을 수 있습니다.
Xai를 사용하면 데이터의 불균형을 식별 할 수 있습니다. 이를 위해 XAI 라이브러리에서 인구 조사 데이터 세트를로드합니다.
 import xai . data
df = xai . data . load_census ()
df . head ()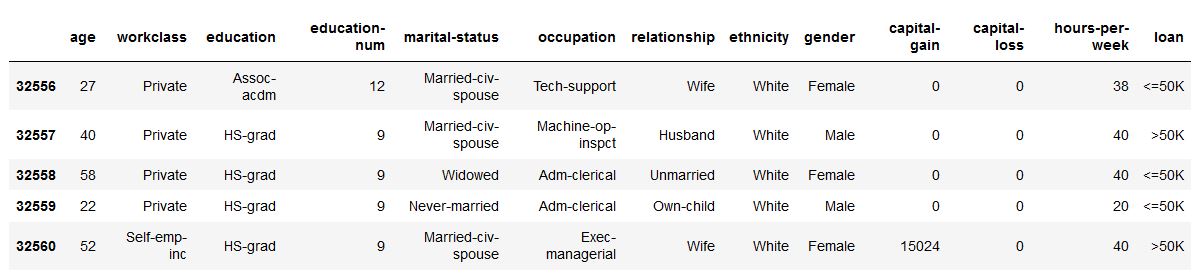
ims = xai . imbalance_plot ( df , "gender" )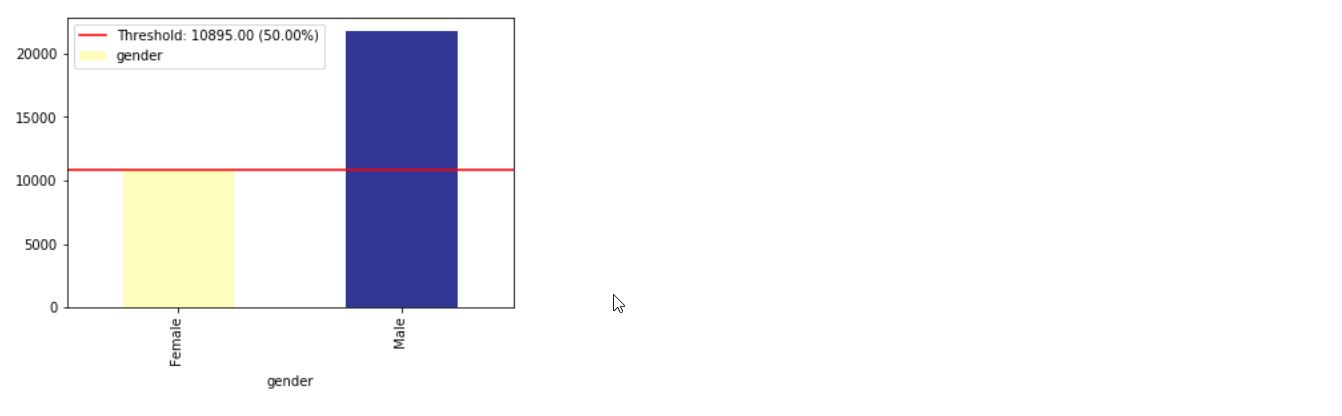
im = xai . imbalance_plot ( df , "gender" , "loan" )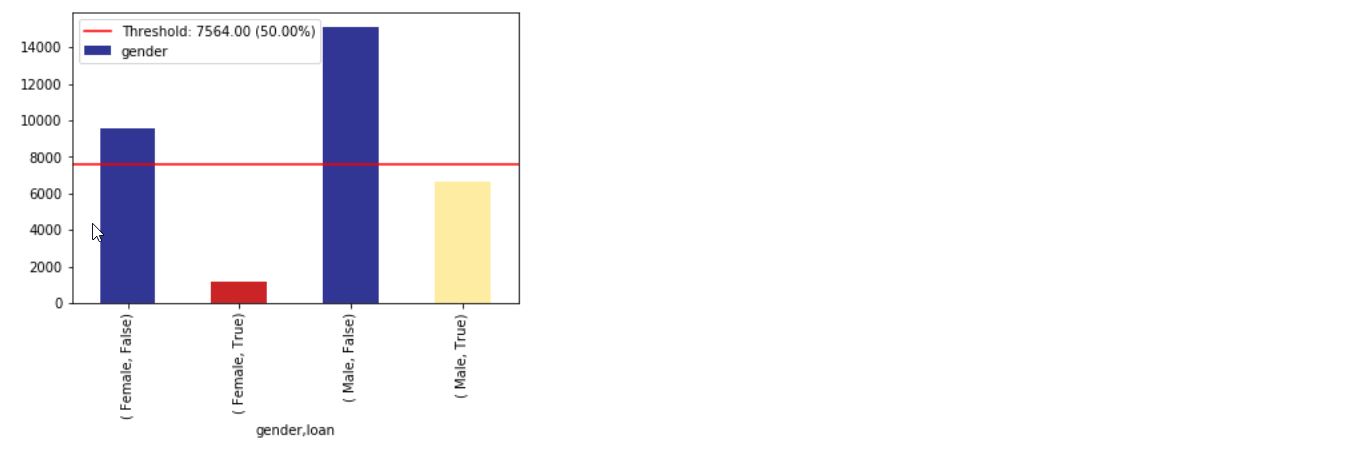
bal_df = xai . balance ( df , "gender" , "loan" , upsample = 0.8 )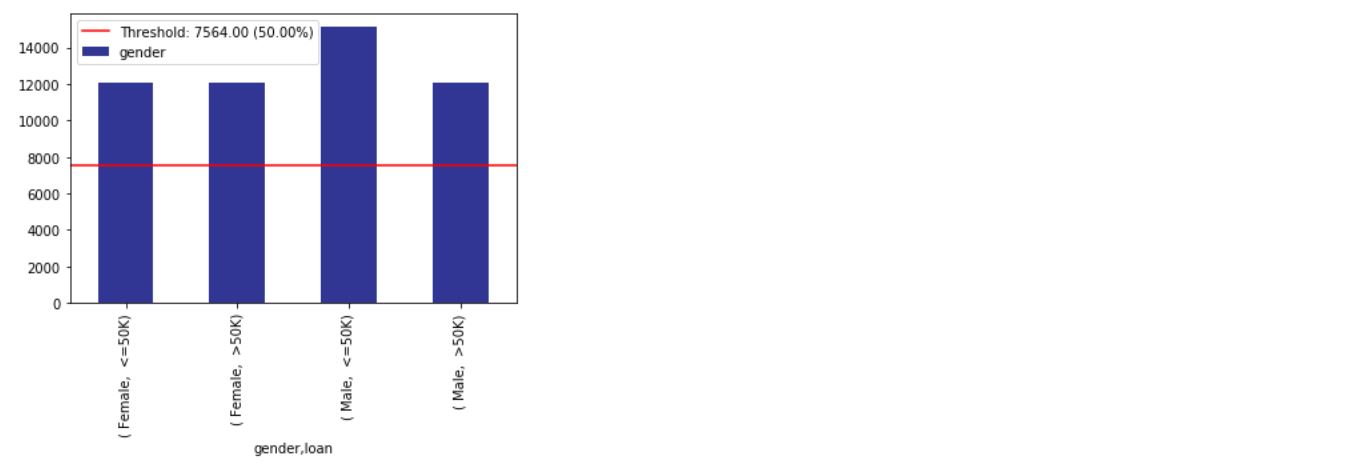
 groups = xai . group_by_columns ( df , [ "gender" , "loan" ])
for group , group_df in groups :
    print ( group )
    print ( group_df [ "loan" ]. head (), " n " )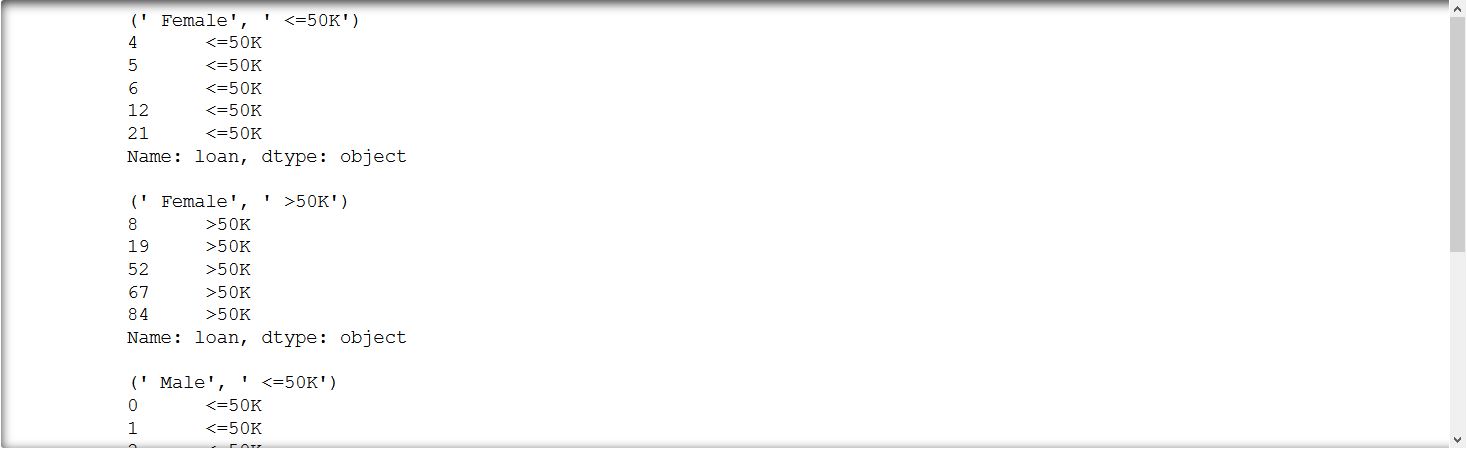
_ = xai . correlations ( df , include_categorical = True , plot_type = "matrix" )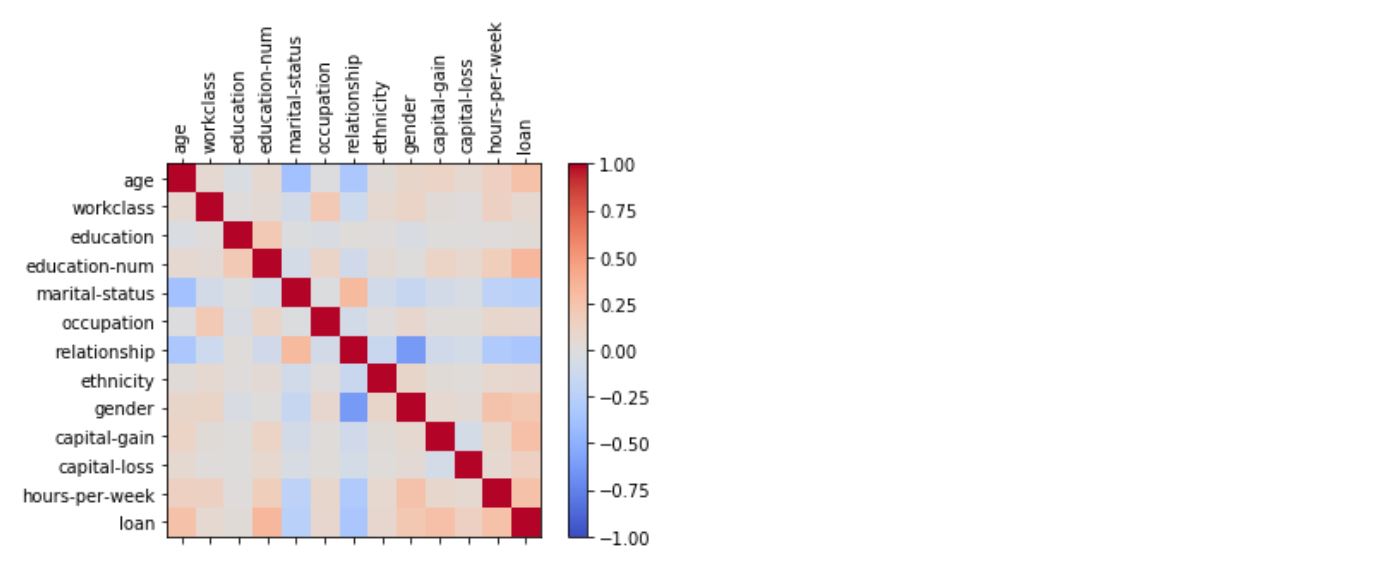
_ = xai . correlations ( df , include_categorical = True )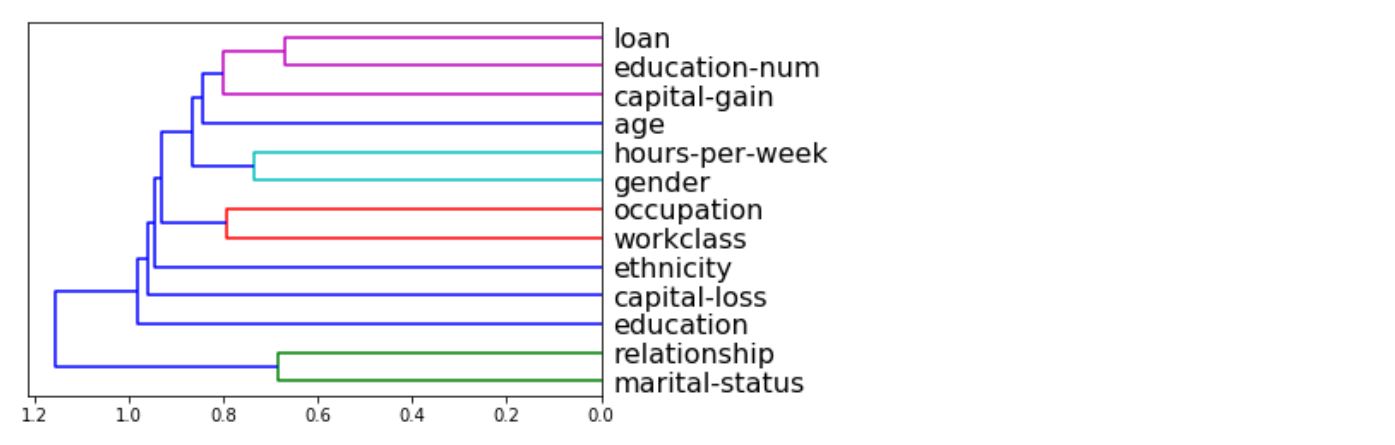
 # Balanced train-test split with minimum 300 examples of
#     the cross of the target y and the column gender
x_train , y_train , x_test , y_test , train_idx , test_idx =
    xai . balanced_train_test_split (
            x , y , "gender" ,
            min_per_group = 300 ,
            max_per_group = 300 ,
            categorical_cols = categorical_cols )

x_train_display = bal_df [ train_idx ]
x_test_display = bal_df [ test_idx ]

print ( "Total number of examples: " , x_test . shape [ 0 ])

df_test = x_test_display . copy ()
df_test [ "loan" ] = y_test

_ = xai . imbalance_plot ( df_test , "gender" , "loan" , categorical_cols = categorical_cols )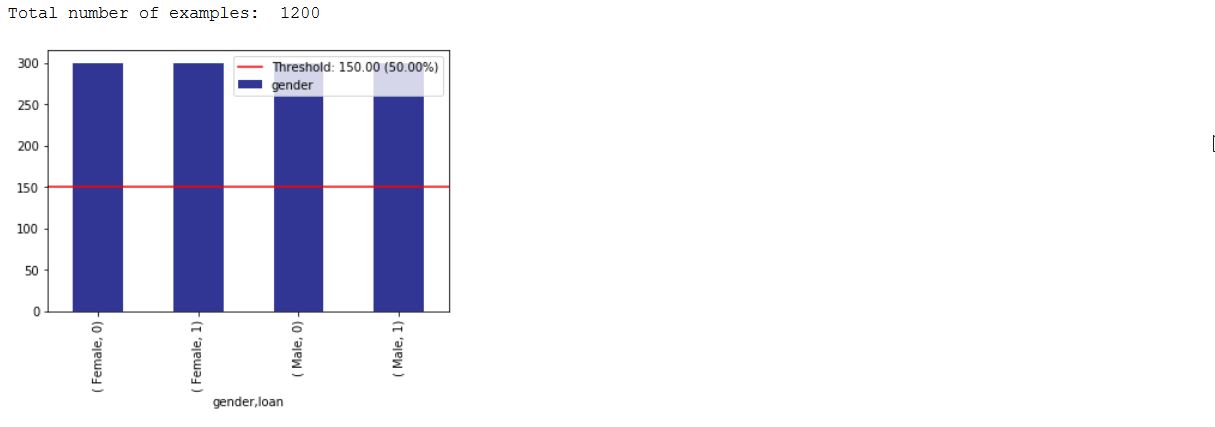
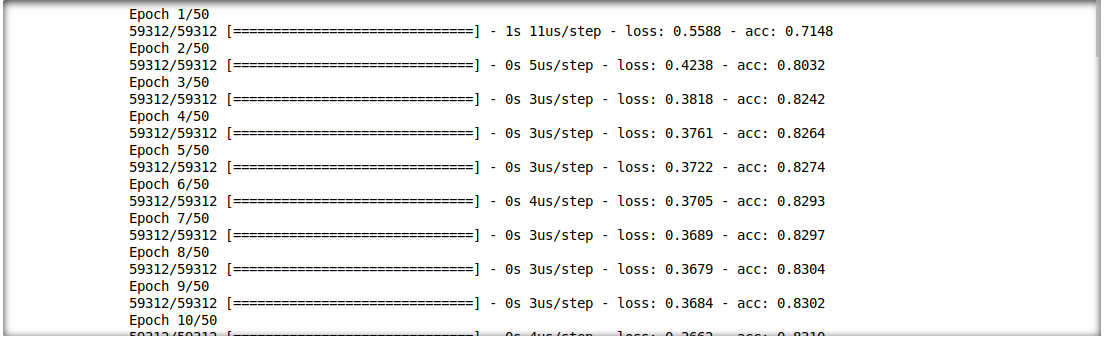
또한 추론 결과와 입력 기능 간의 상호 작용을 분석 할 수 있습니다. 이를 위해 단일 레이어 딥 러닝 모델을 훈련시킵니다.
 model = build_model(proc_df.drop("loan", axis=1))

model.fit(f_in(x_train), y_train, epochs=50, batch_size=512)

probabilities = model.predict(f_in(x_test))
predictions = list((probabilities >= 0.5).astype(int).T[0])
 def get_avg ( x , y ):
    return model . evaluate ( f_in ( x ), y , verbose = 0 )[ 1 ]

imp = xai . feature_importance ( x_test , y_test , get_avg )

imp . head ()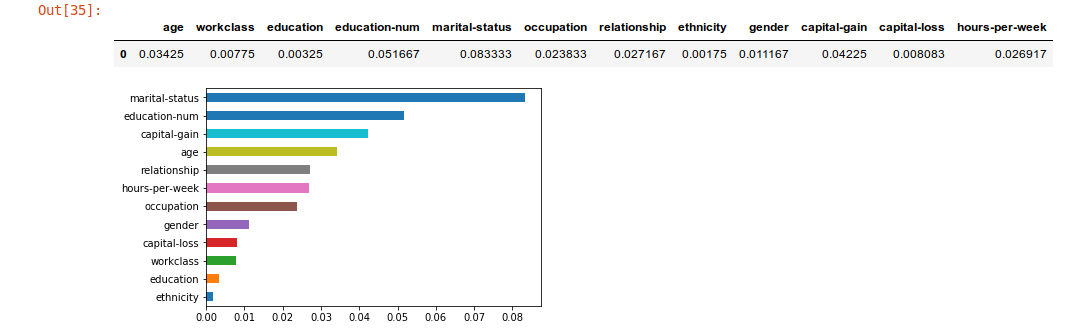
 _ = xai . metrics_plot (
        y_test ,
        probabilities )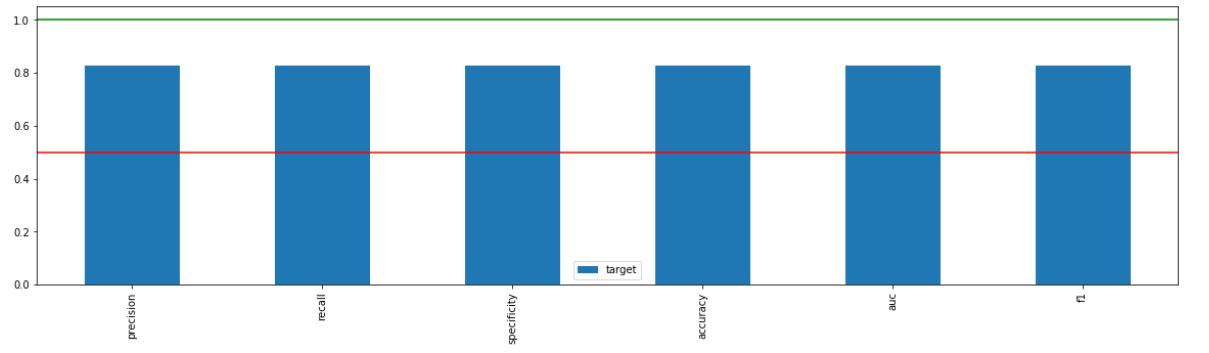
 _ = xai . metrics_plot (
    y_test ,
    probabilities ,
    df = x_test_display ,
    cross_cols = [ "gender" ],
    categorical_cols = categorical_cols )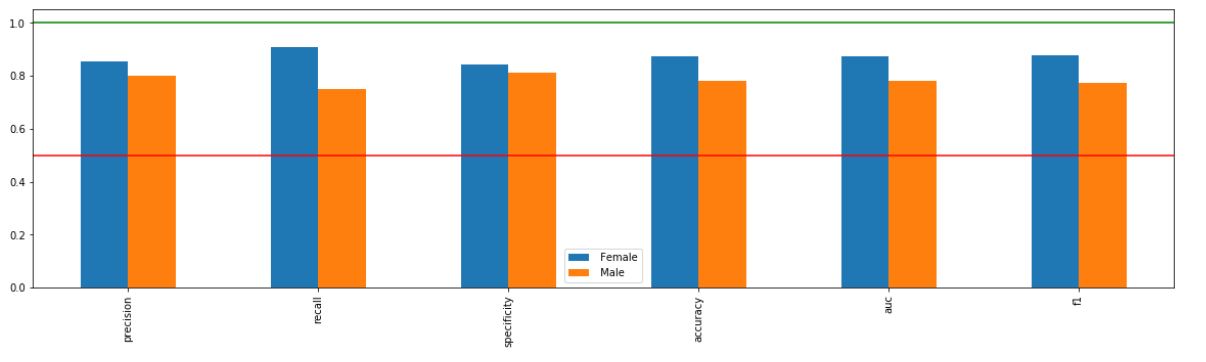
 _ = xai . metrics_plot (
    y_test ,
    probabilities ,
    df = x_test_display ,
    cross_cols = [ "gender" , "ethnicity" ],
    categorical_cols = categorical_cols )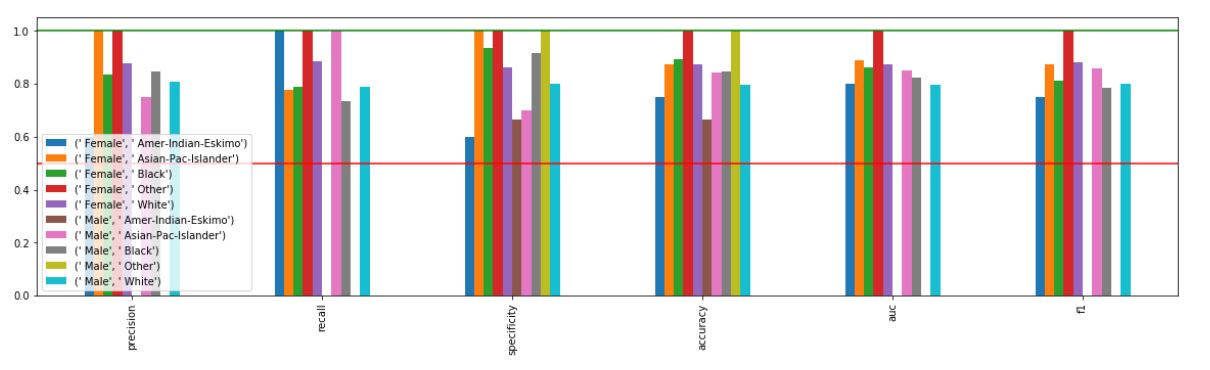
xai . confusion_matrix_plot ( y_test , pred )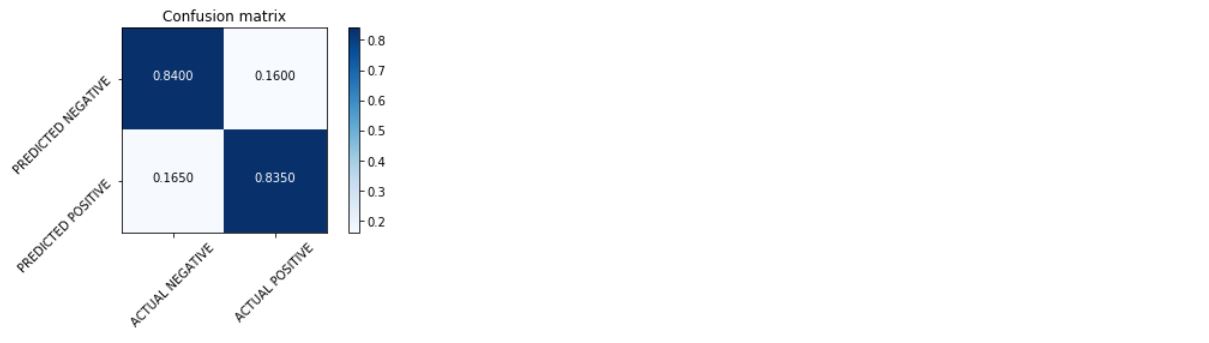
_ = xai . roc_plot ( y_test , probabilities )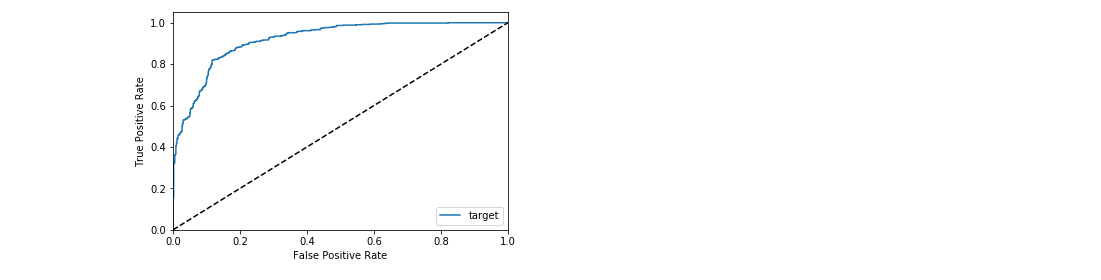
 protected = [ "gender" , "ethnicity" , "age" ]
_ = [ xai . roc_plot (
    y_test ,
    probabilities ,
    df = x_test_display ,
    cross_cols = [ p ],
    categorical_cols = categorical_cols ) for p in protected ]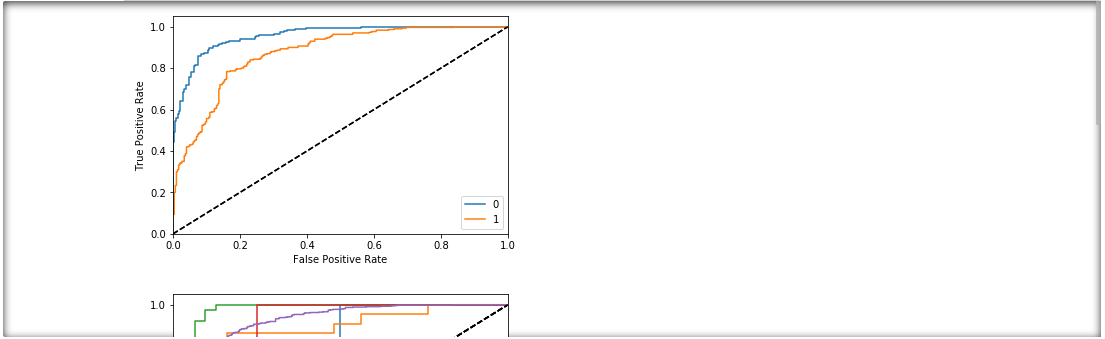
 d = xai . smile_imbalance (
    y_test ,
    probabilities )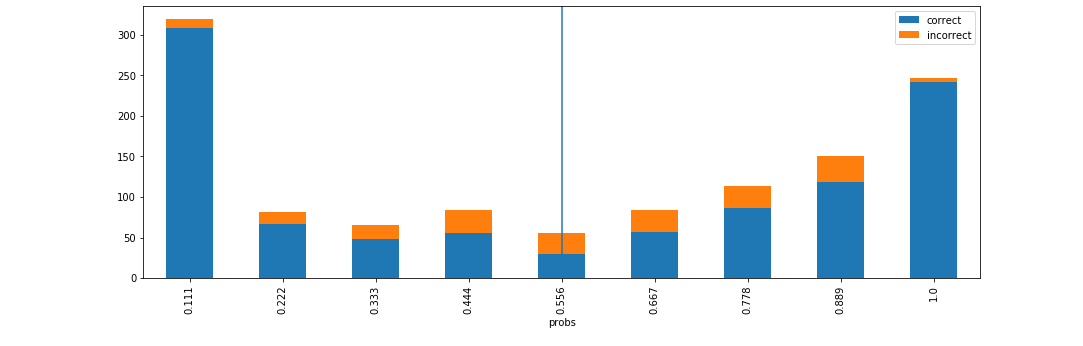
 d = xai . smile_imbalance (
    y_test ,
    probabilities ,
    display_breakdown = True )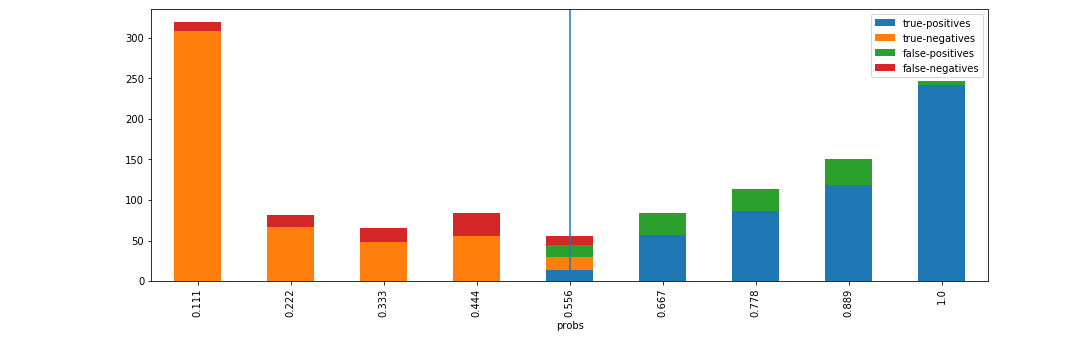
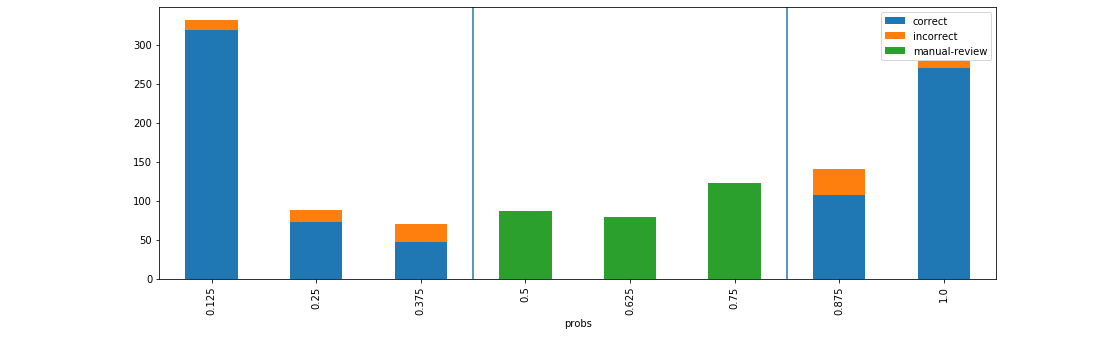
 d = xai . smile_imbalance (
    y_test ,
    probabilities ,
    bins = 9 ,
    threshold = 0.75 ,
    manual_review = 0.375 ,
    display_breakdown = False )