xai
v0.1.0
XAI เป็นห้องสมุดการเรียนรู้ของเครื่องที่ออกแบบมาพร้อมกับความสามารถในการอธิบาย AI ในแกนกลาง XAI มีเครื่องมือต่าง ๆ ที่เปิดใช้งานสำหรับการวิเคราะห์และการประเมินข้อมูลและแบบจำลอง ห้องสมุด XAI ได้รับการดูแลโดยสถาบันเพื่อจริยธรรม AI & ML และได้รับการพัฒนาตามหลักการ 8 หลักการสำหรับการเรียนรู้ของเครื่องที่รับผิดชอบ
คุณสามารถค้นหาเอกสารได้ที่ https://ethicalml.github.io/xai/index.html นอกจากนี้คุณยังสามารถตรวจสอบการพูดคุยของเราที่ Tensorflow London ซึ่งความคิดนั้นถูกตั้งครรภ์ครั้งแรก - การพูดคุยยังมีข้อมูลเชิงลึกเกี่ยวกับคำจำกัดความและหลักการในห้องสมุดนี้
| วิดีโอของการพูดคุยที่นำเสนอในการประชุม Pydata London 2019 ซึ่งให้ภาพรวมเกี่ยวกับแรงจูงใจสำหรับการอธิบายการเรียนรู้ของเครื่องรวมถึงเทคนิคในการแนะนำการอธิบายและลดอคติที่ไม่พึงประสงค์โดยใช้ห้องสมุด XAI | 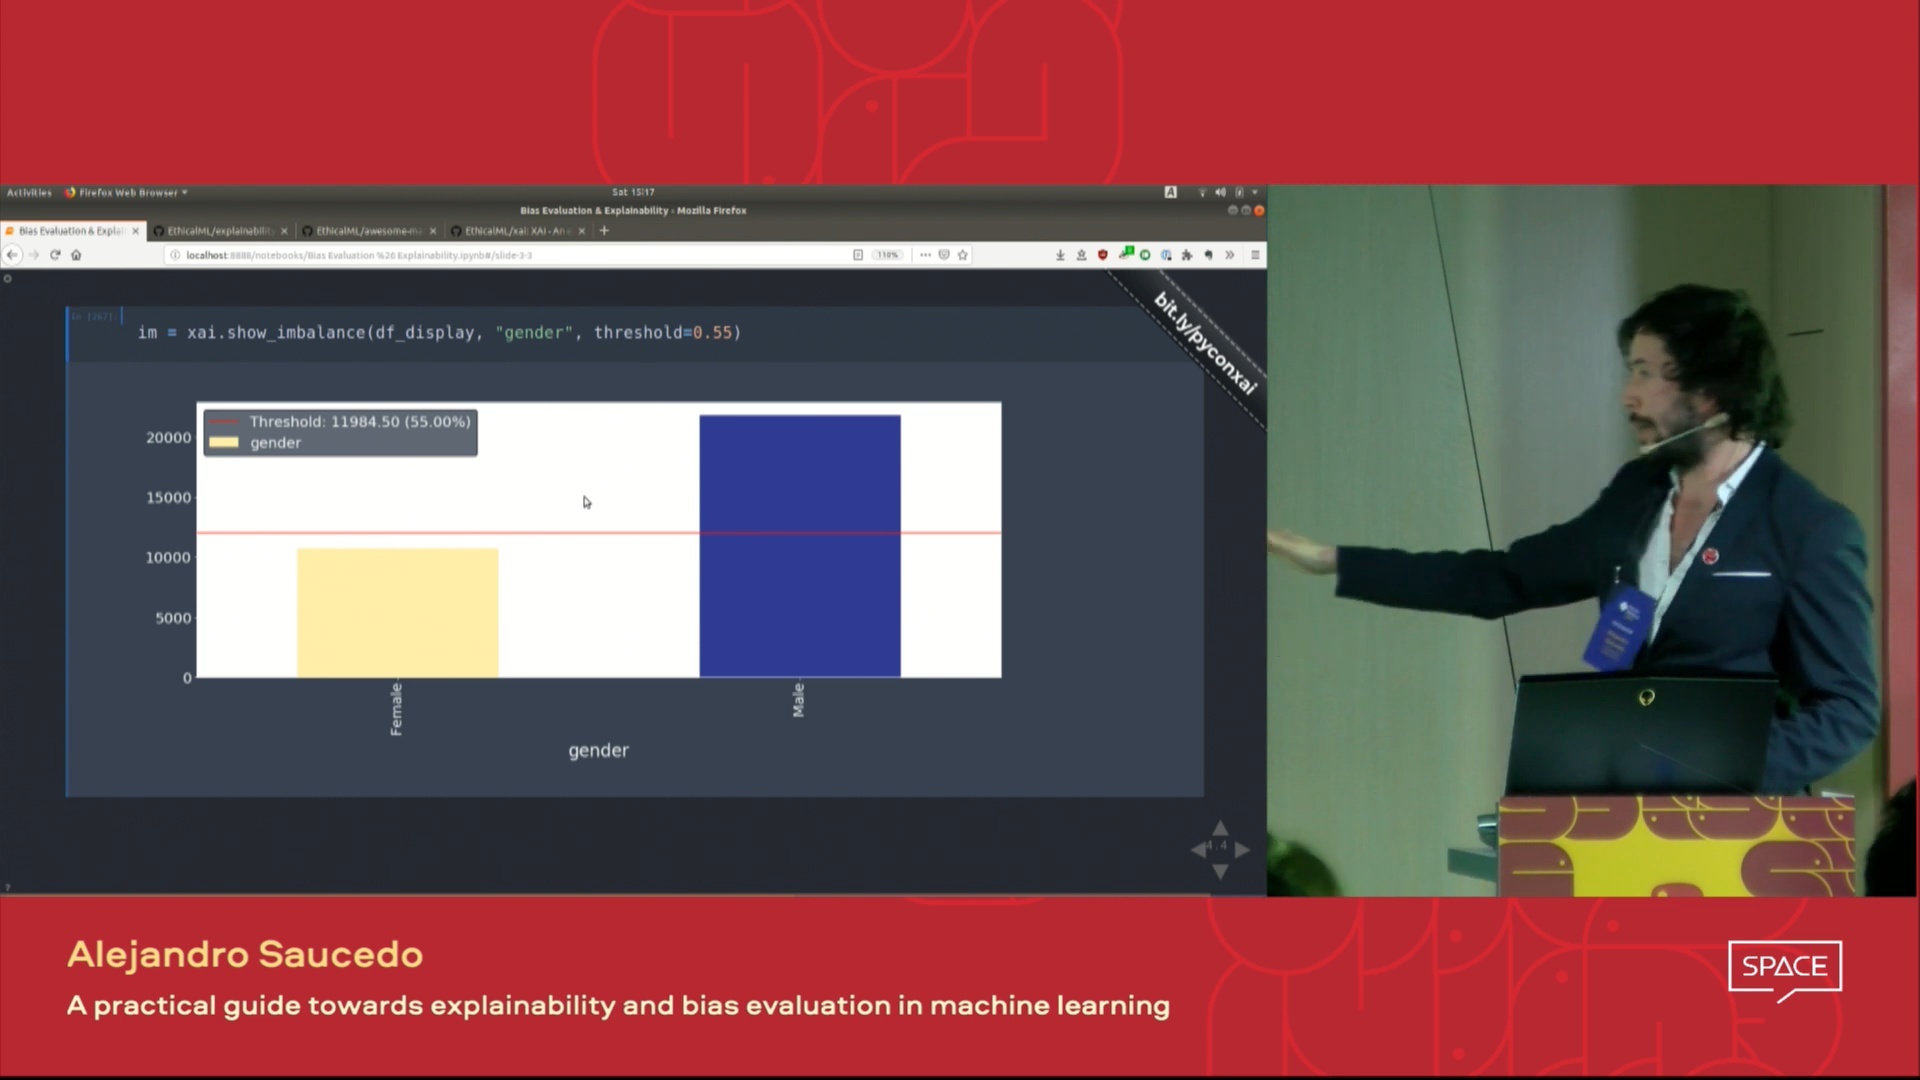 |
| คุณต้องการเรียนรู้เกี่ยวกับเครื่องมืออธิบายการเรียนรู้ของเครื่องที่ยอดเยี่ยมมากขึ้นหรือไม่? ตรวจสอบรายการ "การเรียนรู้การเรียนรู้ของเครื่องจักรที่ยอดเยี่ยมในชุมชนของเราซึ่งมีรายการเครื่องมือมากมายสำหรับความสามารถในการอธิบายความเป็นส่วนตัวการประสานและอื่น ๆ | 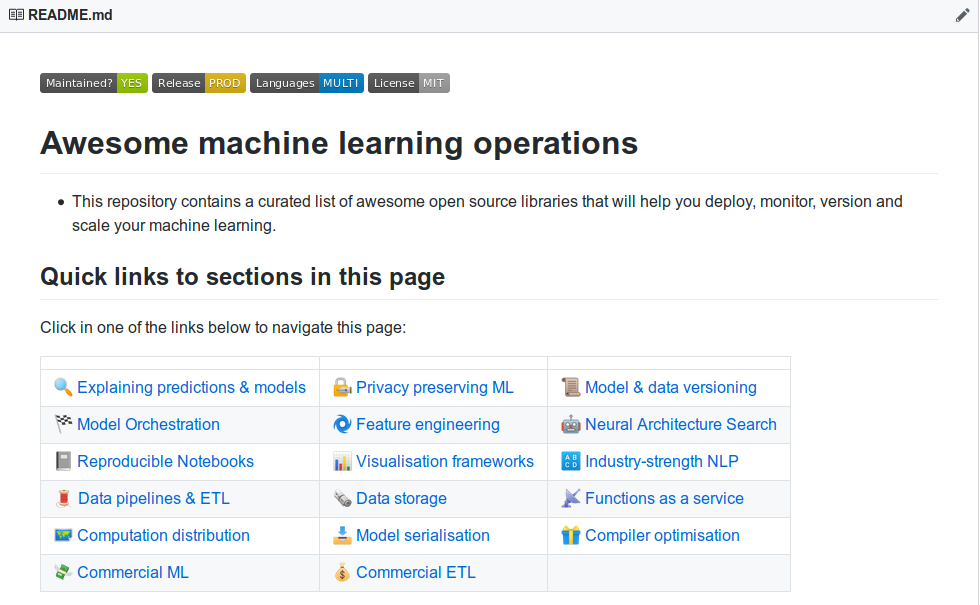 |
หากคุณต้องการดูการสาธิตการทำงานอย่างสมบูรณ์ในการดำเนินการโคลนนี้ repo นี้และเรียกใช้ตัวอย่าง Jupyter Notebook ในโฟลเดอร์ตัวอย่าง
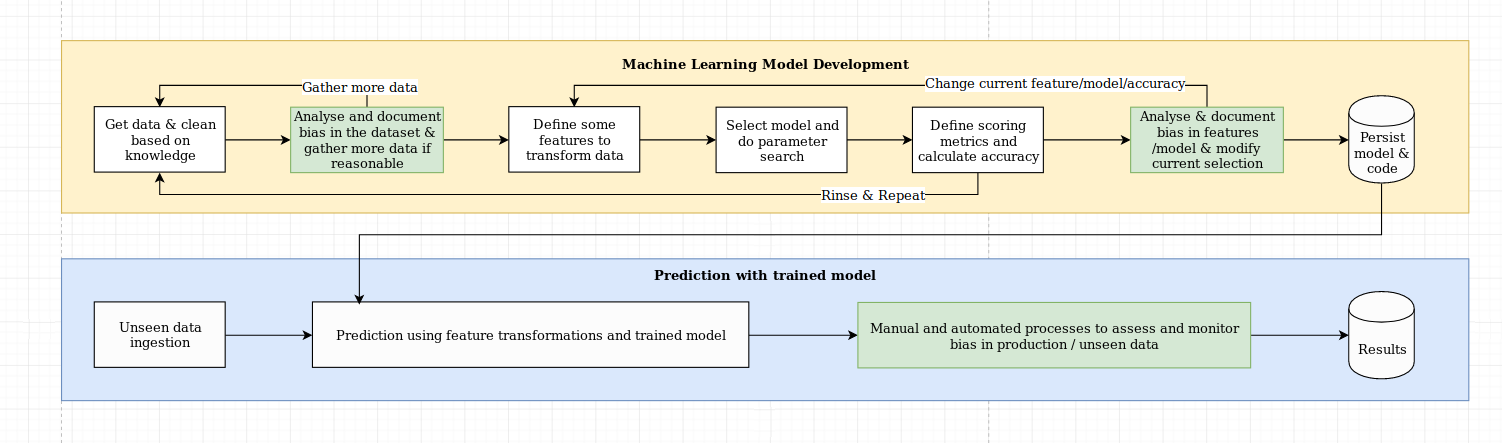
เราเห็นความท้าทายในการอธิบายเป็นมากกว่าแค่ความท้าทายอัลกอริทึมซึ่งต้องใช้การผสมผสานของแนวทางปฏิบัติที่ดีที่สุดของวิทยาศาสตร์ข้อมูลกับความรู้เฉพาะโดเมน ไลบรารี XAI ได้รับการออกแบบมาเพื่อเพิ่มขีดความสามารถของวิศวกรการเรียนรู้ของเครื่องและผู้เชี่ยวชาญด้านโดเมนที่เกี่ยวข้องในการวิเคราะห์โซลูชันแบบ end-to-end และระบุความคลาดเคลื่อนที่อาจส่งผลให้ประสิทธิภาพต่ำที่สุดเมื่อเทียบกับวัตถุประสงค์ที่จำเป็น ในวงกว้างมากขึ้นไลบรารี XAI ได้รับการออกแบบโดยใช้การเรียนรู้ของเครื่อง 3 ขั้นตอนซึ่งเกี่ยวข้องกับการวิเคราะห์ข้อมูล 1) การประเมินแบบจำลอง 2) และ 3) การตรวจสอบการผลิต
เราให้ภาพรวมภาพของสามขั้นตอนที่กล่าวถึงข้างต้นในแผนภาพนี้:
แพ็คเกจ XAI อยู่ใน PYPI ในการติดตั้งคุณสามารถเรียกใช้:
pip install xai
หรือคุณสามารถติดตั้งจากแหล่งที่มาโดยการโคลน repo และทำงาน:
python setup.py install
คุณสามารถค้นหาการใช้ตัวอย่างในโฟลเดอร์ตัวอย่าง
ด้วย XAI คุณสามารถระบุความไม่สมดุลในข้อมูล สำหรับสิ่งนี้เราจะโหลดชุดข้อมูลการสำรวจสำมะโนประชากรจากไลบรารี XAI
 import xai . data
df = xai . data . load_census ()
df . head ()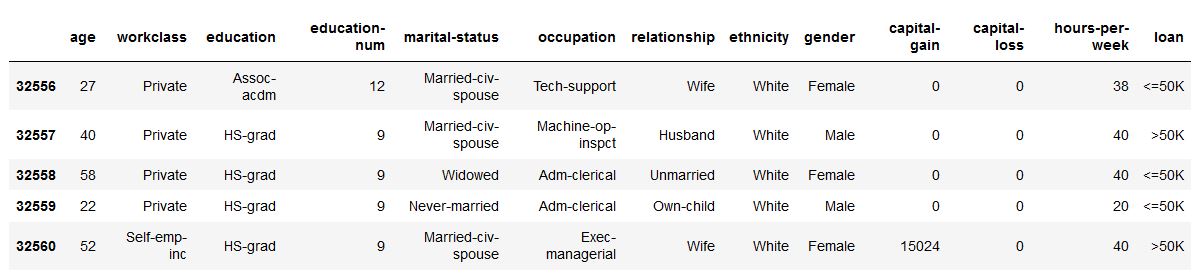
ims = xai . imbalance_plot ( df , "gender" )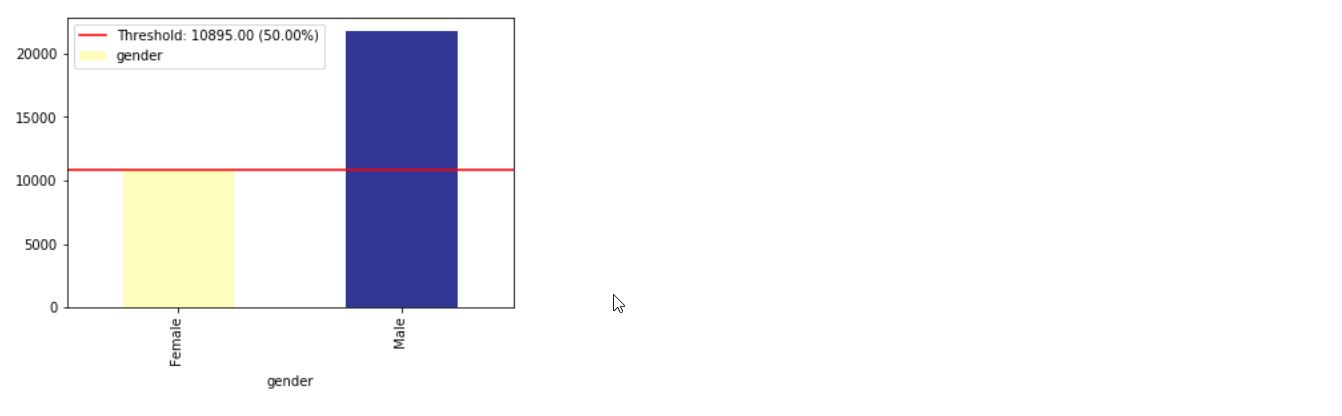
im = xai . imbalance_plot ( df , "gender" , "loan" )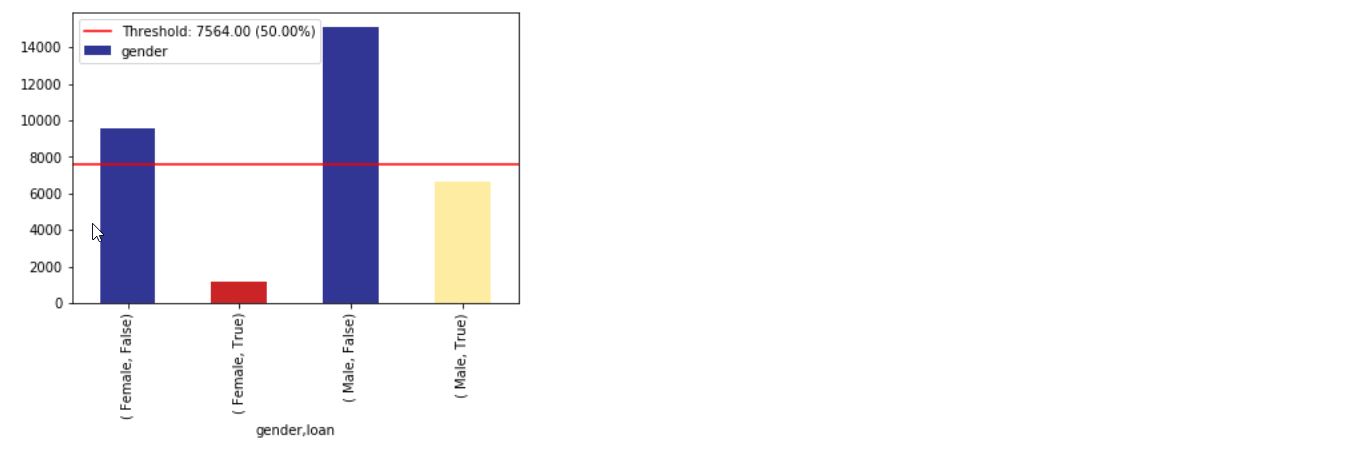
bal_df = xai . balance ( df , "gender" , "loan" , upsample = 0.8 )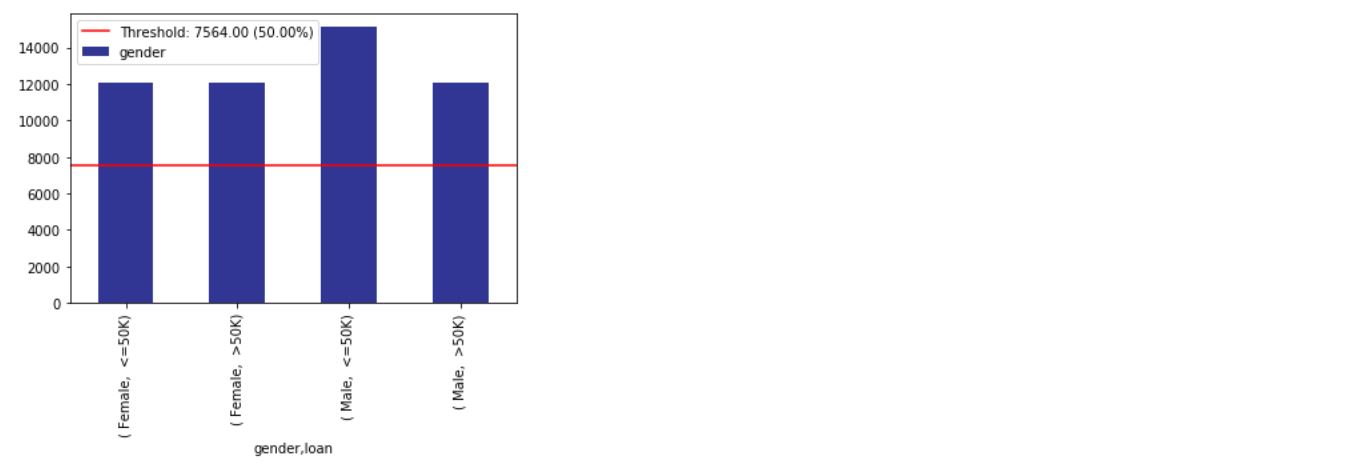
 groups = xai . group_by_columns ( df , [ "gender" , "loan" ])
for group , group_df in groups :
    print ( group )
    print ( group_df [ "loan" ]. head (), " n " )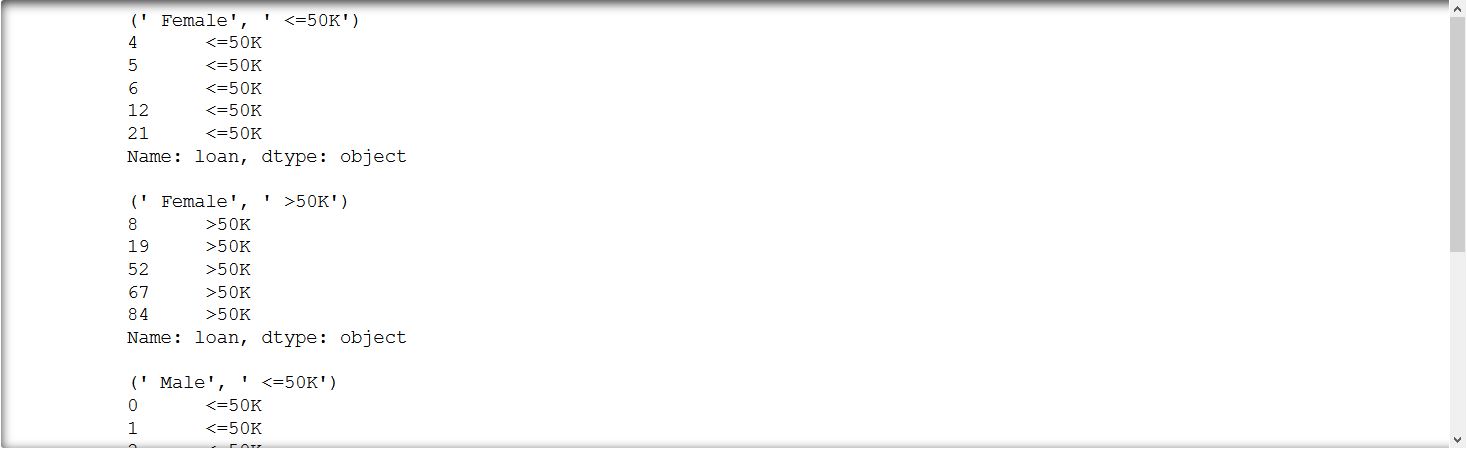
_ = xai . correlations ( df , include_categorical = True , plot_type = "matrix" )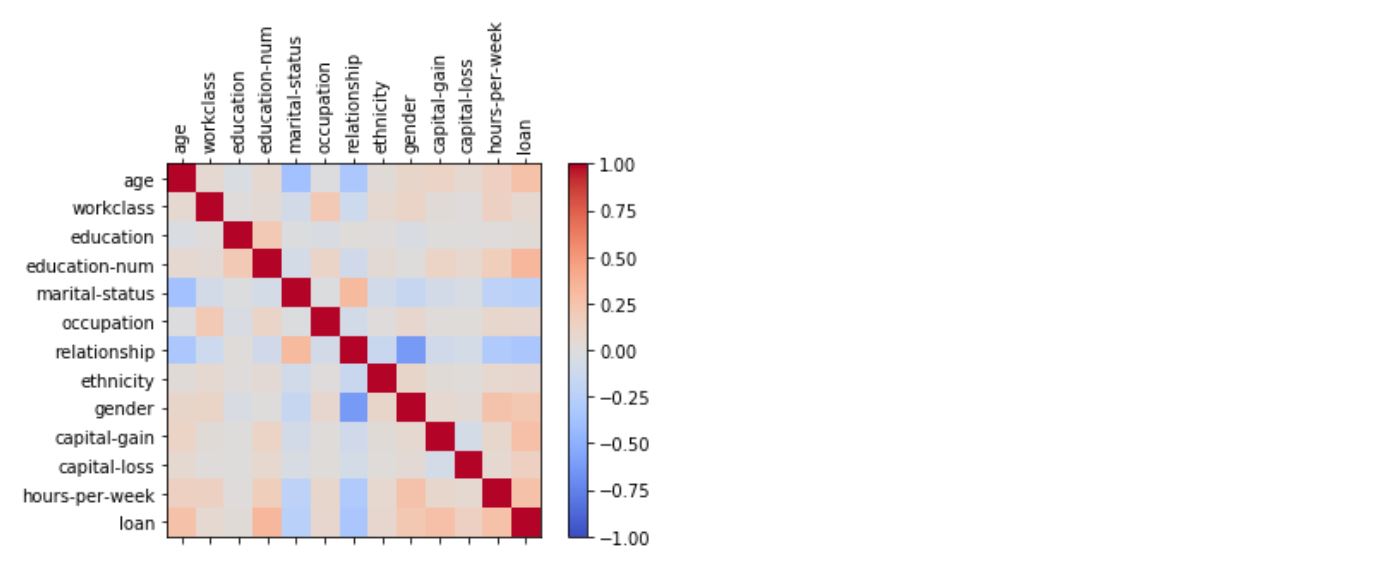
_ = xai . correlations ( df , include_categorical = True )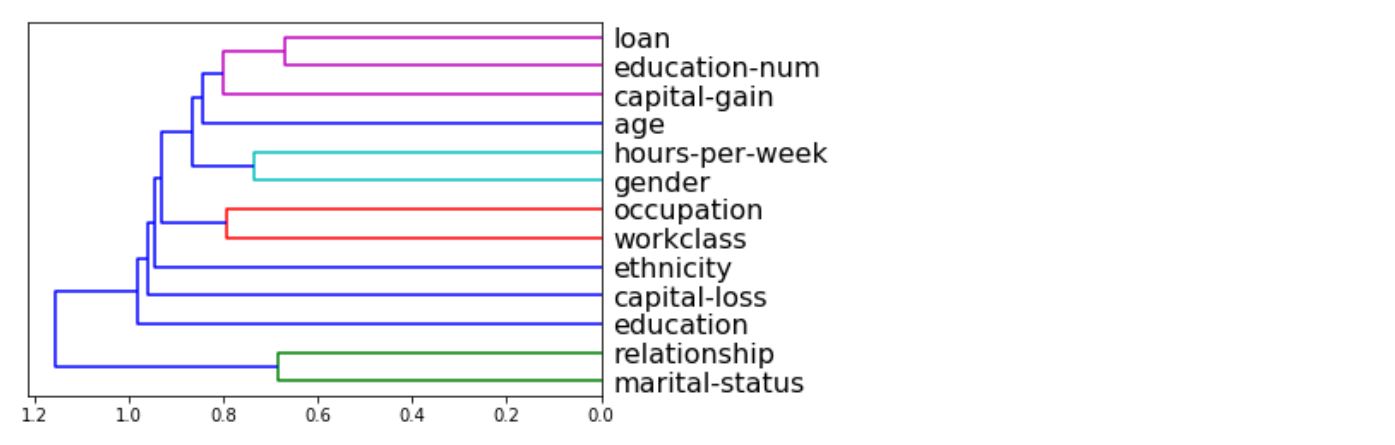
 # Balanced train-test split with minimum 300 examples of
#     the cross of the target y and the column gender
x_train , y_train , x_test , y_test , train_idx , test_idx =
    xai . balanced_train_test_split (
            x , y , "gender" ,
            min_per_group = 300 ,
            max_per_group = 300 ,
            categorical_cols = categorical_cols )

x_train_display = bal_df [ train_idx ]
x_test_display = bal_df [ test_idx ]

print ( "Total number of examples: " , x_test . shape [ 0 ])

df_test = x_test_display . copy ()
df_test [ "loan" ] = y_test

_ = xai . imbalance_plot ( df_test , "gender" , "loan" , categorical_cols = categorical_cols )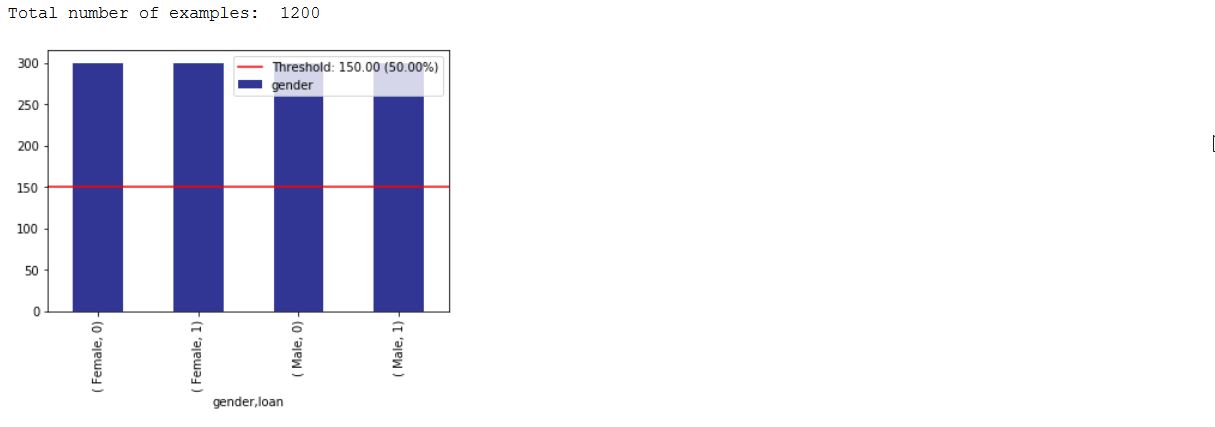
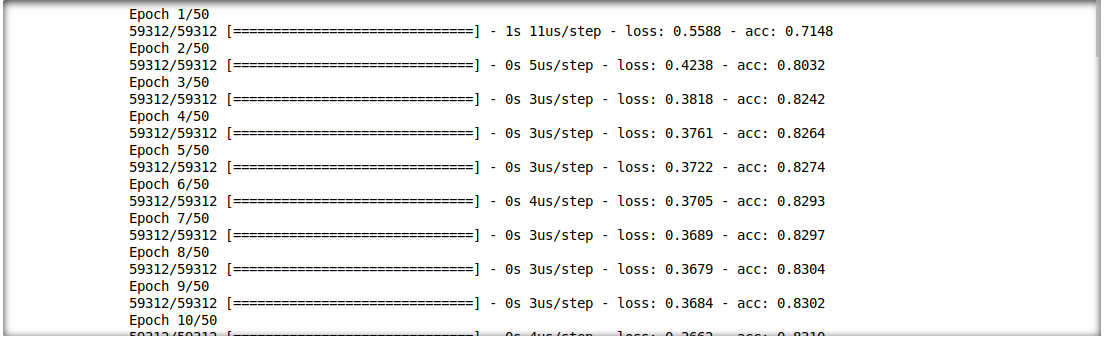
เราสามารถวิเคราะห์ปฏิสัมพันธ์ระหว่างผลลัพธ์การอนุมานและคุณสมบัติการป้อนข้อมูล สำหรับสิ่งนี้เราจะฝึกอบรมรูปแบบการเรียนรู้ลึกชั้นเดียว
 model = build_model(proc_df.drop("loan", axis=1))

model.fit(f_in(x_train), y_train, epochs=50, batch_size=512)

probabilities = model.predict(f_in(x_test))
predictions = list((probabilities >= 0.5).astype(int).T[0])
 def get_avg ( x , y ):
    return model . evaluate ( f_in ( x ), y , verbose = 0 )[ 1 ]

imp = xai . feature_importance ( x_test , y_test , get_avg )

imp . head ()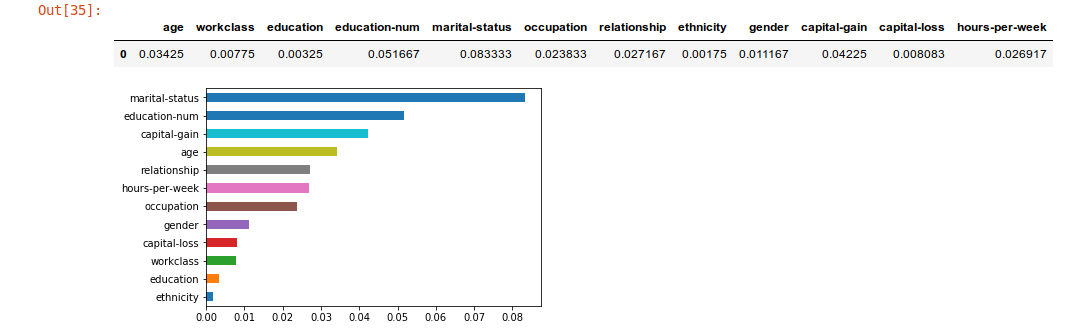
 _ = xai . metrics_plot (
        y_test ,
        probabilities )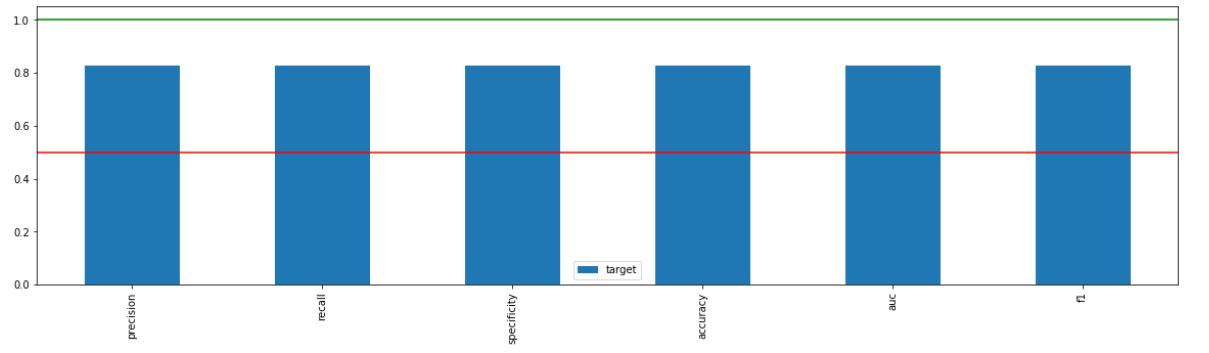
 _ = xai . metrics_plot (
    y_test ,
    probabilities ,
    df = x_test_display ,
    cross_cols = [ "gender" ],
    categorical_cols = categorical_cols )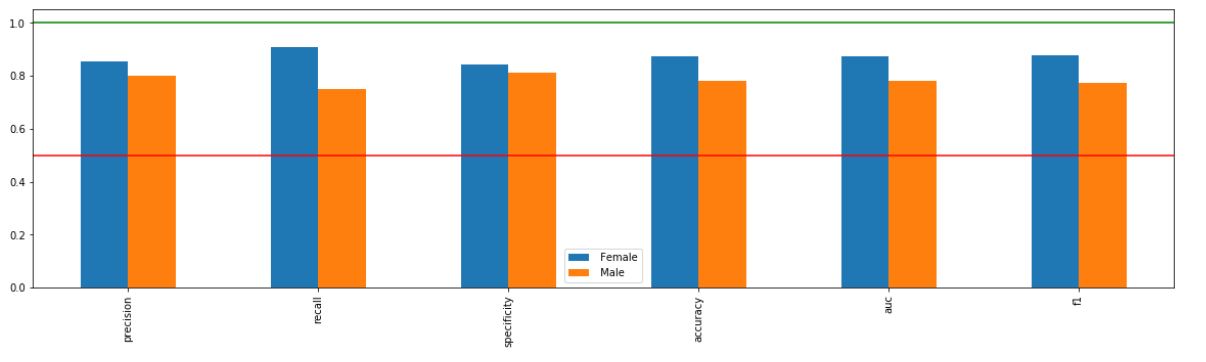
 _ = xai . metrics_plot (
    y_test ,
    probabilities ,
    df = x_test_display ,
    cross_cols = [ "gender" , "ethnicity" ],
    categorical_cols = categorical_cols )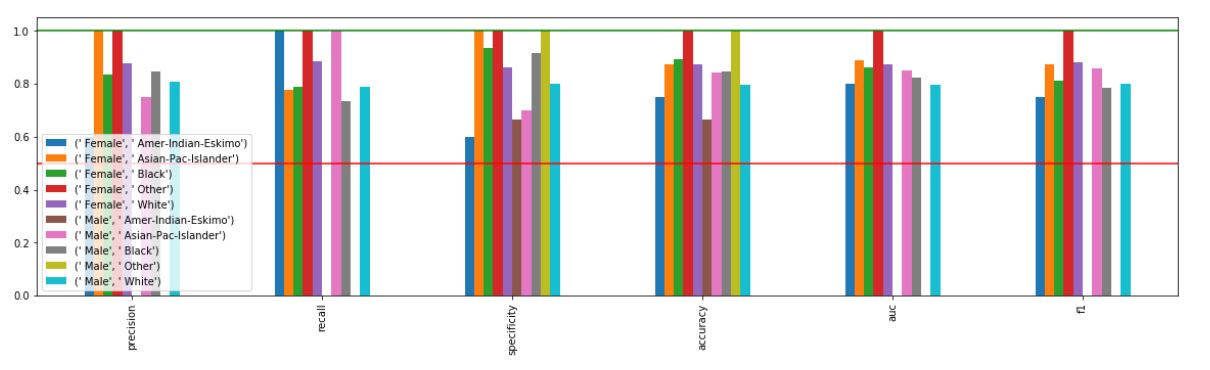
xai . confusion_matrix_plot ( y_test , pred )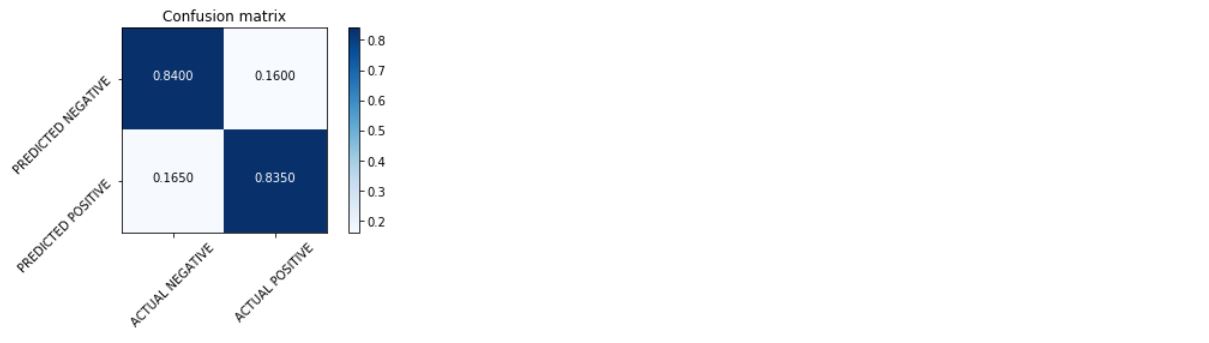
_ = xai . roc_plot ( y_test , probabilities )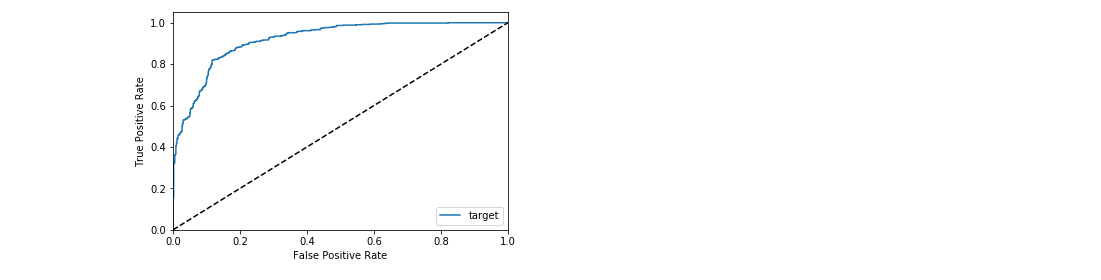
 protected = [ "gender" , "ethnicity" , "age" ]
_ = [ xai . roc_plot (
    y_test ,
    probabilities ,
    df = x_test_display ,
    cross_cols = [ p ],
    categorical_cols = categorical_cols ) for p in protected ]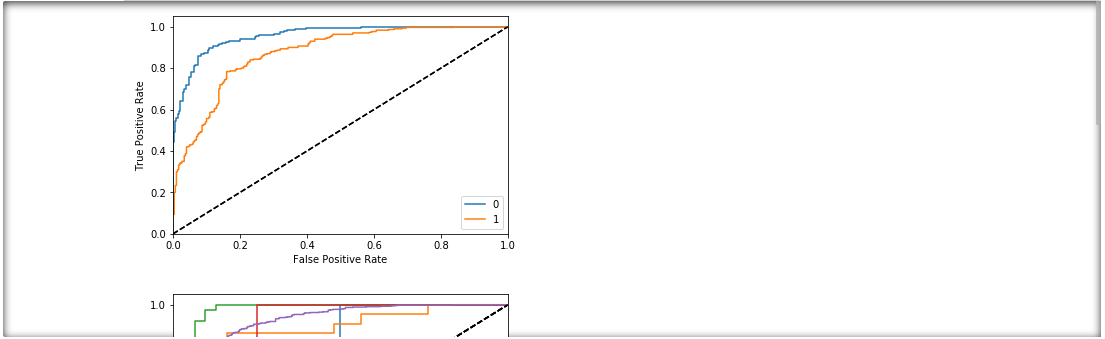
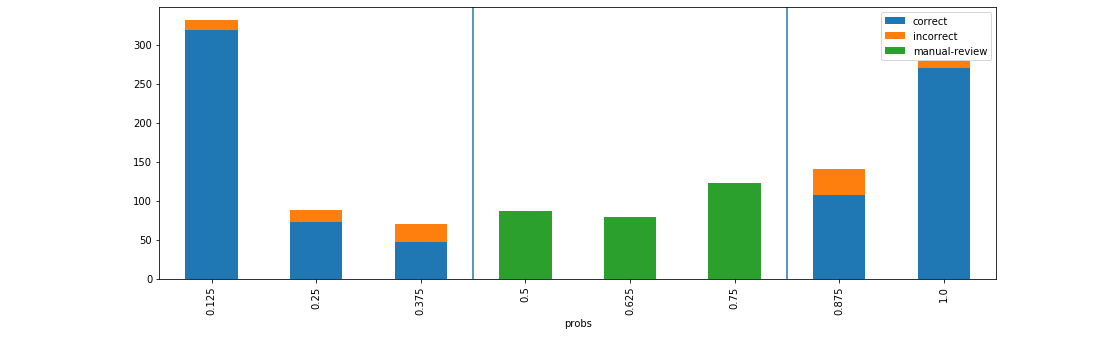
 d = xai . smile_imbalance (
    y_test ,
    probabilities )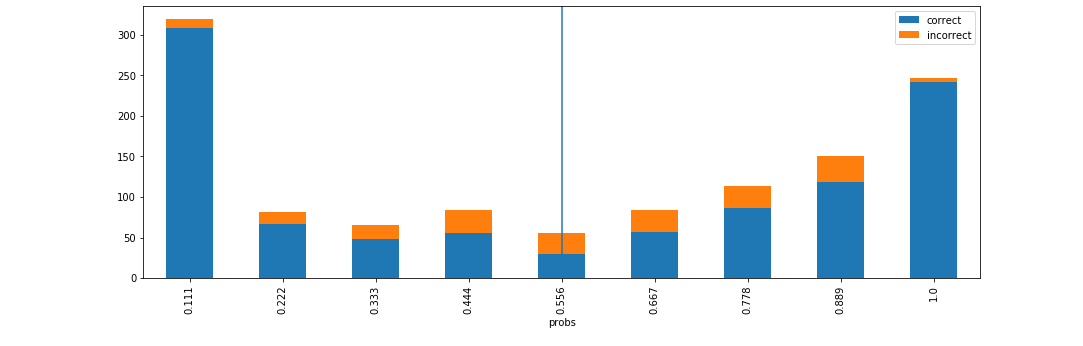
 d = xai . smile_imbalance (
    y_test ,
    probabilities ,
    display_breakdown = True )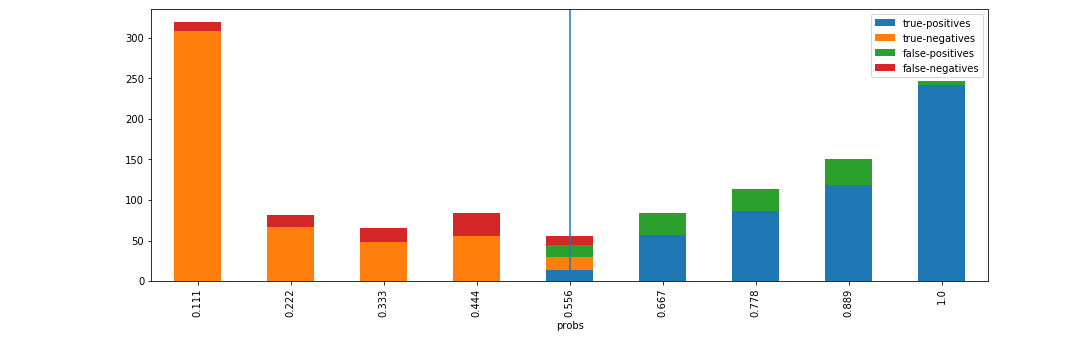
 d = xai . smile_imbalance (
    y_test ,
    probabilities ,
    bins = 9 ,
    threshold = 0.75 ,
    manual_review = 0.375 ,
    display_breakdown = False )