clinker
v0.0.30
Cagecat Webserver에 설치하지 않고 Cblaster와 Clinker를 모두 사용할 수 있습니다.
유전자 클러스터 비교 그림 생성기
Clinker는 간행물 품질 유전자 클러스터 비교 수치를 쉽게 생성하기위한 파이프 라인입니다.
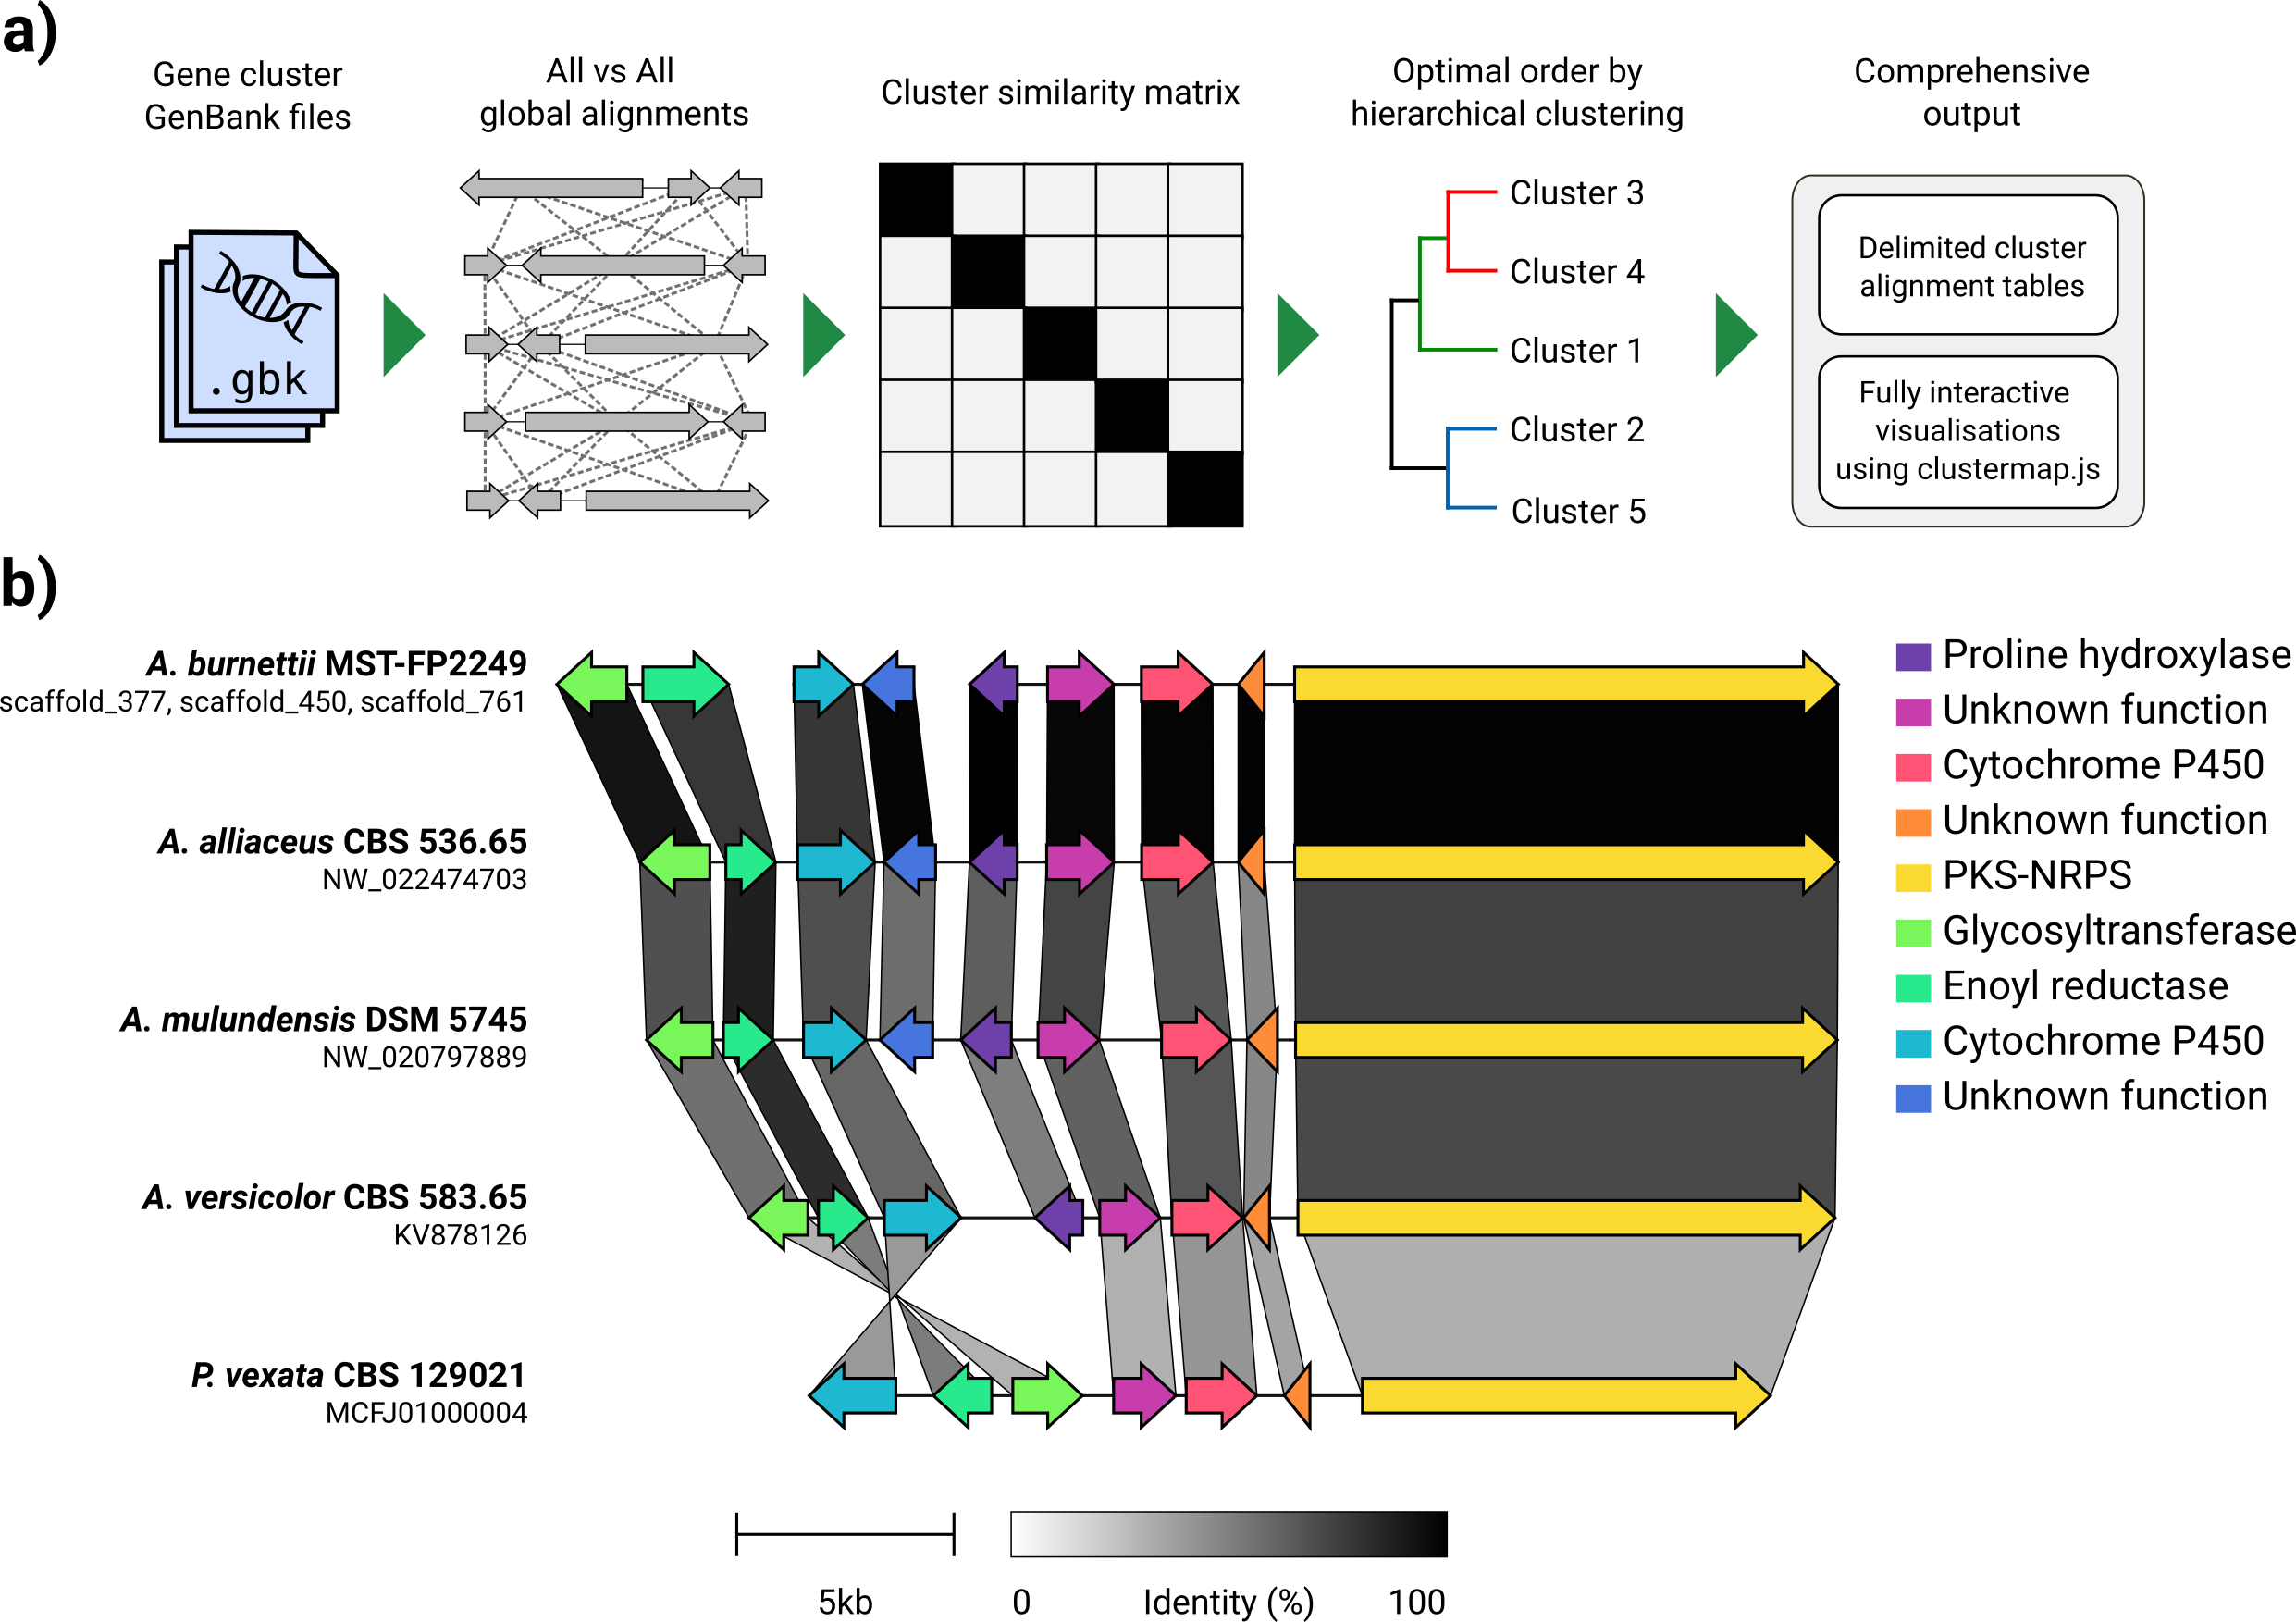
GenBank 파일 세트가 주어지면 Clinker는 단백질 번역을 자동으로 추출하고, 각 클러스터의 시퀀스간에 전역 정렬을 수행하고, 클러스터 유사성을 기반으로 최적의 디스플레이 순서를 결정하며, 이전에 광범위하게 조정할 수있는 대화식 시각화 (ClusterMap.js를 사용하여)를 생성합니다. SVG 파일로 내보내기.
Clinker는 주로 상 동성 생합성 유전자 클러스터 그룹을 시각화하는 간단한 방법으로 설계되었으며, 이는 일반적으로 유전자가 많지 않은 작은 게놈 영역 (예 : GIF에서와 같이). Biopython에 내장 된 정렬기를 사용하여 모든 입력 파일에서 모든 유전자의 쌍별 정렬을 수행 한 다음 브라우저에서 대화식 SVG 문서를 생성합니다. 정렬 단계는 많은 유전자가있는 다수의 게놈으로 매우 열악 할 것이며, 그 결과 시각화는 또한 얼마나 많은 SVG 요소가 포함 할 것인지가 매우 느립니다. 전체 게놈을 정렬하려면 해당 목적 (예 : 선인장)을 위해 구축 된 도구를 사용하여 더 잘 제공 될 것입니다.
Clinker는 PIP를 통해 직접 설치할 수 있습니다.
pip install clinker
Github에서 소스 코드를 복제하여 :
 git clone https://github.com/gamcil/clinker.git
cd clinker
pip install .
또는 콘다를 통해 :
 conda create -n clinker -c conda-forge -c bioconda clinker-py
conda activate clinker
Clinker가 유용하다고 생각되면 다음을 인용하십시오.
 clinker & clustermap.js: Automatic generation of gene cluster comparison figures.
Gilchrist, C.L.M., Chooi, Y.-H., 2020.
Bioinformatics. doi: https://doi.org/10.1093/bioinformatics/btab007
Clinker를 실행하는 것만 큼 간단 할 수 있습니다.
clinker clusters/*.gbk
폴더 내부의 모든 GenBank 파일에서 읽히고 정렬 한 다음 터미널에 정렬을 인쇄합니다. 시각화를 생성하려면 -p/--plot 인수를 사용하십시오.
clinker clusters/*.gbk -p <optional: file name to save static HTML>
Clinker는 GFF3 파일을 구문 분석 할 수도 있습니다.
clinker cluster1.gff3 cluster2.gff3 -p
참고 : 동일한 이름 (확장자 ".fa", ".fsa", ".fna", ".fasta"또는 ".faa")의 해당 FASTA 파일은 GFF3과 동일한 디렉토리, 즉 cluster1.fa 에서 찾아야합니다. cluster1.fa 및 cluster2.fa .
자세한 내용은 -h/--help 참조하십시오.
 usage: clinker [-h] [--version] [-r RANGES [RANGES ...]] [-gf GENE_FUNCTIONS] [-na] [-i IDENTITY] [-j JOBS] [-s SESSION] [-ji JSON_INDENT] [-f] [-o OUTPUT] [-p [PLOT]] [-dl DELIMITER] [-dc DECIMALS] [-hl] [-ha] [-mo MATRIX_OUT] [-ufo] [files ...]

clinker: Automatic creation of publication-ready gene cluster comparison figures.

clinker generates gene cluster comparison figures from GenBank files. It performs pairwise local or global alignments between every sequence in every unique pair of clusters and generates interactive, to-scale comparison figures using the clustermap.js library.

optional arguments:
  -h, --help            show this help message and exit
  --version             show program's version number and exit

Input options:
  files                 Gene cluster GenBank files
  -r RANGES [RANGES ...], --ranges RANGES [RANGES ...]
                        Scaffold extraction ranges. If a range is specified, only features within the range will be extracted from the scaffold. Ranges should be formatted like: scaffold:start-end (e.g. scaffold_1:15000-40000)
  -gf GENE_FUNCTIONS, --gene_functions GENE_FUNCTIONS
                        2-column CSV file containing gene functions, used to build gene groups from same function instead of sequence similarity (e.g. GENE_001,PKS-NRPS).

Alignment options:
  -na, --no_align       Do not align clusters
  -i IDENTITY, --identity IDENTITY
                        Minimum alignment sequence identity [default: 0.3]
  -j JOBS, --jobs JOBS  Number of alignments to run in parallel (0 to use the number of CPUs) [default: 0]

Output options:
  -s SESSION, --session SESSION
                        Path to clinker session
  -ji JSON_INDENT, --json_indent JSON_INDENT
                        Number of spaces to indent JSON [default: none]
  -f, --force           Overwrite previous output file
  -o OUTPUT, --output OUTPUT
                        Save alignments to file
  -p [PLOT], --plot [PLOT]
                        Plot cluster alignments using clustermap.js. If a path is given, clinker will generate a portable HTML file at that path. Otherwise, the plot will be served dynamically using Python's HTTP server.
  -dl DELIMITER, --delimiter DELIMITER
                        Character to delimit output by [default: human readable]
  -dc DECIMALS, --decimals DECIMALS
                        Number of decimal places in output [default: 2]
  -hl, --hide_link_headers
                        Hide alignment column headers
  -ha, --hide_aln_headers
                        Hide alignment cluster name headers
  -mo MATRIX_OUT, --matrix_out MATRIX_OUT
                        Save cluster similarity matrix to file

Visualisation options:
  -ufo, --use_file_order
                        Display clusters in order of input files

Example usage
-------------
Align clusters, plot results and print scores to screen:
  $ clinker files/*.gbk

Only save gene-gene links when identity is over 50%:
  $ clinker files/*.gbk -i 0.5

Save an alignment session for later:
  $ clinker files/*.gbk -s session.json

Save alignments to file, in comma-delimited format, with 4 decimal places:
  $ clinker files/*.gbk -o alignments.csv -dl "," -dc 4

Generate visualisation:
  $ clinker files/*.gbk -p

Save visualisation as a static HTML document:
  $ clinker files/*.gbk -p plot.html

Cameron Gilchrist, 2020
기본적으로 Clinker는 각 상 동성 유전자 그룹에 대한 이름과 색상을 자동으로 할당합니다. 대신 -gf/--gene_functions 인수를 사용하여 이름 (예 : 함수)을 사전 할당 할 수 있습니다.
 GENE_001,Cytochrome P450
GENE_002,Cytochrome P450
GENE_003,Methyltransferase
GENE_004,Methyltransferase
이것은 사이토 크롬 P450 (GENE_001 및 002)과 메틸 트랜스퍼 라제 (GENE_003, GENE_004)라는 두 그룹을 생성합니다. 다른 상동 유전자가 확인되면 이들 그룹에 자동으로 추가됩니다.
Clinker v0.0.28에서, 이제 -gf/--gene_functions 인수에 의해 정의 된 유전자의 색상을 지정할 수 있습니다. 이렇게하려면 그룹 이름과 16 진수 색상 코드가 포함 된 2 열 CSV 파일을 취하는 -cm/--colour_map 인수를 사용하십시오.
 Cytochrome P450,#FF0000
Methyltransferase,#0000FF


