开放能力/性能分析工具(OPPAT)
目录
- 介绍
- 支持数据类型
- 对立可视化
- oppat的数据收集
- PCM数据支持
- 建立Oppat
- 跑步
- 派生事件
- 使用Browswer GUI界面
- 限制
介绍
开放功率/性能分析工具(OPPAT)是跨架构功率和性能分析工具。
- Cross-OS:支持Windows ETW跟踪文件和Linux/Android Perf/Trace-CMD跟踪文件
- 跨架构:支持英特尔和手臂芯片硬件事件(使用PERF和/或PCM)
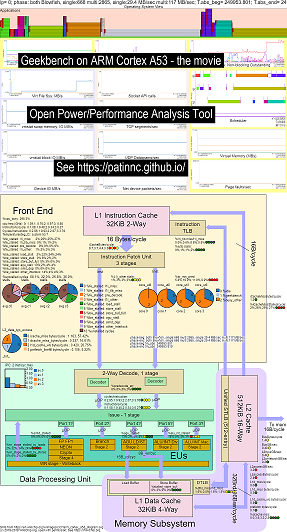
项目网页是https://patinnc.github.io
源代码回购是https://github.com/patinnc/oppat
我已经在CPU框图功能中添加了一个操作系统(OS_VIEW)。这基于Brendan Gregg的页面,例如http://www.brendangregg.com/linuxperf.html。这是一些用于运行Geekbench v2.4.2(32位代码)的旧版本的示例数据,该手臂64bit Ubuntu Mate v18.04.2 Raspberry Pi 3 B+,4 ARM Cortex A53 CPU:
- OS_VIEW和ARM A53 CPU框图运行GeekBench的更改的视频:
- 有一些介绍性幻灯片可以尝试解释OS_VIEW和CPU_DIAGRAM布局,然后1个幻灯片显示了30个子测验中的每一个的结果
- 电影中数据的excel文件:电影中的geekbench excel文件
- 电影中的数据的HTML ...请参阅4个核心ARM Cortext A53上的Geekbench v2.4.2,带有OS_VIEW,CPU图。
- 所有30个阶段的仪表板PNG通过增加说明/秒排序...请参阅带有CPU图4核芯片仪表板的ARM Cortex A53 Raspberry Pi 3运行Geekbench。
这是一些用于运行我的旋转基准测试的示例数据(内存/缓存带宽测试,“旋转” keep-cpu-busy Test测试)Raspberry Pi 3 B+(Cortex A53)CPU:
- OS_VIEW和ARM A53 CPU框图运行旋转的更改的视频:
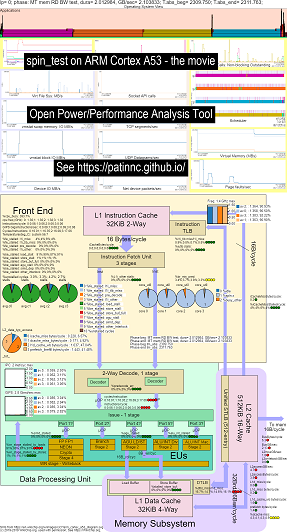
- 有一些介绍性幻灯片可以尝试解释OS_VIEW图表和CPU_DIAGRAGRAM布局,这是一个显示每个子测试的时间(以秒为单位)显示(因此您可以转到t = x secs直接转到该子测验),然后为5个子测试中的每个幻灯片中的每个幻灯片进行一次幻灯片
- 电影中数据的excel文件:电影中的geekbench excel文件
- 电影中数据的HTML ...参见ARM Cortex A53 Raspberry Pi 3带有CPU图4核芯片运行旋转基准测试。
- 所有5个阶段的仪表板PNG通过增加指令/秒排序...请参阅带有CPU图4核芯片仪表板的ARM Cortex A53 Raspberry Pi 3运行自旋基准。
这是用于在Haswell CPU上运行Geekbench的一些示例数据:
- OS_VIEW和HASWELL CPU CPU框图运行GeekBench的更改的视频:
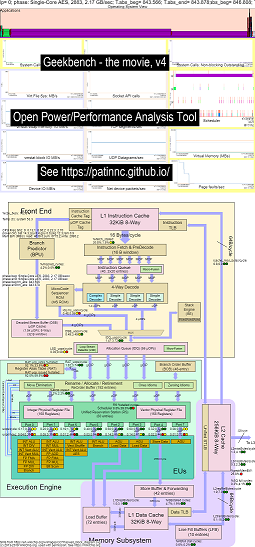
- 有一些介绍性幻灯片可以尝试解释OS_VIEW图表和CPU_DIAGRAM布局,这是一个幻灯片,显示了每个子检验时(以秒为单位)显示(因此您可以转到t = x secs直接转到该子测验),然后为50个子测试中的每个幻灯片中的每个幻灯片进行一次幻灯片
- 电影中数据的excel文件:电影中的geekbench excel文件
- 电影中数据的HTML ...参见Intel Haswell,带有CPU图4-CPU芯片运行Geekbench。
- 所有50个阶段的仪表板PNG通过增加UOPS退休/SEC排序...请参见Intel Haswell仪表板,带有CPU图4核芯片仪表板运行Geekbench。
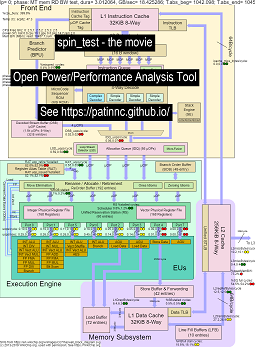
这是一些用于运行我的“自旋”基准测试的数据,并在Haswell CPU上进行4个子测试:
- 第一个子测验是读取内存带宽测试。在测试期间,L2/L3/内存块高度使用并停滞不前。大鼠UOPS/循环很低,因为大鼠大部分停滞不前。
- 第二个子测验是L3读带宽测试。内存BW现在很低。在测试期间,L2和L3块高度使用并停滞不前。大鼠UOPS/循环较高,因为大鼠停滞不前。
- 第三个子测验是L2读带宽测试。 L3和内存BW现在很低。在测试期间,L2块高度使用并停滞不前。大鼠UOPS/循环甚至更高,因为大鼠的失速较小。
- 第四个子测验是一个旋转(只是添加循环)测试。 L2,L3和内存BW接近零。大鼠UOPS/循环约为3.3 UOP/循环,即接近4个UOPS/循环最大。
- 通过分析运行“自旋”的Haswell CPU框图更改的视频。看
- 电影中数据的excel文件:旋转电影中的excel文件
- 电影中数据的HTML ...参见带有CPU图4-CPU芯片的Intel Haswell运行自旋基准。
带有CPU图数据收集的Intel Haswell适用于4-CPU Intel芯片,Linux OS,HTML文件,并通过PERF Sampling和其他收集的数据,带有50多hw事件。 cpu_diagram特征:
- 从wikichip.org的框图SVG开始(允许使用),
- 查看资源限制(例如最大BW,最大途径上的最大字节/循环,最小周期/UOP等),
- 计算用于资源使用的指标
- 下面是内存读取带宽测试的表,该测试在表中显示了资源使用信息(以及由于使用情况而导致CPU是否停滞的估计)。悬停在字段上时,HTML表(但没有PNG)具有弹出信息。表显示:
- 核心停滞在内存带宽上,最大可能25.9 GB/s BW的55%。这是一个内存BW测试
- Superqueue(SQ)已满(核心0和62.3%core1)(因此无法处理更多的L2请求)
- 线条加速器FB已满(30%和51%),因此无法从L2移动到L1D
- 结果是后端停滞(88%和87%),没有UOPS退休。
- UOPS似乎来自环路检测器(因为LSD循环/UOP与大鼠UOPS/循环大致相同。
- Haswell CPU图记忆BW表的屏幕截图
- 以下是L3读取带宽测试的表。
- 现在,内存BW和L3遗失字节/周期大约为零。
- SQ较少停滞(因为我们不在等内存)。
- L2交易字节/周期高约2倍,约为最大64个字节/循环的67%。
- UOPS_RETIRID_STALLS/CYCEL已从MEM BW测试摊位下降到88%的66%。
- 现在,加速缓冲区摊位高2倍以上。 UOPS仍来自LSD。
- Haswell CPU图L3 BW表的屏幕截图
- 以下是L2读带宽测试的表。
- L2错过字节/周期远低于L3测试。
- 现在,UOPS_RETRIED%停滞不见的是L3测试的一半,为34%,FB摊位也约为17%。
- UOPS仍来自LSD。
- Haswell CPU图L2 BW表的屏幕截图
- 以下是一个自旋测试的表(没有负载,只需添加一个循环)即可。
- 现在,几乎有零内存子系统摊位。
- UOPS来自解码流缓冲区(DSB)。
- 3.31循环/UOP时的大鼠retired_uops/循环接近可能的4.0 UOPS/循环。
- 老鼠retired_uops%失速在%8时非常低。
- Haswell CPU图旋转表的屏幕截图
目前,我只有Haswell和ARM A53的CPU_DIAGRAMY电影(因为我没有其他系统要测试),但是不难添加其他框图。您仍然可以获得所有图表,但没有获得CPU_DIAGRAM。
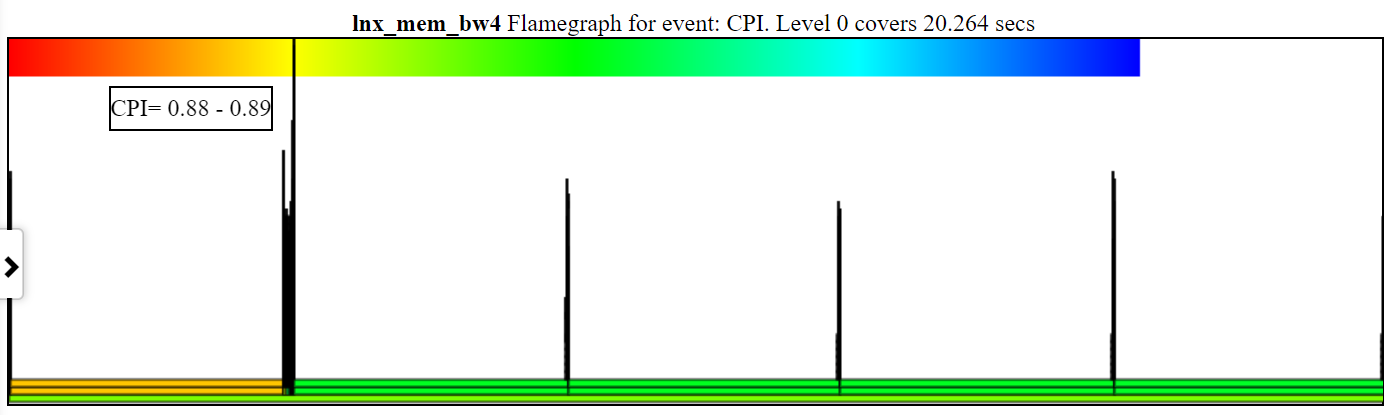
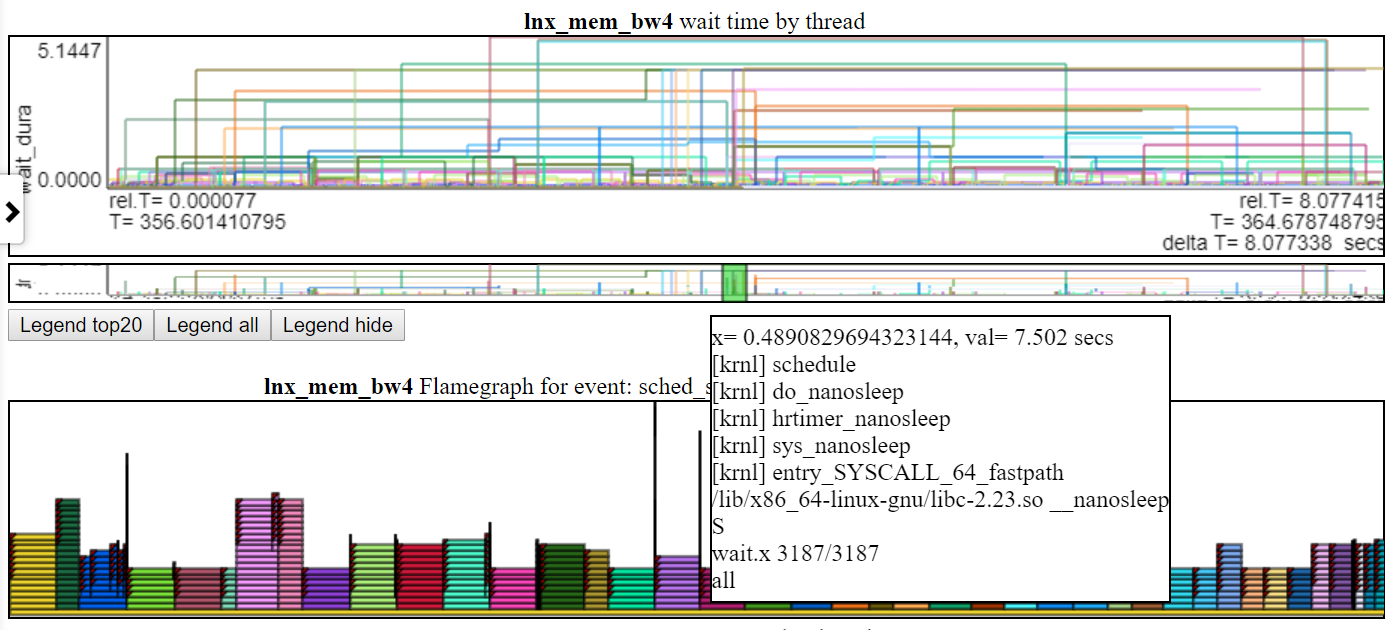
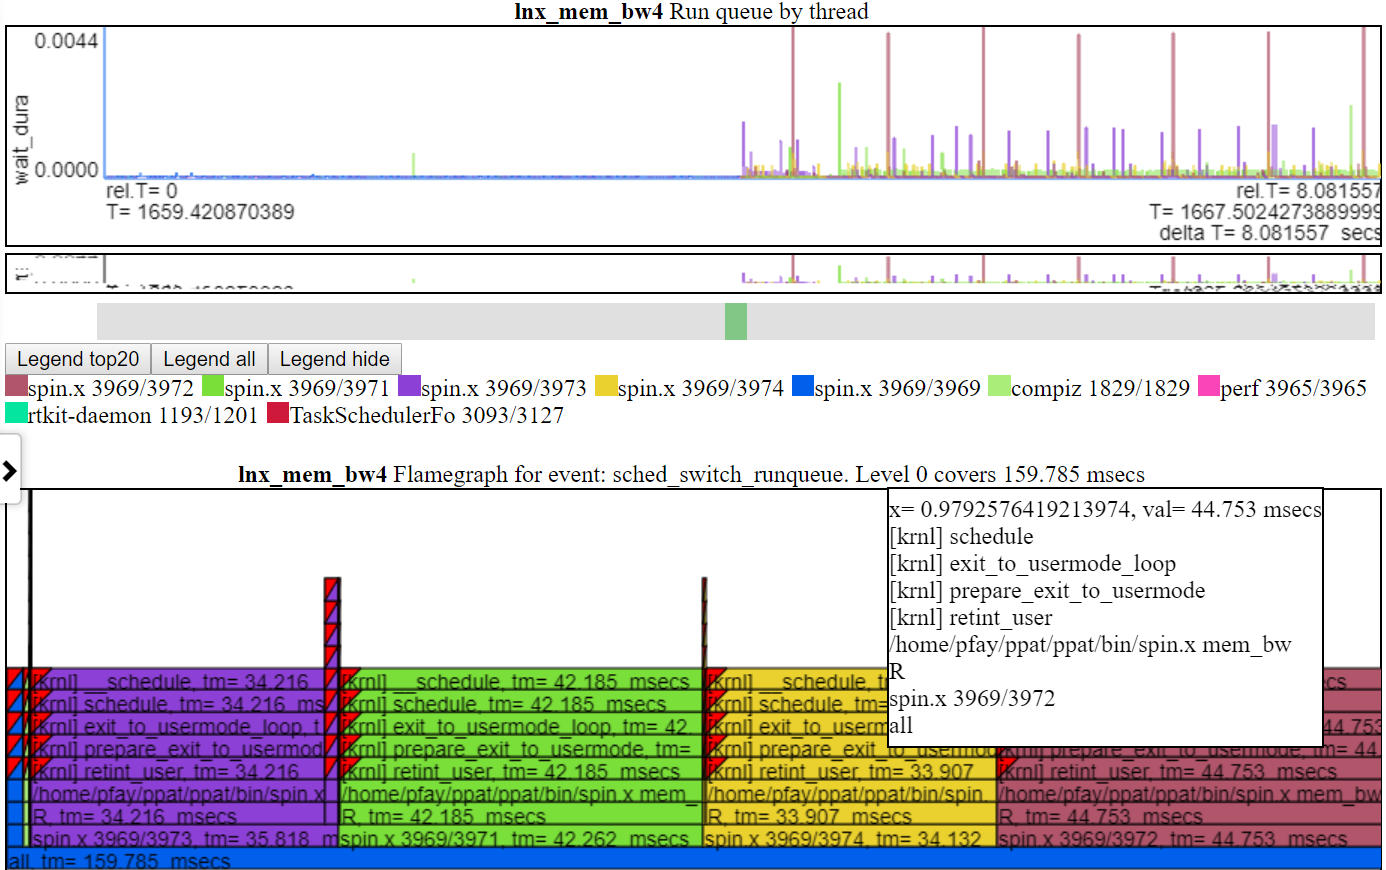
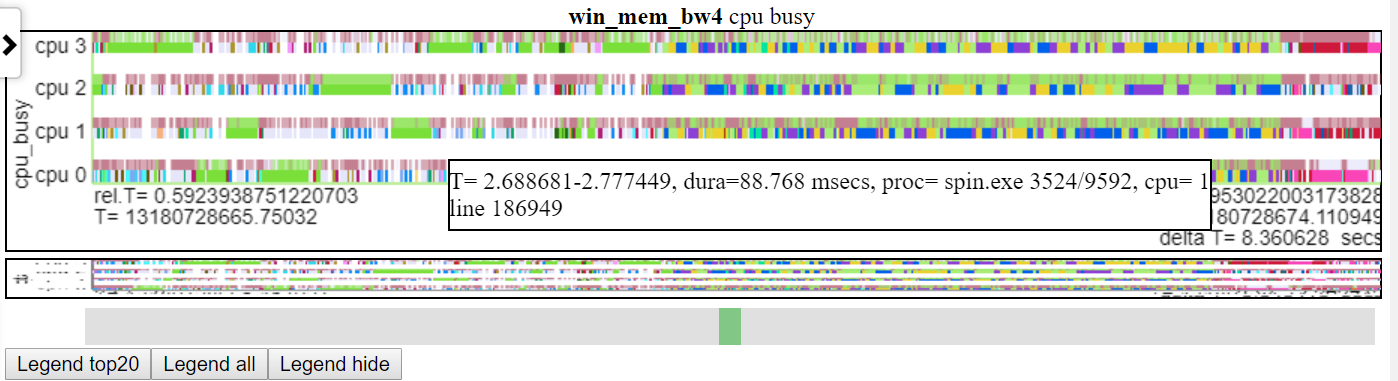
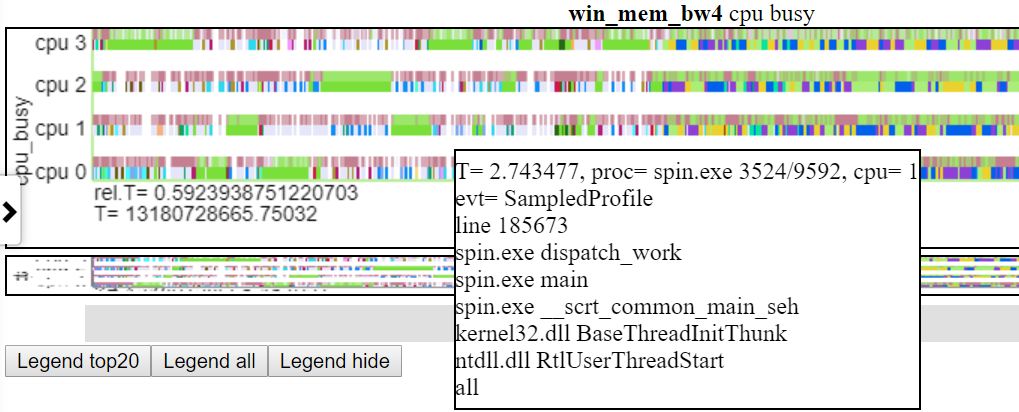
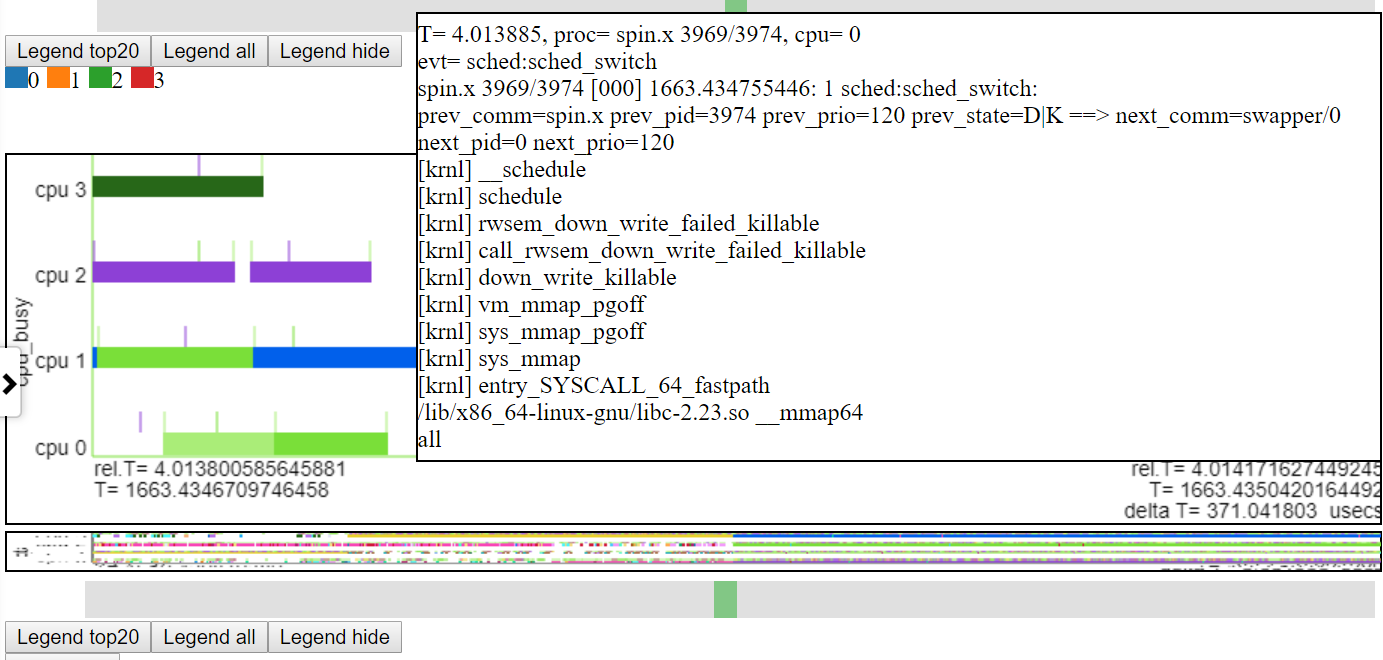
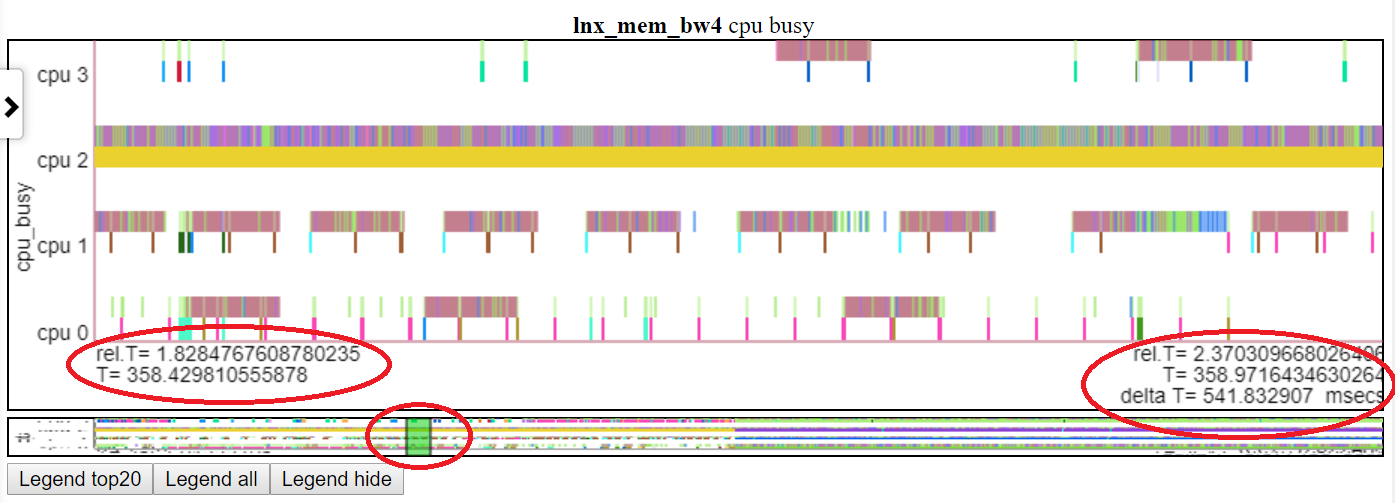
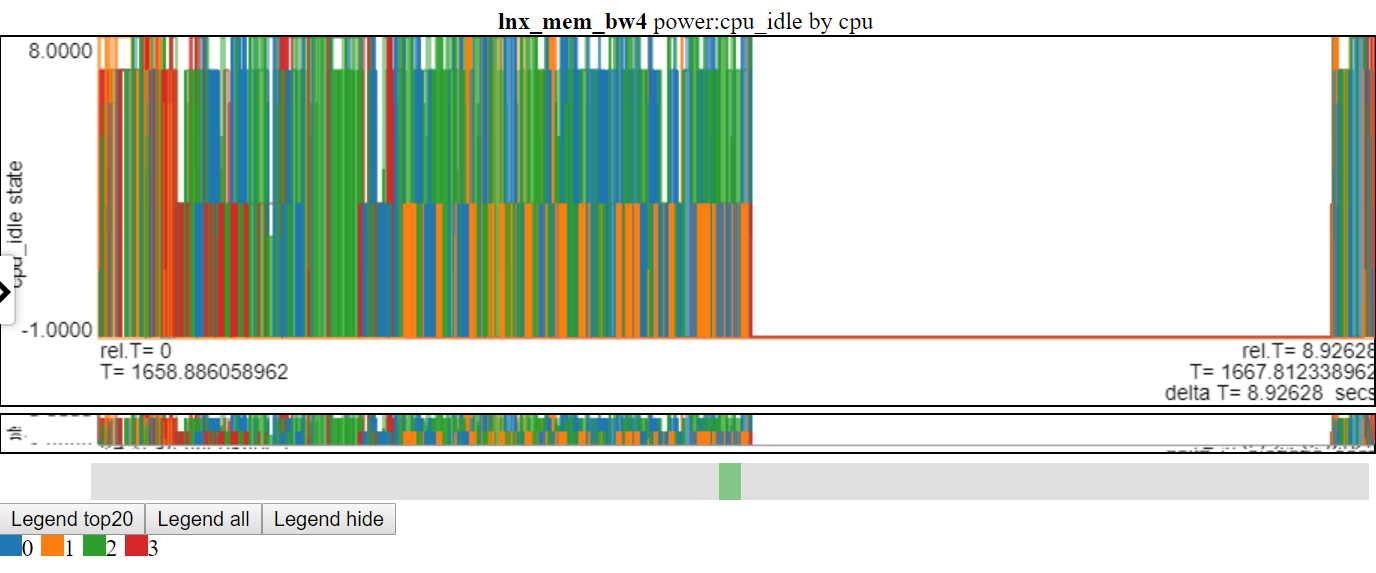
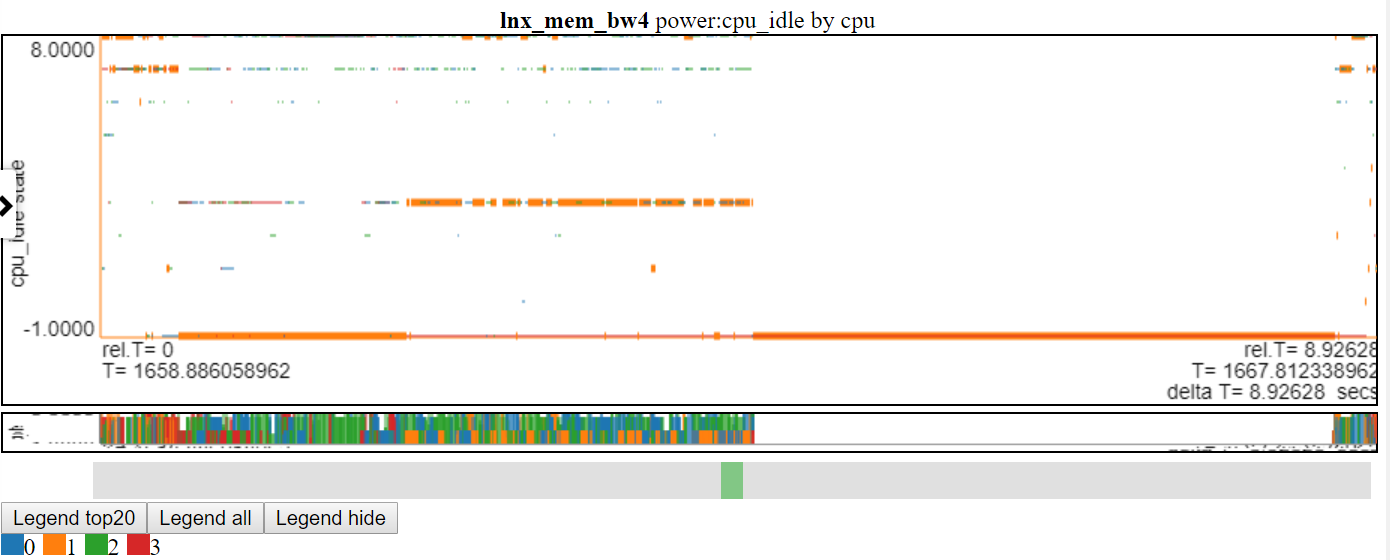
以下是相对图之一。 “ CPU_BUSY”图表显示了每个CPU上正在运行的内容以及每个CPU上发生的事件。例如,绿色圆圈显示一个在CPU 1上运行的spin.x线。红色圆圈显示了在CPU1上发生的一些事件。该图表以Trace-CMD的kernelshark图表进行建模。有关CPU_BUSY图表的更多信息在图表类别中。呼叫框显示光标下事件的事件数据(包括Callstack(如果有))。不幸的是,Windows屏幕截图不会捕获光标。 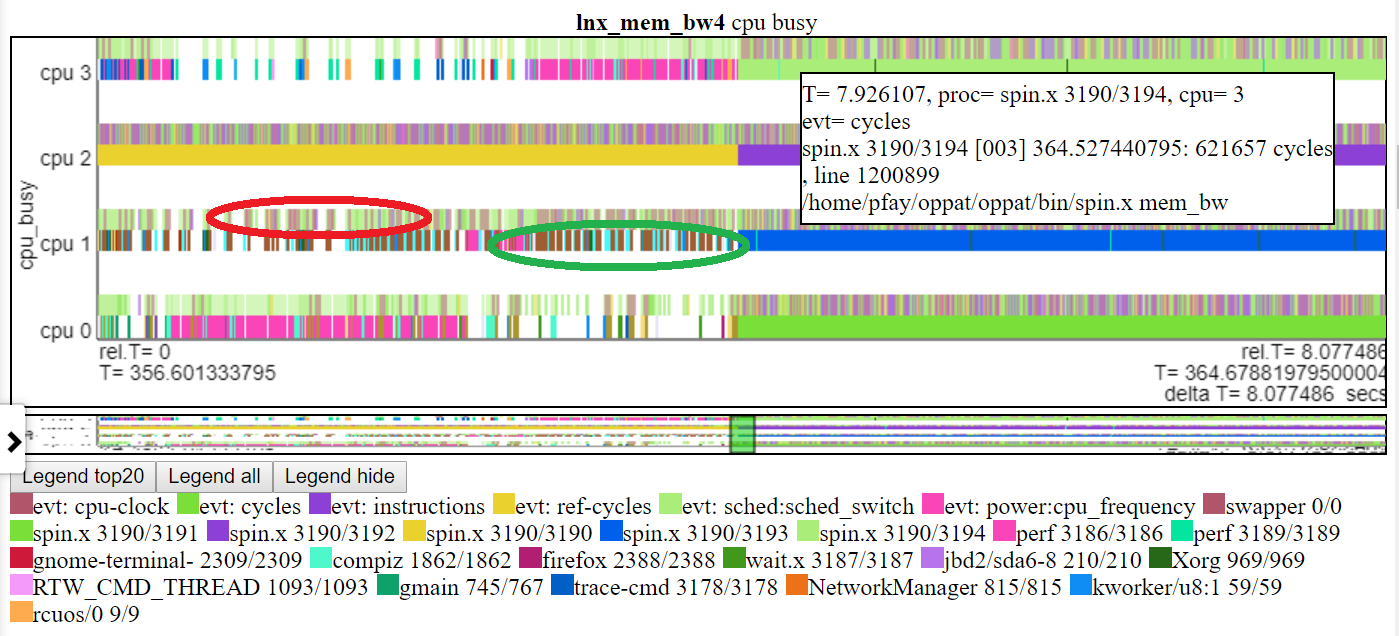
这是一些示例HTML文件。大多数文件的间隔较短,但有些是“完整” 8秒的运行。这些文件不会直接从存储库加载,但是它们将从项目网页上加载:https://patinnc.github.io
- Intel Haswell带有CPU图4-CPU芯片,Linux OS,HTML文件,通过Perf Sampling或50+ HW事件或
- Intel 4-CPU芯片,Windows OS,HTML文件,通过Xperf采样或1 HW事件或
- 完整〜8秒Intel 4-CPU芯片,Windows OS,带PCM和XPERF采样的HTML文件或
- Intel 4-CPU芯片,Linux OS,HTML文件,在2个多路复用组中具有10个HW事件。
- ARM(Broadcom A53)芯片,Raspberry PI3 Linux HTML文件,带有14个HW事件(用于2个多路复用组的CPI,L2 MISSES,MEM BW等)。
- 11 MB,上臂的完整版(Broadcom A53)芯片,Raspberry PI3 Linux HTML文件,带有14个HW事件(用于2个多路复用组的CPI,L2 MISSES,MEM BW等)。
上述某些文件是从〜8秒长期提取的〜2秒间隔。这是整个8秒的运行:
- 整个8秒Linux运行示例HTML压缩文件在此处以获取更完整的文件。该文件对图表数据进行JavaScript Zlib解压缩,因此您会看到消息要求您在解压缩过程中等待(约20秒)。
支持的数据支持
- Linux Perf和/或Trace-CMD性能文件(二进制文件和文本文件),
- 完美统计输出也接受了
- 英特尔PCM数据,
- 其他数据(使用LUA脚本导入),
- 因此,这应该与常规Linux或Android的数据一起使用
- 当前,对于PERF和TRACE-CMD数据,OPPAT需要二进制和后处理的文本文件,并且在“记录”命令行和'perf Script/Trace-CMD报告'命令行上有一些限制。
- 可以使Oppat仅使用perf/trace-cmd文本输出文件,但目前需要二进制文件和文本文件
- Windows ETW数据(由Xperf收集并倾倒到文本)或Intel PCM数据,
- 使用LUA脚本支持的任意权力或性能数据(因此您无需重新编译C ++代码即可导入其他数据(除非LUA性能成为问题)
- 在Linux或Windows上读取数据文件,无论文件起源于何处(因此,在Linux上读取Windows或ETW文本文件上的Perf/Trace-CMD文件)
对立可视化
这是一些完整的示例VisualZation HTML文件:Windows示例HTML文件或此Linux示例HTML文件。如果您在存储库中(不是Github.io项目网站),则必须下载文件,然后将其加载到浏览器中。这些是由OPPAT创建的独立Web文件,例如,可以通过电子邮件发送给其他人,或(如下所示)发布在Web服务器上。
OPPAT在铬中的作用要比Firefox更好,这主要是因为使用TouchPad 2手指滚动的变焦在Chrome上效果更好。
Oppat具有3种可视化模式:
- 通常的图表机制(Oppat后端在其中读取数据文件并将数据发送到浏览器)
- 您还可以创建一个独立的网页,该网页相当于“常规图表机制”,但可以与其他用户交换...独立网页具有所有内置的脚本和数据,因此可以通过电子邮件将其发送给某人,并且可以将其加载到浏览器中。请参阅上面引用的sample_html_files中的html文件,并且(有关lnx_mem_bw4的较长版本)请参见“压缩文件sample_html_files/lnx_mem_bw4_flyl.html.html”
- 您可以' - 保存'数据json文件,然后 - 稍后加载文件。保存的JSON文件具有OPPAT需要发送到浏览器的数据。这避免了重新阅读输入perf/xperf文件,但不会拿起Charts.json中所做的任何更改。使用-web_file选项创建的完整HTML文件仅比 - 保存文件大一点。 - 保存/ - 负载模式需要构建Oppat。请参阅sample_data_json_files subdir中的示例“保存”文件。
VIZ一般信息
- 在浏览器(Linux或Windows上)中图表所有数据
- 图表在JSON文件中定义
- 浏览器接口有点像Windows WPA(左侧的Navbar)。
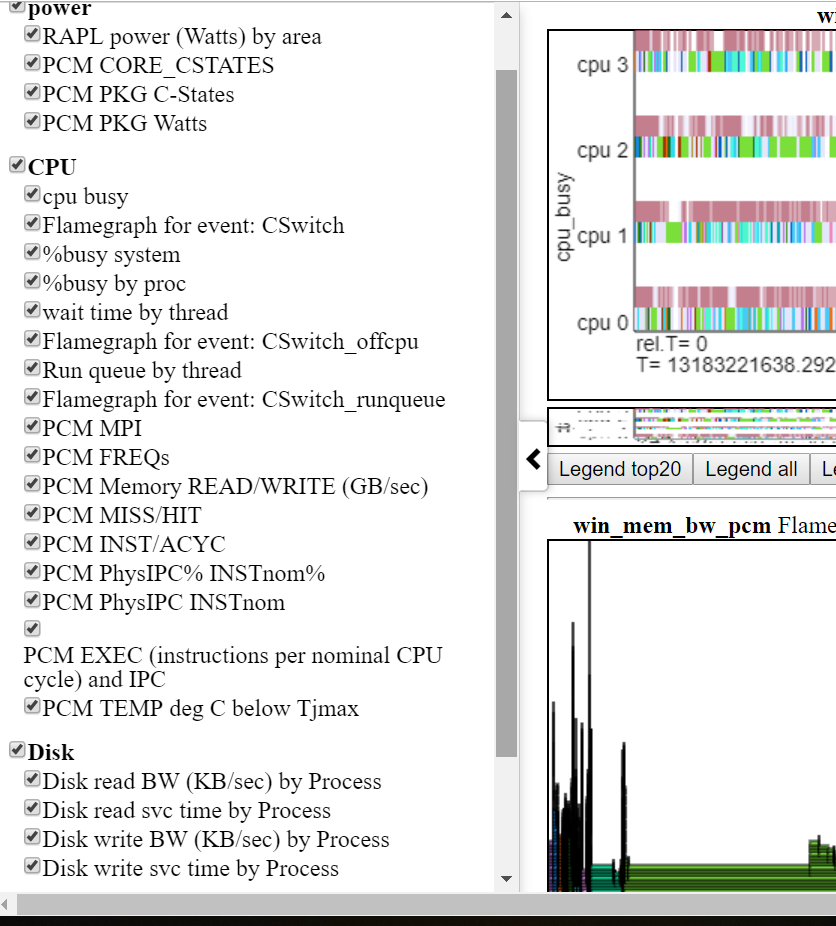
- 下面显示了左Navbar(左侧滑动菜单)。
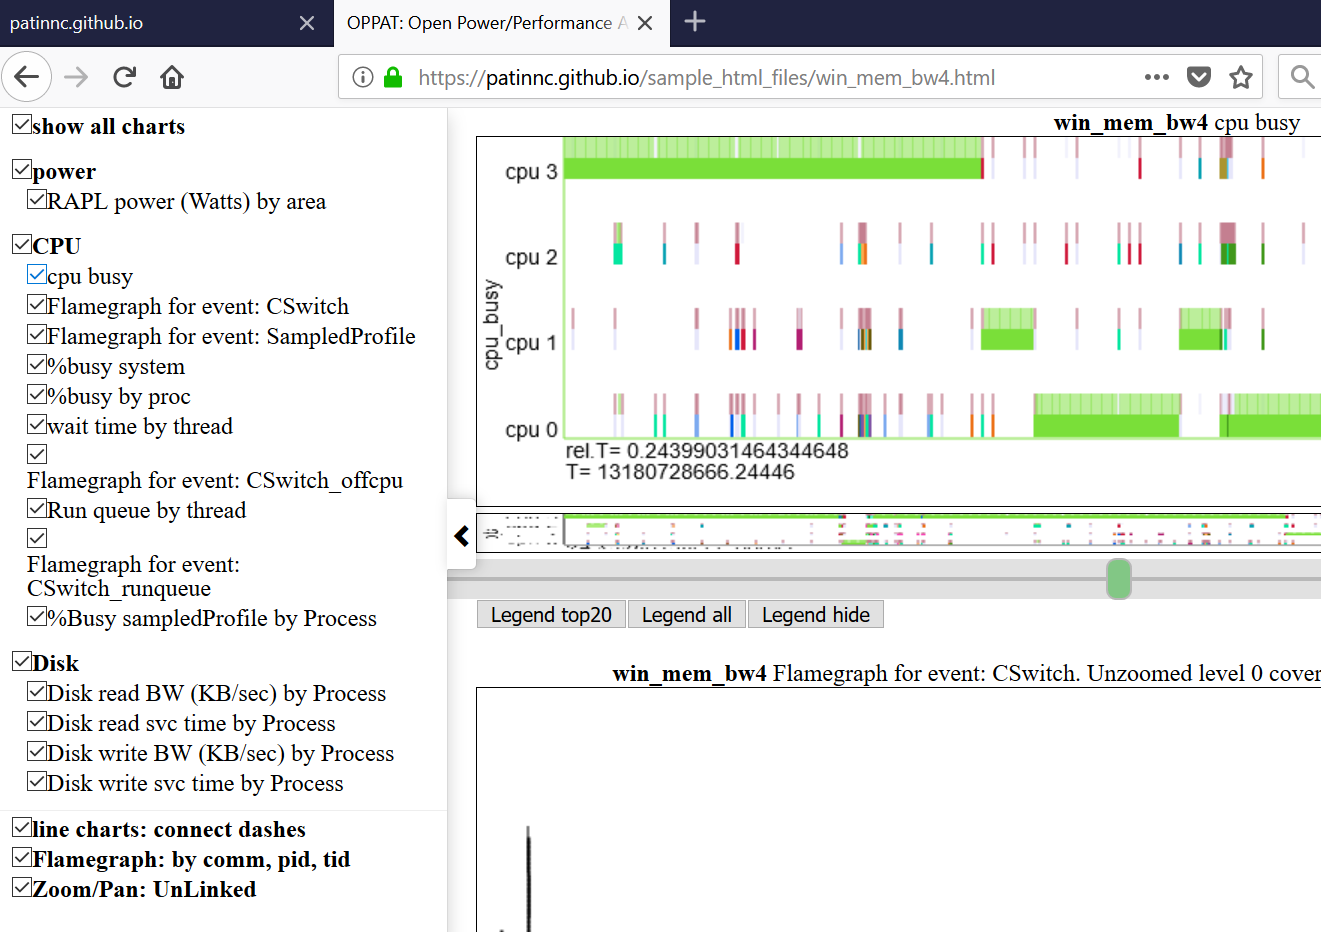
- 图表按类别分组(GPU,CPU,Power等)
- 类别是在Input_files/Charts.json中定义和分配的
- 通过单击Navbar中的图表,可以全部隐藏或选择性地显示图表。
- 悬停在左NAV菜单中的图表标题上,将图表到视图
- 一组文件的数据可以在另一组旁边绘制
- 因此,您可以说,比较Linux Perf Perform vs Windows ETW运行
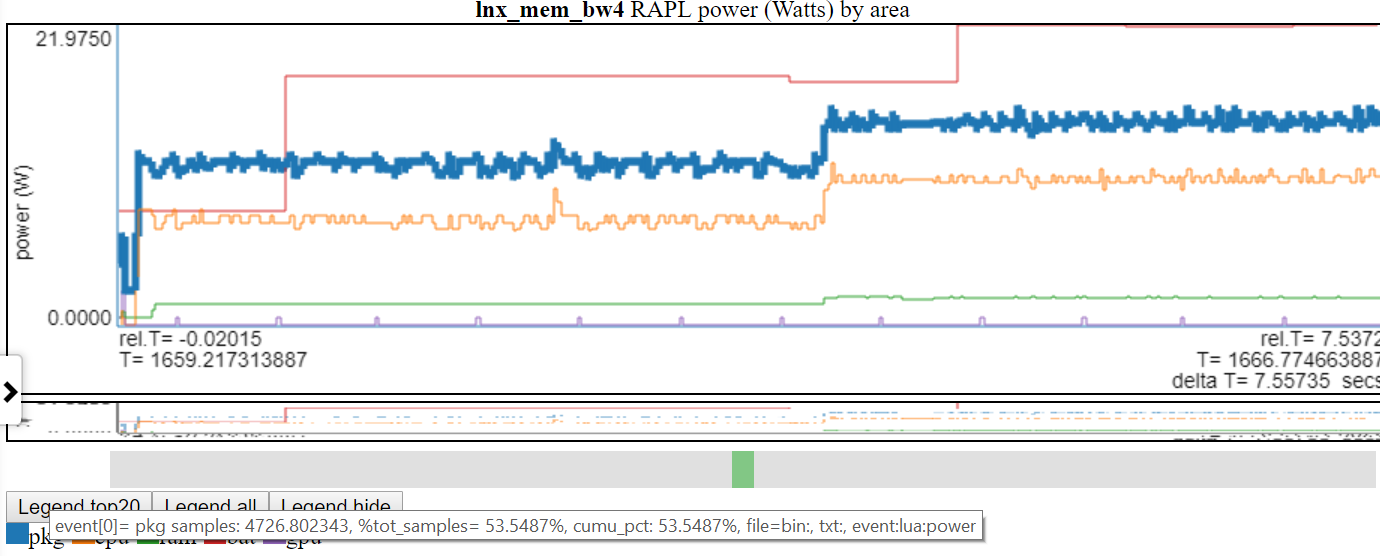
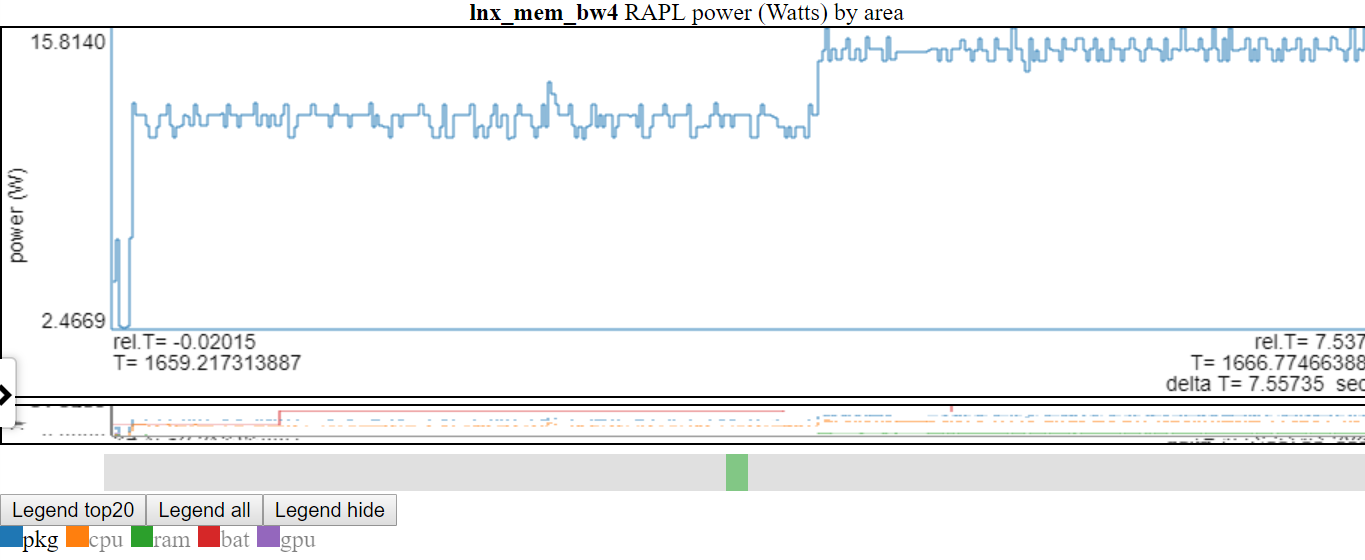
- 下图显示Linux vs Windows功率使用情况:
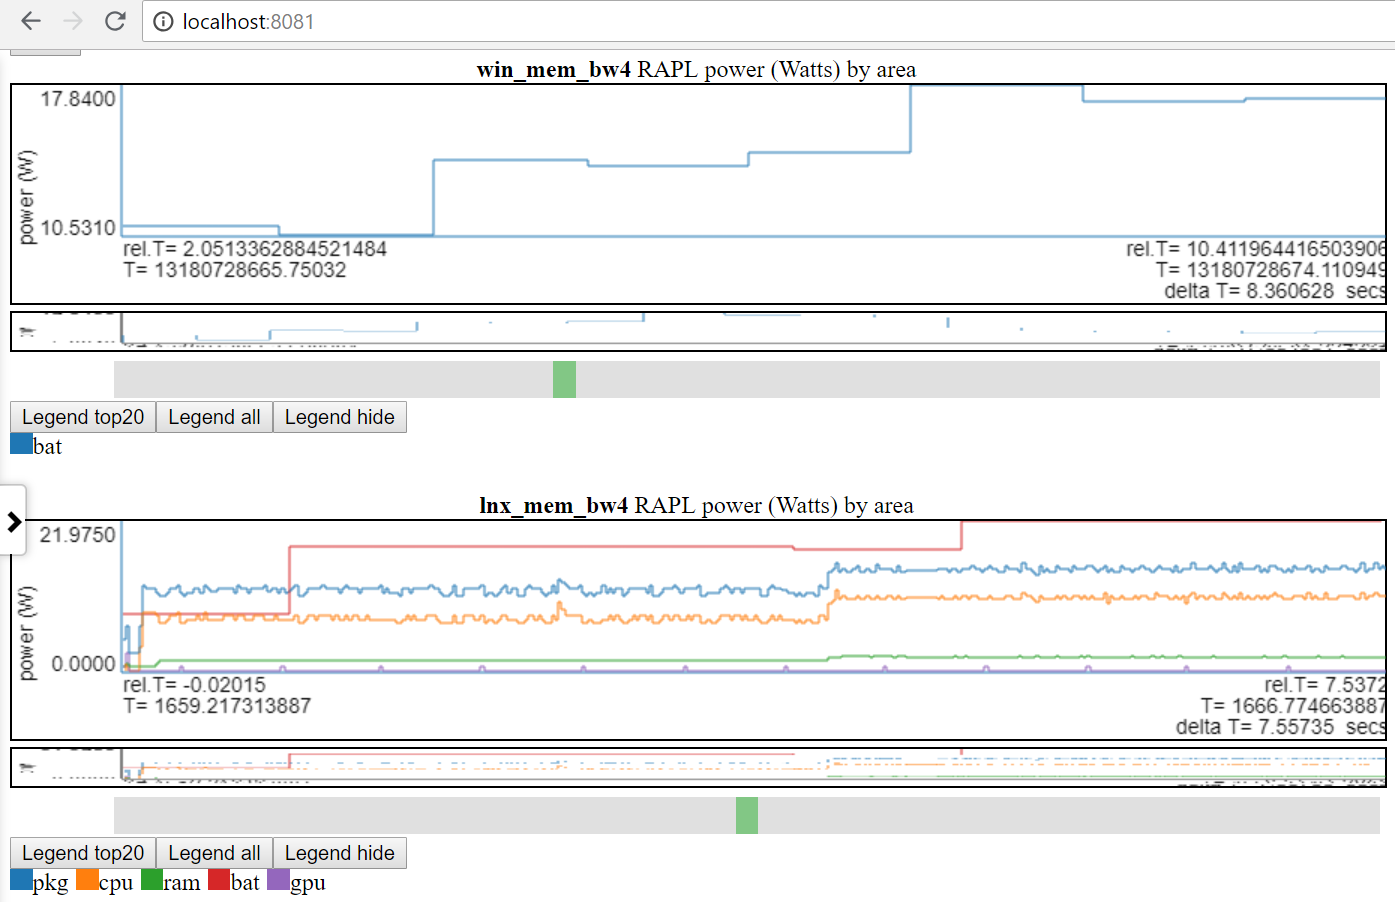
- 我只能在Linux和Windows上使用电池电源。
- 许多站点具有更好的功率数据(以MSEC(或更高)速率为单位的电压/电流/电源)。将这些类型的电源数据(例如来自Kratos或Qualcomm MDPS)合并很容易,但是我无法访问数据。
- 或在同一平台上比较2种不同的运行
- 文件组标签(file_tag)前缀为标题以区分图表
- 在数据dir的file_list.json文件和/或input_files/input_data_files.json中定义了“标签”。
- input_files/input_data_files.json是所有Oppat Data Dirs的列表(但用户必须维护它)。
- 绘制具有相同标题的图表一个接一个地绘制
图表功能:
图表类型:
oppat的数据收集
收集性能和功率数据非常“情况”。一个人将要运行脚本,另一个人需要使用按钮开始测量,然后启动视频,然后用按钮按下按钮结束集合。我有一个用于Windows的脚本和一个用于Linux的脚本,可以演示:
- 启动数据收集,
- 运行工作量,
- 停止数据收集
- 后处理数据(从perf/xperf/trace-cmd二进制数据创建文本文件)
- 将所有数据文件放入输出DIR中
- 在输出dir中创建一个file_list.json文件(告诉Oppat oppat oppat oppat oppat oppat oppat oppation oppation Files的名称和类型)
使用脚本收集数据的步骤:
- 构建spin.exe(spin.x)和wait.exe(wait.x)实用程序
- 来自Oppat Root Dir:
- 在Linux上:
./mk_spin.sh - 在Windows上:
.mk_spin.bat (来自Visual Studio CMD框) - 二进制文件将放在./bin subdir中
- 从运行提供的脚本开始:
- RUN_PERF_X86_HASWELL.SH-对于Haswell CPU_DIAGRAGRAGRAM数据集合
- 在Linux上,类型:
sudo bash ./scripts/run_perf.sh - 默认情况下,脚本将数据放入dir ../oppat_data/lnx/mem_bw7中
- run_perf.sh-您需要安装Trace -CMD和Perf
- 在Linux上,类型:
sudo bash ./scripts/run_perf.sh - 默认脚本将数据放入dir ../oppat_data/lnx/mem_bw4中
- run_xperf.bat-您需要安装xperf.exe。
- 在Windows上,从具有管理员特权的CMD框,类型:
.scriptsrun_xperf.sh - 默认情况下,脚本将数据放入dir .. oppat_data win mem_bw4
- 如果要更改默认值,请编辑运行脚本
- 除了数据文件外,运行脚本还在输出dir中创建file_list.json文件。 OPPAT使用file_list.json文件来找出输出dir中的文件名和文件类型。
- 运行脚本的“工作负载”是spin.x(或spin.exe),它在1 CPU上进行4秒钟,然后在所有CPU上进行内存带宽测试,然后再进行4秒。
- 另一个程序wait.x/wait.exe也在后台开始。 WAIT.CPP读取我的笔记本电脑的电池信息。它可以在我的双启动Windows 10/Linux Ubuntu笔记本电脑上工作。 SYSFS文件在您的Linux上可能具有不同的名称,并且在Android上几乎肯定是不同的。
- 在Linux上,您可能只能使用与run_perf.sh中相同的语法生成prf_trace.data和prf_trace.txt文件,但我没有尝试过。
- 如果您要在笔记本电脑上运行并想要获取电池电源,请在运行脚本之前记住断开电源电缆。
PCM数据支持
- Oppat可以读取并图表PCM .CSV文件。
- 以下是创建图表列表的快照。
- 不幸的是,您必须对PCM进行补丁,以创建一个具有绝对时间戳的文件,以便OPPAT进行处理。
- 这是因为PCM CSV文件没有时间戳我可以用来与其他数据源相关。
- 我在这里添加了补丁PCM补丁
建立Oppat
- 在Linux上,
make在Oppat root dir中- 如果一切正常,应该有一个bin/oppat.x文件
- 在Windows上,您需要:
- 安装Windows版本的GNU Make。请参阅http://gnuwin32.sourceforge.net/packages/make.htm或,对于最少所需的二进制文件,请使用http://gnuwin32.sourceforge.net/downlinks/downlinks/make.php
- 将这个新的“ make”二进制放在路径中
- 您需要当前的Visual Studio 2015或2017 C/C ++编译器(我同时使用了VS 2015 Professional和VS 2017社区编译器)
- 启动Windows Visual Studio X64本机CMD提示框
- 在Oppat Root Dir中输入
make - 如果一切正常
- 如果要更改源代码
- 您需要安装Perl
- 在linux上,在oppat root dir中do:
./mk_depends.sh 。这将创建一个依赖s_lnx.mk依赖项文件。 - 在Windows上,在Oppat root Dir中:
.mk_depends.bat 。 This will create a depends_win.mk dependency file.
- If you are going to run the sample run_perf.sh or run_xperf.bat scripts, then you need to build the spin and wait utilities:
- On Linux:
./mk_spin.sh - On Windows:
.mk_spin.bat
Running OPPAT
- Run the data collection steps above
- now you have data files in a dir (if you ran the default run_* scripts:
- on Windows ..oppat_datawinmem_bw4
- on Linux ../oppat_data/lnx/mem_bw4
- You need to add the created files to the input_filesinput_data_files.json file:
- Starting OPPAT reads all the data files and starts the web server
- on Windows to generate the haswell cpu_diagram (assuming your data dir is ..oppat_datalnxmem_bw7)
binoppat.exe -r ..oppat_datalnxmem_bw7 --cpu_diagram webhaswell_block_diagram.svg > tmp.txt
- on Windows (assuming your data dir is ..oppat_datawinmem_bw4)
binoppat.exe -r ..oppat_datawinmem_bw4 > tmp.txt
- on Linux (assuming your data dir is ../oppat_data/lnx/mem_bw4)
bin/oppat.exe -r ../oppat_data/lnx/mem_bw4 > tmp.txt
bin/oppat.exe -r ../oppat_data/lnx/mem_bw4 --web_file tst2.html > tmp.txt
- Then you can load the file into the browser with the URL address:
file:///C:/some_path/oppat/tst2.html
Derived Events
'Derived events' are new events created from 1 or more events in a data file.
- Say you want to use the ETW Win32k InputDeviceRead events to track when the user is typing or moving the mouse.
- ETW has 2 events:
- Microsoft-Windows-Win32k/InputDeviceRead/win:Start
- Microsoft-Windows-Win32k/InputDeviceRead/win:Stop
- So with the 2 above events we know when the system started reading input and we know when it stopped reading input
- But OPPAT plots just 1 event per chart (usually... the cpu_busy chart is different)
- We need a new event that marks the end of the InputDeviceRead and the duration of the event
- The derived event needs:
- a new event name (in chart.json... see for example the InputDeviceRead event)
- a LUA file and routine in src_lua subdir
- 1 or more 'used events' from which the new event is derived
- the derived events have to be in the same file
- For the InputDeviceRead example, the 2 Win32k InputDeviceRead Start/Stop events above are used.
- The 'used events' are passed to the LUA file/routine (along with the column headers for the 'used events') as the events are encountered in the input trace file
- In the InputDeviceRead lua script:
- the script records the timestamp and process/pid/tid of a 'start' event
- when the script gets a matching 'Stop' event (matching on process/pid/tid), the script computes a duration for the new event and passes it back to OPPAT
- A 'trigger event' is defined in chart.json and if the current event is the 'trigger event' then (after calling the lua script) the new event is emitted with the new data field(s) from the lua script.
- An alternate to the 'trigger event' method is to have the lua script indicate whether or not it is time to write the new event. For instance, the scr_lua/prf_CPI.lua script writes a '1' to a variable named ' EMIT ' to indicate that the new CPI event should be written.
- The new event will have:
- the name (from the chart.json evt_name field)
- The data from the trigger event (except the event name and the new fields (appended)
- I have tested this on ETW data and for perf/trace-cmd data
Using the browser GUI Interface
TBD
Defining events and charts in charts.json
TBD
Rules for input_data_files.json
- The file 'input_files/input_data_files.json' can be used to maintain a big list of all the data directories you have created.
- You can then select the directory by just specifying the file_tag like:
- bin/oppat.x -u lnx_mem_bw4 > tmp.txt # assuming there is a file_tag 'lnx_mem_bw4' in the json file.
- The big json file requires you to copy the part of the data dir's file_list.json into input_data_files.json
- in the file_list.json file you will see lines like:
{ "cur_dir" : " %root_dir%/oppat_data/win/mem_bw4 " },
{ "cur_tag" : " win_mem_bw4 " },
{ "txt_file" : " etw_trace.txt " , "tag" : " %cur_tag% " , "type" : " ETW " },
{ "txt_file" : " etw_energy2.txt " , "wait_file" : " wait.txt " , "tag" : " %cur_tag% " , "type" : " LUA " }- don't copy the lines like below from the file_list.json file:
- paste the copied lines into input_data_files.json. Pay attention to where you paste the lines. If you are pasting the lines at the top of input_data_files.json (after the
{"root_dir":"/data/ppat/"}, then you need add a ',' after the last pasted line or else JSON will complain. - for Windows data files add an entry like below to the input_filesinput_data_files.json file:
- yes, use forward slashes:
{ "root_dir" : " /data/ppat/ " },
{ "cur_dir" : " %root_dir%/oppat_data/win/mem_bw4 " },
{ "cur_tag" : " win_mem_bw4 " },
{ "txt_file" : " etw_trace.txt " , "tag" : " %cur_tag% " , "type" : " ETW " },
{ "txt_file" : " etw_energy2.txt " , "wait_file" : " wait.txt " , "tag" : " %cur_tag% " , "type" : " LUA " }- for Linux data files add an entry like below to the input_filesinput_data_files.json file:
{ "root_dir" : " /data/ppat/ " },
{ "cur_dir" : " %root_dir%/oppat_data/lnx/mem_bw4 " },
{ "cur_tag" : " lnx_mem_bw4 " },
{ "bin_file" : " prf_energy.txt " , "txt_file" : " prf_energy2.txt " , "wait_file" : " wait.txt " , "tag" : " %cur_tag% " , "type" : " LUA " },
{ "bin_file" : " prf_trace.data " , "txt_file" : " prf_trace.txt " , "tag" : " %cur_tag% " , "type" : " PERF " },
{ "bin_file" : " tc_trace.dat " , "txt_file" : " tc_trace.txt " , "tag" : " %cur_tag% " , "type" : " TRACE_CMD " },- Unfortunately you have to pay attention to proper JSON syntax (such as trailing ','s)
- Here is an explanation of the fields:
- The 'root_dir' field only needs to entered once in the json file.
- It can be overridden on the oppat cmd line line with the
-r root_dir_path option - If you use the
-r root_dir_path option it is as if you had set "root_dir":"root_dir_path" in the json file - the 'root_dir' field has to be on a line by itself.
- The cur_dir field applies to all the files after the cur_dir line (until the next cur_dir line)
- the '%root_dir% string in the cur_dir field is replaced with the current value of 'root_dir'.
- the 'cur_dir' field has to be on a line by itself.
- the 'cur_tag' field is a text string used to group the files together. The cur_tag field will be used to replace the 'tag' field on each subsequent line.
- the 'cur_tag' field has to be on a line by itself.
- For now there are four types of data files indicated by the 'type' field:
- type:PERF These are Linux perf files. OPPAT currently requires both the binary data file (the bin_file field) created by the
perf record cmd and the perf script text file (the txt_file field). - type:TRACE_CMD These are Linux trace-cmd files. OPPAT currently requires both the binary dat file (the bin_file field) created by the
trace-cmd record cmd and the trace-cmd report text file (the txt_file field). - type:ETW These are Windows ETW xperf data files. OPPAT currently requires only the text file (I can't read the binary file). The txt_file is created with
xperf ... -a dumper command. - type:LUA These files are all text files which will be read by the src_lua/test_01.lua script and converted to OPPAT data.
- the 'prf_energy.txt' file is
perf stat output with Intel RAPL energy data and memory bandwidth data. - the 'prf_energy2.txt' file is created by the wait utility and contains battery usage data in the 'perf stat' format.
- the 'wait.txt' file is created by the wait utility and shows the timestamp when the wait utility began
- Unfortunately 'perf stat' doesn't report a high resolution timestamp for the 'perf stat' start time
限制
- The data is not reduced on the back-end so every event is sent to the browser... this can be a ton of data and overwhelm the browsers memory
- I probably should have some data reduction logic but I wanted to get feedback first
- You can clip the files to a time range:
oppat.exe -b abs_beg_time -e abs_beg_time to reduce the amout of data- This is a sort of crude mechanism right now. I just check the timestamp of the sample and discard it if the timestamp is outside the interval. If the sample has a duration it might actually have data for the selected interval...
- There are many cases where you want to see each event as opposed to averages of events.
- On my laptop (with 4 CPUs), running for 10 seconds of data collection runs fine.
- Servers with lots of CPUs or running for a long time will probably blow up OPPAT currently.
- The stacked chart can cause lots of data to be sent due to how it each event on one line is now stacked on every other line.
- Limited mechanism for a chart that needs more than 1 event on a chart...
- say for computing CPI (cycles per instruction).
- Or where you have one event that marks the 'start' of some action and another event that marks the 'end' of the action
- There is a 'derived events' logic that lets you create a new event from 1 or more other events
- See the derived event section
- The user has to supply or install the data collection software:
- on Windows xperf
- See https://docs.microsoft.com/en-us/windows-hardware/get-started/adk-install
- You don't need to install the whole ADK... the 'select the parts you want to install' will let you select just the performance tools
- on Linux perf and/or trace-cmd
sudo apt-get install linux-tools-common linux-tools-generic linux-tools- ` uname -r `
- For trace-cmd, see https://github.com/rostedt/trace-cmd
- You can do (AFAIK) everything in 'perf' as you can in 'trace-cmd' but I have found trace-cmd has little overhead... perhaps because trace-cmd only supports tracepoints whereas perf supports tracepoints, sampling, callstacks and more.
- Currently for perf and trace-cmd data, you have to give OPPAT both the binary data file and the post-processed text file.
- Having some of the data come from the binary file speeds things up and is more reliable.
- But I don't want to the symbol handling and I can't really do the post-processing of the binary data. Near as I can tell you have to be part of the kernel to do the post processing.
- OPPAT requires certain clocks and a certain syntax of 'convert to text' for perf and trace-cmd data.
- OPPAT requires clock_monotonic so that different file timestamps can be correlated.
- When converting the binary data to text (trace-cmd report or 'perf script') OPPAT needs the timestamp to be in nanoseconds.
- see scriptsrun_xperf.bat and scriptsrun_perf.sh for the required syntax
- given that there might be so many files to read (for example, run_perf.sh generates 7 input files), it is kind of a pain to add these files to the json file input_filesinput_data_files.json.
- the run_xperf.bat and run_perf.sh generate a file_list.json in the output directory.
- perf has so, so many options... I'm sure it is easy to generate some data which will break OPPAT
- The most obvious way to break OPPAT is to generate too much data (causing browser to run out of memory). I'll probably handle this case better later but for this release (v0.1.0), I just try to not generate too much data.
- For perf I've tested:
- sampling hardware events (like cycles, instructions, ref-cycles) and callstacks for same
- software events (cpu-clock) and callstacks for same
- tracepoints (sched_switch and a bunch of others) with/without callstacks
- Zooming Using touchpad scroll on Firefox seems to not work as well it works on Chrome
 。
。 。
。
 。
。 。
。