เครื่องมือการวิเคราะห์เปิดพลังงาน/ประสิทธิภาพ (OPPAT)
สารบัญ
- การแนะนำ
- ประเภทของข้อมูลที่รองรับ
- การสร้างภาพข้อมูล
- คุณสมบัติแผนภูมิ
- ประเภทแผนภูมิ
- การรวบรวมข้อมูลสำหรับ Oppat
- รองรับข้อมูล PCM
- อาคาร Oppat
- วิ่งตรงข้าม
- เหตุการณ์ที่ได้รับ
- ใช้อินเทอร์เฟซ Browswer GUI
- ข้อ จำกัด
การแนะนำ
เครื่องมือการวิเคราะห์พลังงาน/การวิเคราะห์ประสิทธิภาพ (OPPAT) เป็นเครื่องมือ Cross-OS, เครื่องมือการวิเคราะห์พลังงานข้ามสถาปัตยกรรมและการวิเคราะห์ประสิทธิภาพ
- Cross-OS: รองรับไฟล์ Trace Windows ETW และไฟล์ Trace Linux/Android Perf/Trace-CMD
- Cross-Architecture: รองรับเหตุการณ์ฮาร์ดแวร์ Intel และ Arm Chips (ใช้ PERF และ/หรือ PCM)
เว็บเพจโครงการคือ https://patinnc.github.io
ซอร์สโค้ด repo คือ https://github.com/patinnc/oppat
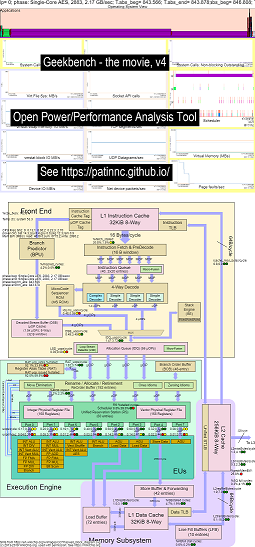
ฉันได้เพิ่มระบบปฏิบัติการ (os_view) ลงในคุณสมบัติไดอะแกรมบล็อก CPU สิ่งนี้ขึ้นอยู่กับหน้าของ Brendan Gregg เช่น http://www.brendangregg.com/linuxperf.html นี่คือข้อมูลตัวอย่างบางส่วนสำหรับการใช้งาน Geekbench v2.4.2 เวอร์ชันเก่า (รหัส 32 บิต) บนแขน 64 บิต Ubuntu Mate V18.04.2 Raspberry Pi 3 B+, 4 แขน A53 CPUs:
- วิดีโอการเปลี่ยนแปลงของ OS_View และ ARM A53 CPU บล็อกไดอะแกรมที่ทำงาน GeekBench:
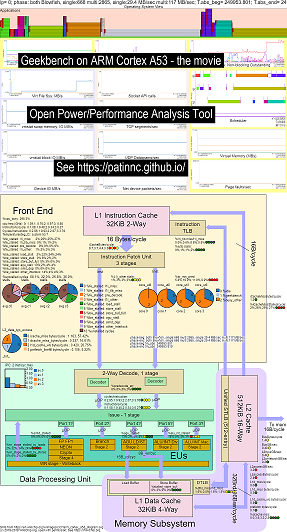
- มีสไลด์เบื้องต้นบางอย่างเพื่อลองและอธิบายการจัดวาง OS_View และ CPU_DIAGRAM จากนั้นสไลด์ 1 รายการแสดงผลลัพธ์ต่อการทดสอบย่อย 30 รายการแต่ละครั้ง
- ไฟล์ excel ของข้อมูลในภาพยนตร์: ไฟล์ excel จาก geekbench ภาพยนตร์
- HTML ของข้อมูลในภาพยนตร์ ... ดู Geekbench v2.4.2 บน 4 core arm cortext A53 พร้อม os_view, CPU Diagram
- แดชบอร์ด PNG สำหรับทั้ง 30 เฟสเรียงลำดับโดยการเพิ่มคำแนะนำ/วินาที ... ดู ARM Cortex A53 Raspberry Pi 3 พร้อมแผนภาพ CPU Diagram 4-core Chip Dashboard ที่ใช้งาน Geekbench
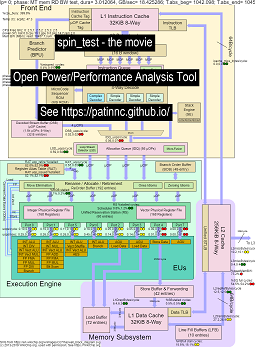
นี่คือข้อมูลตัวอย่างบางส่วนสำหรับการเรียกใช้เกณฑ์มาตรฐานสปินของฉัน (การทดสอบแบนด์วิดท์หน่วยความจำ/แคช, การทดสอบ 'หมุน' CPU-busy) บน Raspberry Pi 3 B+ (Cortex A53) CPU: CPU:
- วิดีโอการเปลี่ยนแปลงของ OS_VIEW และ ARM A53 CPU บล็อกไดอะแกรมที่กำลังทำงานหมุน:
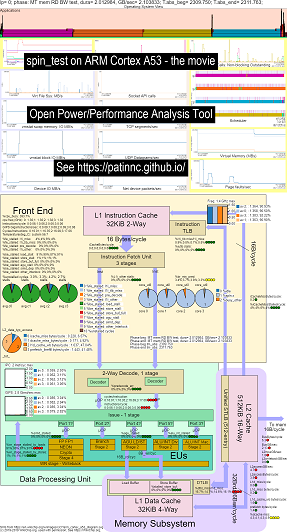
- มีสไลด์เบื้องต้นบางอย่างเพื่อลองและอธิบายแผนภูมิ os_view และเค้าโครง CPU_Diagram สไลด์ที่แสดงในเวลา (ในวินาที) การทดสอบย่อยแต่ละครั้งจะแสดง (เพื่อให้คุณสามารถไปที่ t = x วินาทีเพื่อไปทดสอบย่อยโดยตรง)
- ไฟล์ excel ของข้อมูลในภาพยนตร์: ไฟล์ excel จาก geekbench ภาพยนตร์
- HTML ของข้อมูลในภาพยนตร์ ... ดู ARM Cortex A53 Raspberry Pi 3 พร้อม CPU Diagram 4-core Chip Running Spin Benchmark
- แดชบอร์ด PNG สำหรับทั้ง 5 เฟสเรียงลำดับโดยการเพิ่มคำแนะนำ/วินาที ... ดู ARM Cortex A53 Raspberry Pi 3 พร้อมไดอะแกรม CPU Diagram 4-core Chip Dashboard ที่ใช้มาตรฐานสปิน
นี่คือข้อมูลตัวอย่างสำหรับการเรียกใช้ Geekbench บน Haswell CPU:
- วิดีโอการเปลี่ยนแปลงของ OS_View และ Haswell CPU บล็อกไดอะแกรมที่ทำงาน Geekbench:
- มีสไลด์เบื้องต้นบางอย่างเพื่อลองและอธิบายแผนภูมิ os_view และเค้าโครง CPU_Diagram สไลด์ที่แสดงในเวลา (ในวินาที) การทดสอบย่อยแต่ละครั้งจะแสดง (เพื่อให้คุณสามารถไปที่ t = x วินาทีเพื่อไปยังการทดสอบย่อยโดยตรง)
- ไฟล์ excel ของข้อมูลในภาพยนตร์: ไฟล์ excel จาก geekbench ภาพยนตร์
- HTML ของข้อมูลในภาพยนตร์ ... ดู Intel Haswell ด้วย CPU Diagram 4-CPU Chip ที่ใช้งาน Geekbench
- PNG แดชบอร์ดสำหรับ 50 เฟสที่เรียงลำดับโดยการเพิ่ม UOPS Retired/Sec ... ดู Intel Haswell Dashboard พร้อมไดอะแกรม CPU 4-core Chip Dashboard ที่ใช้งาน Geekbench
นี่คือข้อมูลบางส่วนสำหรับการเรียกใช้มาตรฐาน 'สปิน' ของฉันพร้อมการทดสอบย่อย 4 ครั้งใน Haswell CPU:
- การทดสอบย่อยครั้งที่ 1 คือการทดสอบแบนด์วิดธ์หน่วยความจำ บล็อก L2/L3/หน่วยความจำถูกใช้อย่างมากและหยุดทำงานในระหว่างการทดสอบ หนู UOPS/วัฏจักรต่ำเนื่องจากหนูส่วนใหญ่จะหยุด
- การทดสอบย่อยครั้งที่ 2 คือการทดสอบแบนด์วิดท์ L3 อ่าน หน่วยความจำ BW ตอนนี้ต่ำ บล็อก L2 & L3 มีการใช้อย่างมากและหยุดชะงักในระหว่างการทดสอบ หนู UOPS/วัฏจักรสูงกว่าเนื่องจากหนูหยุดชะงักน้อยลง
- การทดสอบย่อยครั้งที่ 3 คือการทดสอบแบนด์วิดท์ L2 อ่าน L3 และหน่วยความจำ BW ตอนนี้ต่ำ บล็อก L2 ถูกใช้อย่างมากและหยุดทำงานในระหว่างการทดสอบ หนู UOPS/วัฏจักรนั้นสูงขึ้นเนื่องจากหนูหยุดนิ่งน้อยลง
- การทดสอบย่อยครั้งที่ 4 คือการทดสอบสปิน (เพียงแค่ลูปเพิ่ม) L2, L3 และหน่วยความจำ BW อยู่ใกล้ศูนย์ หนู UOPS/วัฏจักรอยู่ที่ประมาณ 3.3 UOPS/รอบซึ่งกำลังเข้าใกล้ 4 UOPS/รอบสูงสุดที่เป็นไปได้
- วิดีโอของการเปลี่ยนแปลงแผนภาพบล็อก Haswell CPU ที่ทำงาน 'หมุน' ด้วยการวิเคราะห์ ดู
- ไฟล์ excel ของข้อมูลในภาพยนตร์: ไฟล์ Excel จาก Spin the Movie
- HTML ของข้อมูลในภาพยนตร์ ... ดู Intel Haswell ด้วย CPU Diagram 4-CPU Chip Running Spin Benchmark
Intel Haswell พร้อมคอลเลกชันข้อมูลแผนภาพ CPU ใช้สำหรับชิป Intel 4-CPU, Linux OS, ไฟล์ HTML ที่มีเหตุการณ์ 50+ HW ผ่านการสุ่มตัวอย่าง PERF และข้อมูลอื่น ๆ ที่รวบรวม คุณสมบัติ CPU_DIAGRAM:
- เริ่มต้นด้วยแผนภาพบล็อก SVG จาก wikichip.org (ใช้โดยได้รับอนุญาต)
- ดูข้อ จำกัด ของทรัพยากร (เช่น Max BW, Max Bytes/Cycle บนเส้นทางต่าง ๆ รอบขั้นต่ำ/UOP ฯลฯ )
- คำนวณตัวชี้วัดสำหรับการใช้ทรัพยากร
- ด้านล่างนี้เป็นตารางการทดสอบแบนด์วิดท์การอ่านหน่วยความจำซึ่งแสดงข้อมูลการใช้ทรัพยากรในตาราง (พร้อมกับการประมาณว่า CPU นั้นหยุดชะงักหรือไม่เนื่องจากการใช้งาน) ตาราง HTML (แต่ไม่ใช่ PNG) มีข้อมูลป๊อปอัพเมื่อคุณโฮเวอร์เหนือฟิลด์ ตารางแสดงให้เห็นว่า:
- แกนถูกหยุดลงบนแบนด์วิดท์หน่วยความจำที่ 55% ของค่าสูงสุด 25.9 GB/s BW เป็นการทดสอบหน่วยความจำ BW
- Superqueue (SQ) เต็ม (54.5% สำหรับ Core0 และ 62.3% core1) ของรอบ (ดังนั้นจึงไม่สามารถจัดการคำขอ L2 ได้มากขึ้น)
- เส้นบัฟเฟอร์เติมเส้น FB เต็ม (30% และ 51%) ดังนั้นบรรทัดจึงไม่สามารถย้ายไปยัง L1D จาก L2 ได้
- ผลที่ได้คือแบ็กเอนด์ถูกหยุด (88% และ 87%) ของวัฏจักรที่ไม่มี UOPS เกษียณ
- ดูเหมือนว่า UOPS จะมาจากเครื่องตรวจจับกระแสลูป (เนื่องจาก LSD Cycles/UOP นั้นใกล้เคียงกับหนู UOPS/รอบ
- ภาพหน้าจอของตารางหน่วยความจำ BW Haswell CPU Memory BW
- ด้านล่างนี้เป็นตารางการทดสอบแบนด์วิดท์ L3 อ่าน
- ตอนนี้หน่วยความจำ BW และ L3 Miss Bytes/Cycle ประมาณศูนย์
- SQ นั้นหยุดชะงักน้อยกว่า (เนื่องจากเราไม่ได้รอหน่วยความจำ)
- L2 ธุรกรรมไบต์/รอบสูงกว่า 2 เท่าและประมาณ 67% ของสูงสุด 64 ไบต์/รอบ
- UOPS_Retired_stalls/รอบลดลงเหลือ 66% จากแผงทดสอบ MEM BW 88%
- แผงขายบัฟเฟอร์เติมสูงกว่า 2 เท่า UOPS ยังคงมาจาก LSD
- ภาพหน้าจอของตาราง Haswell CPU L3 BW ตาราง
- ด้านล่างนี้เป็นตารางการทดสอบแบนด์วิดท์อ่าน L2
- L2 พลาดไบต์/วัฏจักรต่ำกว่าการทดสอบ L3 มาก
- UOPS_retired% จนตรอกอยู่ประมาณครึ่งหนึ่งของการทดสอบ L3 ที่ 34% และแผงลอย FB อยู่ที่ประมาณ 17% เช่นกัน
- UOPS ยังคงมาจาก LSD
- ภาพหน้าจอของตาราง Haswell CPU L2 BW Table
- ด้านล่างนี้เป็นตารางการทดสอบสปิน (ไม่มีโหลดเพียงเพิ่มในลูป)
- ตอนนี้มีแผงขายของหน่วยความจำประมาณศูนย์
- UOPS มาจาก Decode Stream Buffer (DSB)
- Rat retired_uops/รอบที่ 3.31 รอบ/UOP อยู่ใกล้กับสูงสุด 4.0 UOPS/รอบ
- หนู Retired_uops %หยุดชะงักค่อนข้างต่ำที่ %8
- ภาพหน้าจอของตารางสปินไดอะแกรมของ Haswell CPU
ขณะนี้ฉันมีภาพยนตร์ CPU_DIAGRAM สำหรับ Haswell และ ARM A53 เท่านั้น (เนื่องจากฉันไม่มีระบบอื่นที่จะทดสอบ) แต่ไม่ควรเพิ่มไดอะแกรมบล็อกอื่น ๆ คุณยังคงได้รับแผนภูมิทั้งหมด แต่ไม่ใช่ CPU_DIAGRAM
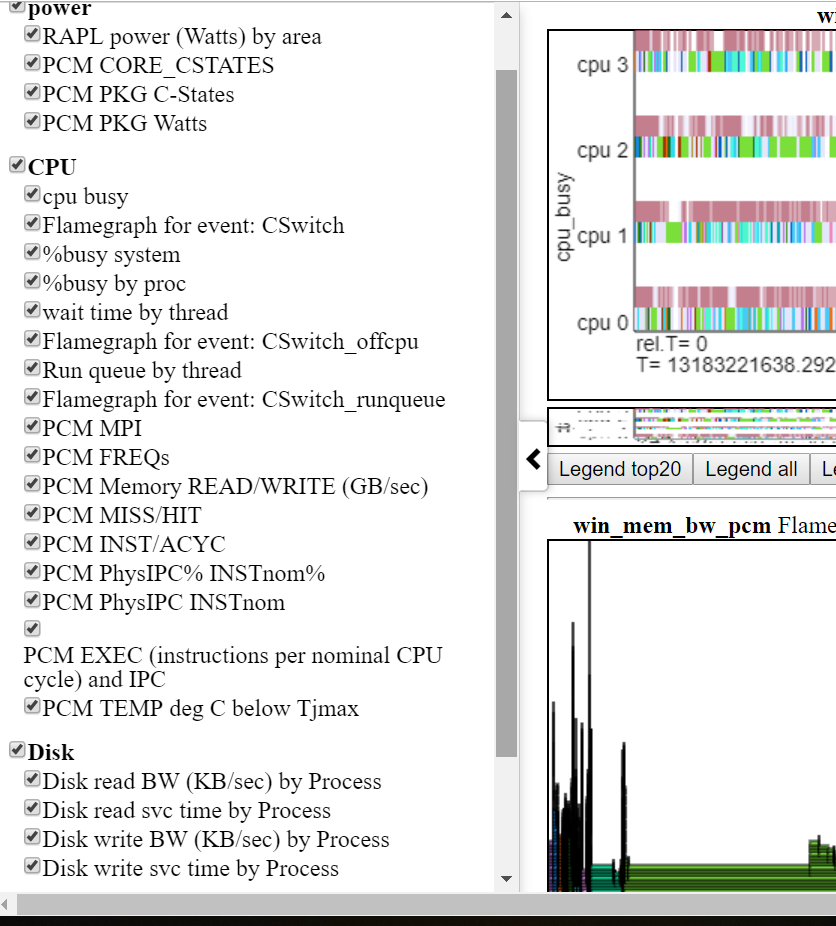
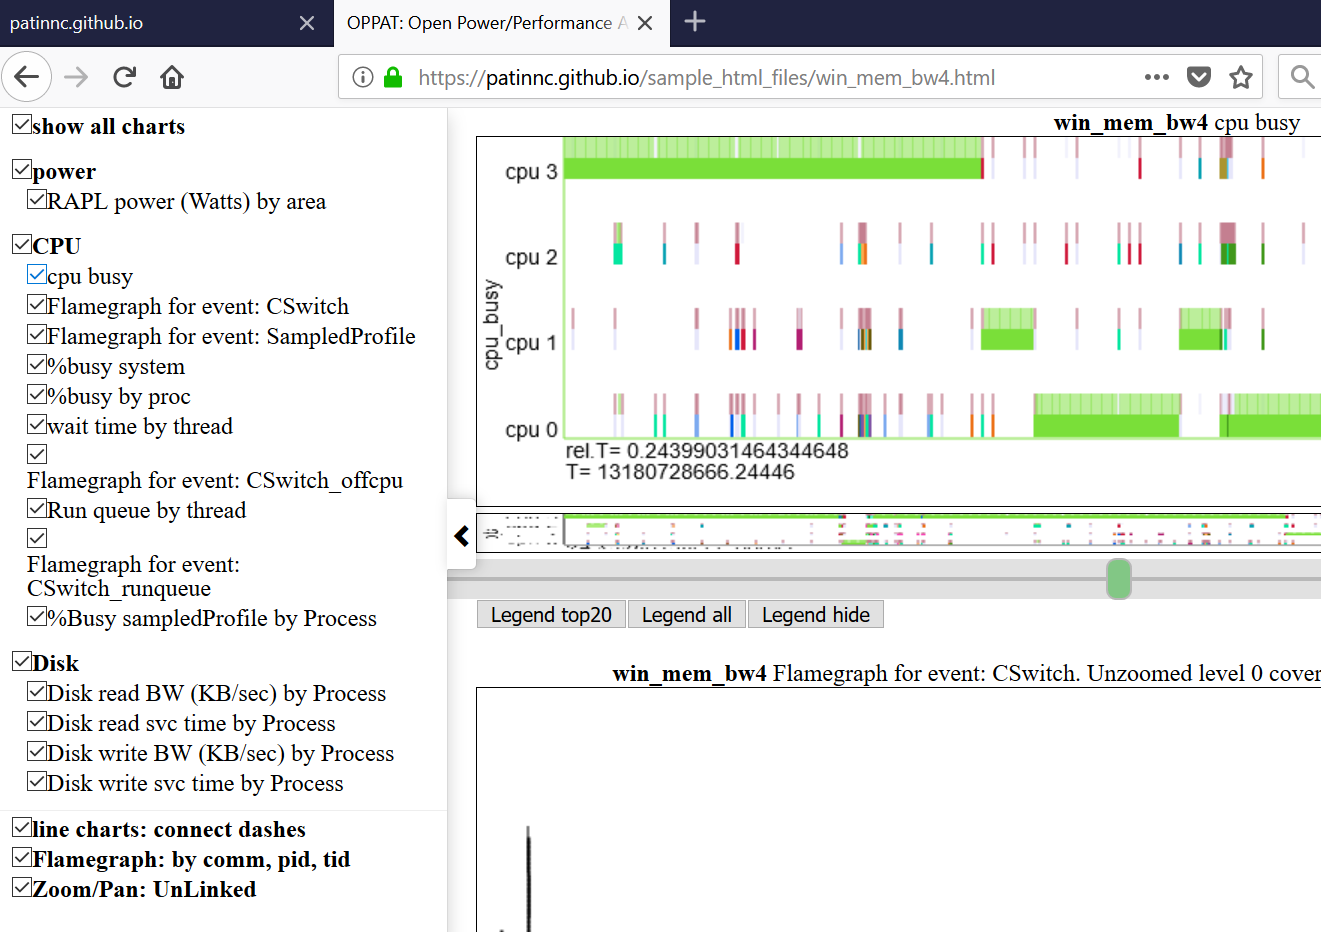
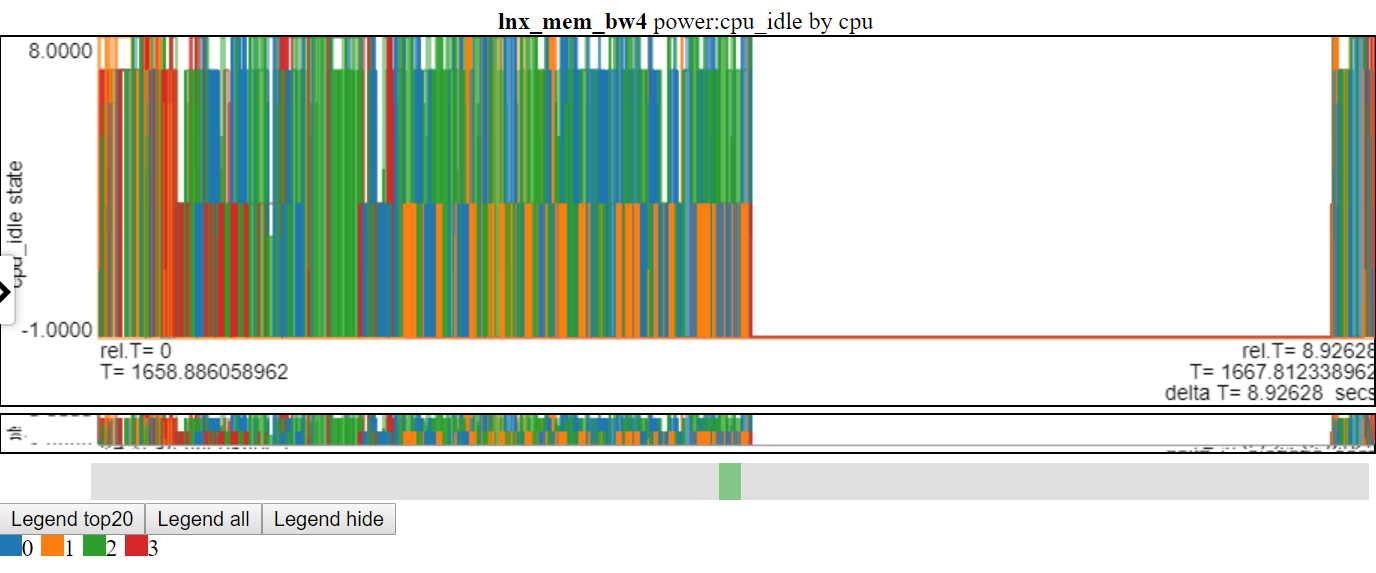
ด้านล่างเป็นหนึ่งในชาร์ต Oppat แผนภูมิ 'CPU_BUSY' แสดงสิ่งที่ทำงานบน CPU แต่ละตัวและเหตุการณ์ที่เกิดขึ้นใน CPU แต่ละตัว ตัวอย่างเช่นวงกลมสีเขียวแสดงเธรด spin.x ที่ทำงานบน CPU 1 วงกลมสีแดงแสดงเหตุการณ์บางอย่างที่เกิดขึ้นบน CPU1 แผนภูมินี้ถูกสร้างแบบจำลองตามแผนภูมิเคอร์เนลของ Trace-CMD ข้อมูลเพิ่มเติมเกี่ยวกับแผนภูมิ CPU_BUSY อยู่ในส่วนแผนภูมิ กล่องเอกสารแสดงข้อมูลเหตุการณ์ (รวมถึง callstack (ถ้ามี)) สำหรับเหตุการณ์ภายใต้เคอร์เซอร์ น่าเสียดายที่ภาพหน้าจอ Windows ไม่ได้จับเคอร์เซอร์ 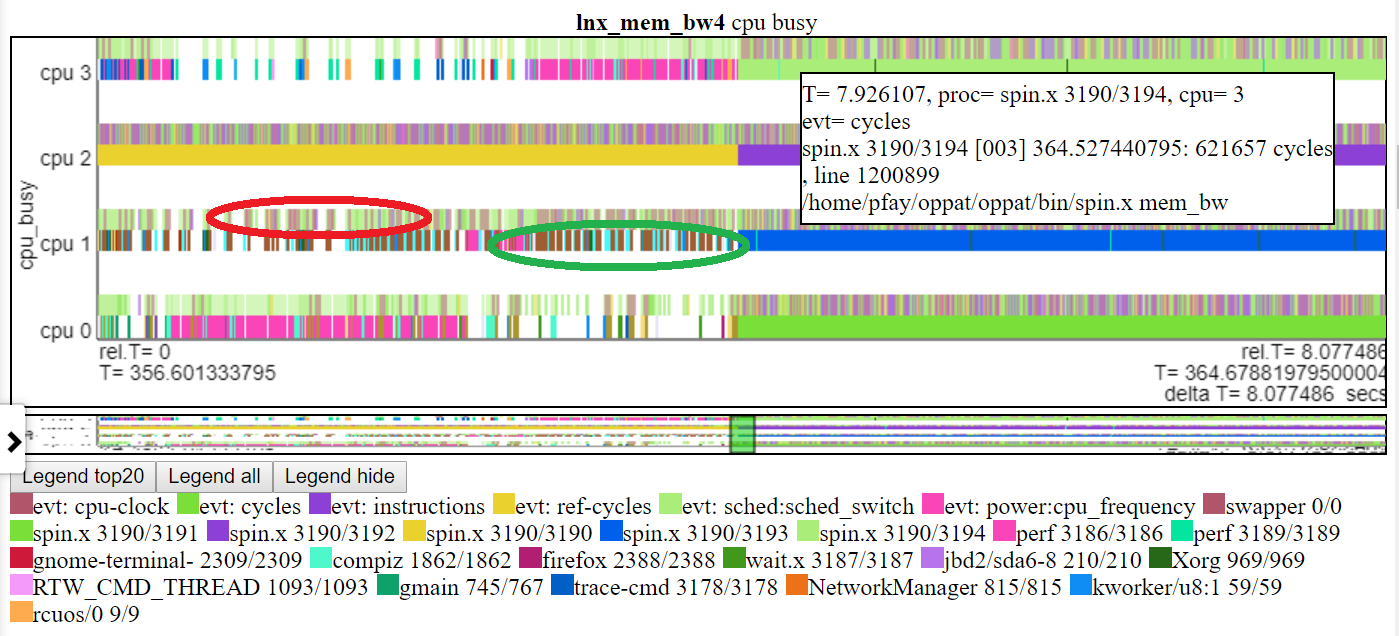
นี่คือไฟล์ตัวอย่าง HTML ไฟล์ส่วนใหญ่เป็นช่วงเวลาที่สั้นกว่า ~ 2 แต่บางไฟล์ 'เต็ม' 8 วินาทีทำงาน ไฟล์จะไม่โหลดโดยตรงจาก repo แต่จะโหลดจากหน้าเว็บโครงการ: https://patinnc.github.io
- Intel Haswell พร้อม CPU Diagram 4-CPU ชิป, Linux OS, ไฟล์ HTML ที่มีเหตุการณ์ 50+ HW ผ่านการสุ่มตัวอย่าง PERF หรือ
- ชิป Intel 4-CPU, Windows OS, ไฟล์ HTML พร้อมเหตุการณ์ 1 HW ผ่านการสุ่มตัวอย่าง Xperf หรือ
- เต็ม ~ 8 วินาทีชิป Intel 4-CPU, Windows OS, ไฟล์ HTML พร้อมการสุ่มตัวอย่าง PCM และ XPerf หรือ
- ชิป Intel 4-CPU, Linux OS, ไฟล์ HTML พร้อมเหตุการณ์ 10 HW ใน 2 กลุ่มมัลติเพล็กซ์
- ARM (Broadcom A53) ชิป, ไฟล์ Raspberry Pi3 Linux HTML พร้อมเหตุการณ์ 14 HW (สำหรับ CPI, L2 Misses, Mem BW ฯลฯ ใน 2 กลุ่มมัลติเพล็กซ์)
- 11 MB, ชิปรุ่นเต็ม (Broadcom A53) ชิป, ไฟล์ Raspberry Pi3 Linux HTML พร้อมเหตุการณ์ 14 HW (สำหรับ CPI, L2 Misses, Mem BW ฯลฯ ใน 2 กลุ่มมัลติเพล็กซ์)
บางไฟล์ข้างต้นเป็นช่วงเวลา ~ 2 วินาทีที่สกัดจากการวิ่งระยะยาว ~ 8 วินาที นี่คือการวิ่ง 8 วินาทีเต็ม:
- ตัวอย่าง Linux Run Full Linux Full Full HTML ที่นี่สำหรับไฟล์ที่สมบูรณ์ยิ่งขึ้น ไฟล์ทำ javascript zlib disompress ของข้อมูลแผนภูมิดังนั้นคุณจะเห็นข้อความที่ขอให้คุณรอ (ประมาณ 20 วินาที) ในระหว่างการคลาย
รองรับข้อมูล OPPAT
- ไฟล์ประสิทธิภาพ Linux Perf และ/หรือ Trace-CMD (ทั้งไฟล์ไบนารีและไฟล์ข้อความ)
- เอาท์พุทสถิติสมบูรณ์ยังได้รับการยอมรับ
- ข้อมูล Intel PCM
- ข้อมูลอื่น ๆ (นำเข้าโดยใช้สคริปต์ LUA)
- ดังนั้นสิ่งนี้ควรทำงานกับข้อมูลจาก Linux ปกติหรือ Android
- ขณะนี้สำหรับข้อมูล PERF และ Trace-CMD, Oppat ต้องการทั้งไฟล์ข้อความไบนารีและโพสต์ที่ผ่านการประมวลผลและมีข้อ จำกัด บางประการเกี่ยวกับบรรทัดคำสั่ง 'บันทึก' และบรรทัดคำสั่ง 'Perf Script/Trace-CMD'
- OPPAT สามารถทำได้เพียงแค่ใช้ไฟล์เอาต์พุตข้อความ PERF/Trace-CMD แต่ปัจจุบันต้องใช้ไฟล์ไบนารีและไฟล์ข้อความในปัจจุบัน
- ข้อมูล Windows ETW (รวบรวมโดย Xperf และทิ้งข้อความ) หรือข้อมูล Intel PCM
- ข้อมูลพลังงานหรือประสิทธิภาพโดยพลการที่รองรับโดยใช้สคริปต์ LUA (ดังนั้นคุณไม่จำเป็นต้องคอมไพล์รหัส C ++ เพื่อนำเข้าข้อมูลอื่น (เว้นแต่ประสิทธิภาพของ LUA จะกลายเป็นปัญหา)))
- อ่านไฟล์ข้อมูลบน Linux หรือ Windows โดยไม่คำนึงถึงตำแหน่งที่เกิดขึ้น (ดังนั้นอ่านไฟล์ Perf/Trace-CMD บนไฟล์ข้อความ Windows หรือ ETW บน Linux)
การสร้างภาพข้อมูล
นี่คือตัวอย่างไฟล์ HTML แบบ Visualzation แบบเต็มตัวอย่าง: Windows ตัวอย่างไฟล์ HTML หรือไฟล์ HTML ตัวอย่าง Linux นี้ หากคุณอยู่ใน repo (ไม่ใช่เว็บไซต์โครงการ github.io) คุณจะต้องดาวน์โหลดไฟล์แล้วโหลดลงในเบราว์เซอร์ของคุณ นี่คือไฟล์เว็บแบบสแตนด์อโลนที่สร้างขึ้นโดย Oppat ซึ่งอาจเป็นอีเมลที่ส่งไปยังผู้อื่นหรือ (ตามที่นี่) โพสต์บนเว็บเซิร์ฟเวอร์
Oppat Viz ทำงานได้ดีกว่าในโครเมี่ยมมากกว่า Firefox เป็นหลักเนื่องจากการซูมโดยใช้ทัชแพด 2 นิ้วเลื่อนใช้งานได้ดีกว่าในโครเมี่ยม
Oppat มี 3 โหมดการสร้างภาพข้อมูล:
- กลไกแผนภูมิปกติ (ที่แบ็กเอนด์ Oppat อ่านไฟล์ข้อมูลและส่งข้อมูลไปยังเบราว์เซอร์)
- นอกจากนี้คุณยังสามารถสร้างหน้าเว็บแบบสแตนด์อโลนซึ่งเทียบเท่ากับ 'กลไกแผนภูมิปกติ' แต่สามารถแลกเปลี่ยนกับผู้ใช้รายอื่นได้ ... เว็บเพจแบบสแตนด์อโลนมีสคริปต์และข้อมูลทั้งหมดในตัว ดูไฟล์ HTML ใน sample_html_files ที่อ้างอิงด้านบนและ (สำหรับเวอร์ชันยาวของ lnx_mem_bw4) ดูไฟล์ที่บีบอัดตัวอย่าง sample_html_files/lnx_mem_bw4_full.html
- คุณสามารถ '-ประหยัด' ไฟล์ข้อมูล JSON แล้วโหลดไฟล์ในภายหลัง ไฟล์ JSON ที่บันทึกไว้คือข้อมูลที่ Oppat จำเป็นต้องส่งไปยังเบราว์เซอร์ สิ่งนี้จะหลีกเลี่ยงการอ่านไฟล์อินพุต PERF/XPERF อีกครั้ง แต่จะไม่รับการเปลี่ยนแปลงใด ๆ ที่เกิดขึ้นในชาร์ต json ไฟล์ HTML เต็มรูปแบบที่สร้างขึ้นด้วยตัวเลือก -WEB_FILE นั้นใหญ่กว่าไฟล์ -SAVE เพียงเล็กน้อยเท่านั้น -โหมด------โหมดโหลดต้องการการสร้าง oppat ดูตัวอย่างไฟล์ 'บันทึก' ใน sample_data_json_files subdir
ข้อมูลทั่วไป ได้แก่
- จัดทำแผนภูมิข้อมูลทั้งหมดในเบราว์เซอร์ (บน Linux หรือ Windows)
- ชาร์ตถูกกำหนดไว้ในไฟล์ JSON เพื่อให้คุณสามารถเพิ่มเหตุการณ์และแผนภูมิโดยไม่ต้องคอมไพล์ใหม่
- อินเตอร์เฟสเบราว์เซอร์เป็นเหมือน Windows WPA (Navbar ทางซ้าย)
- ด้านล่างแสดง Navbar ด้านซ้าย (เมนูเลื่อนด้านซ้าย)
- แผนภูมิถูกจัดกลุ่มตามหมวดหมู่ (GPU, CPU, Power, ฯลฯ )
- หมวดหมู่ถูกกำหนดและกำหนดใน input_files/charts.json
- แผนภูมิสามารถซ่อนหรือแสดงได้ทั้งหมดโดยคลิกที่แผนภูมิใน Navbar
- วางเมาส์เหนือชื่อแผนภูมิในเมนูนาวิก
- ข้อมูลจากกลุ่มไฟล์หนึ่งไฟล์สามารถพล็อตได้กับกลุ่มที่แตกต่างกัน
- ดังนั้นคุณสามารถพูดได้เปรียบเทียบประสิทธิภาพของ Linux Perf กับ Windows ETW Run
- ด้านล่างแผนภูมิแสดง Linux กับการใช้งาน Windows Power:
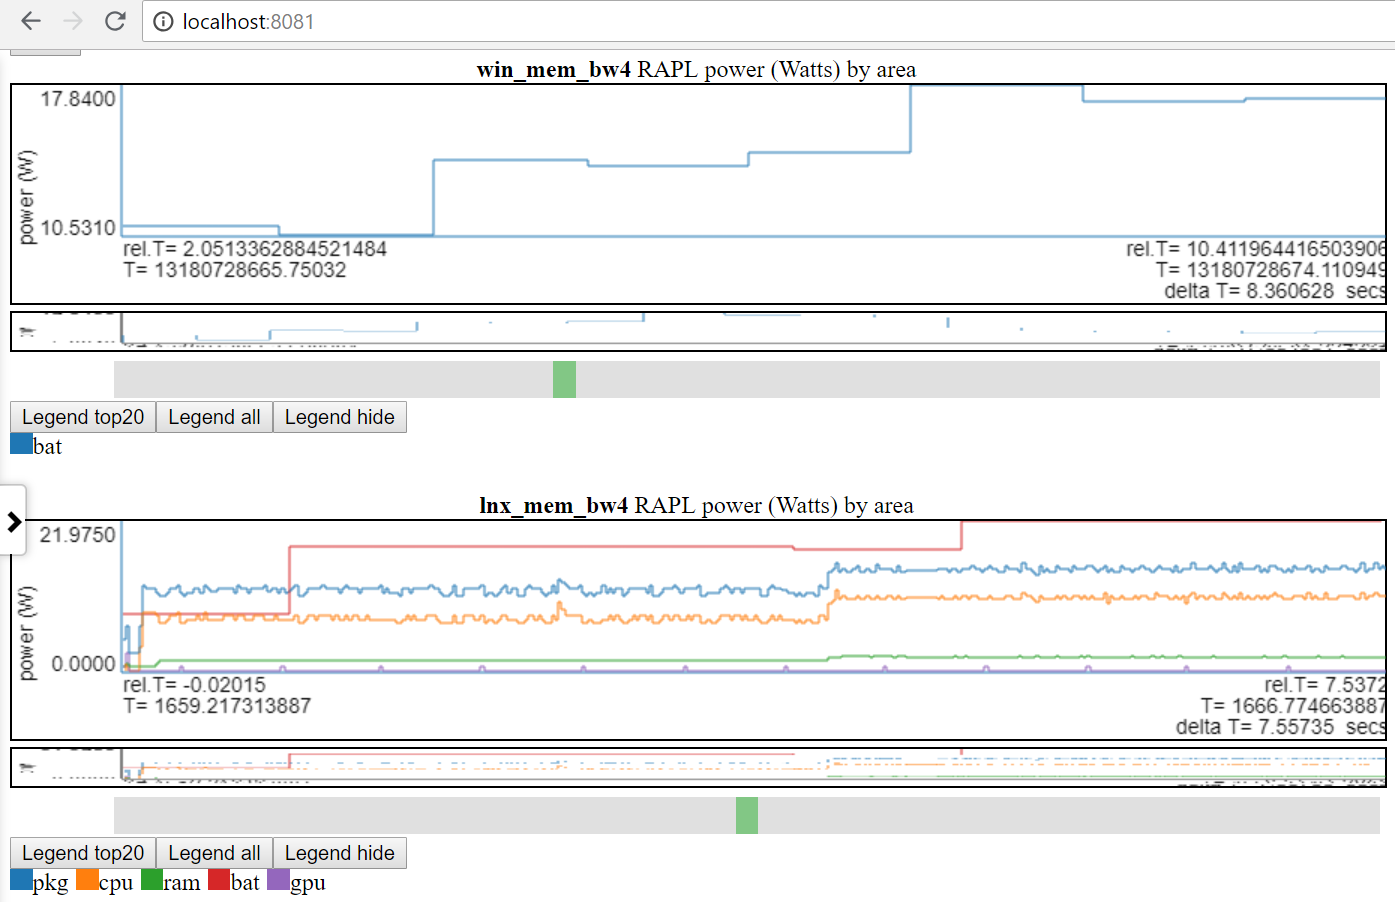
- ฉันสามารถเข้าถึงพลังงานแบตเตอรี่บน Linux และ Windows เท่านั้น
- หลายไซต์มีข้อมูลพลังงานที่ดีกว่ามาก (แรงดันไฟฟ้า/กระแส/พลังงานที่อัตรา MSEC (หรือดีกว่า)) มันจะง่ายที่จะรวมข้อมูลพลังงานประเภทนี้ (เช่นจาก Kratos หรือ Qualcomm MDPs) แต่ฉันไม่สามารถเข้าถึงข้อมูลได้
- หรือเปรียบเทียบการรันที่แตกต่างกัน 2 แบบบนแพลตฟอร์มเดียวกัน
- แท็กกลุ่มไฟล์ (file_tag) ถูกนำหน้าไปยังชื่อเรื่องเพื่อแยกความแตกต่างของแผนภูมิ
- A 'TAG' ถูกกำหนดไว้ในไฟล์ file_list.json ของข้อมูล DIR และ/หรือ input_files/input_data_files.json
- input_files/input_data_files.json เป็นรายการของข้อมูล OPPAT ทั้งหมด (แต่ผู้ใช้ต้องดูแลรักษาไว้)
- แผนภูมิที่มีชื่อเดียวกันจะถูกพล็อตหนึ่งหลังจากอื่น ๆ เพื่อให้สามารถเปรียบเทียบได้ง่าย
คุณสมบัติแผนภูมิ:
การโฉบเหนือส่วนของเส้นของแผนภูมิแสดงจุดข้อมูลสำหรับบรรทัดนั้น ณ จุดนั้น
- สิ่งนี้ใช้ไม่ได้สำหรับเส้นแนวตั้งเนื่องจากพวกเขากำลังเชื่อมต่อ 2 คะแนน ... เฉพาะชิ้นส่วนแนวนอนของแต่ละบรรทัดเท่านั้นที่ค้นหาค่าข้อมูล
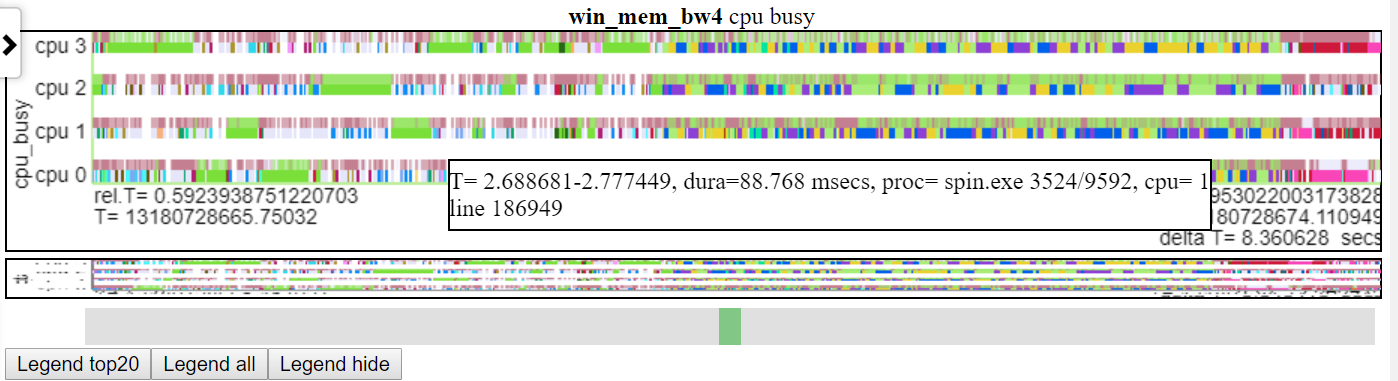
- ด้านล่างเป็นภาพหน้าจอของการโฉบเหนือเหตุการณ์ สิ่งนี้แสดงเวลาสัมพัทธ์ของเหตุการณ์ (CSWTICH) ข้อมูลบางอย่างเช่นกระบวนการ/PID/TID และหมายเลขบรรทัดในไฟล์ข้อความเพื่อให้คุณได้รับข้อมูลเพิ่มเติม
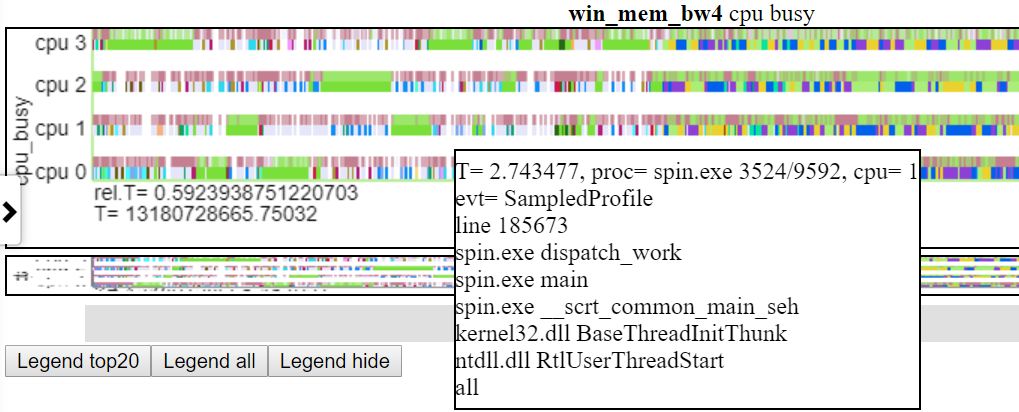
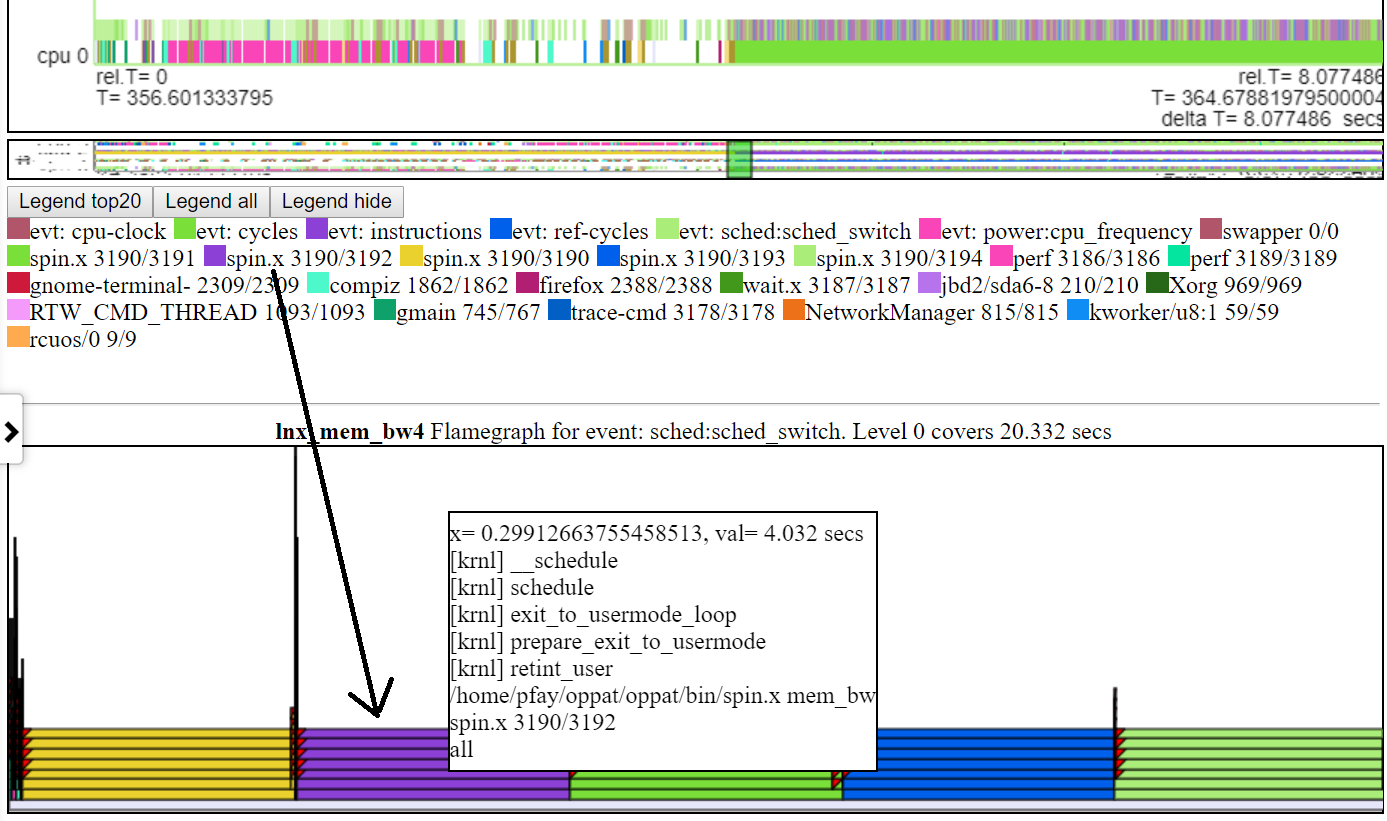
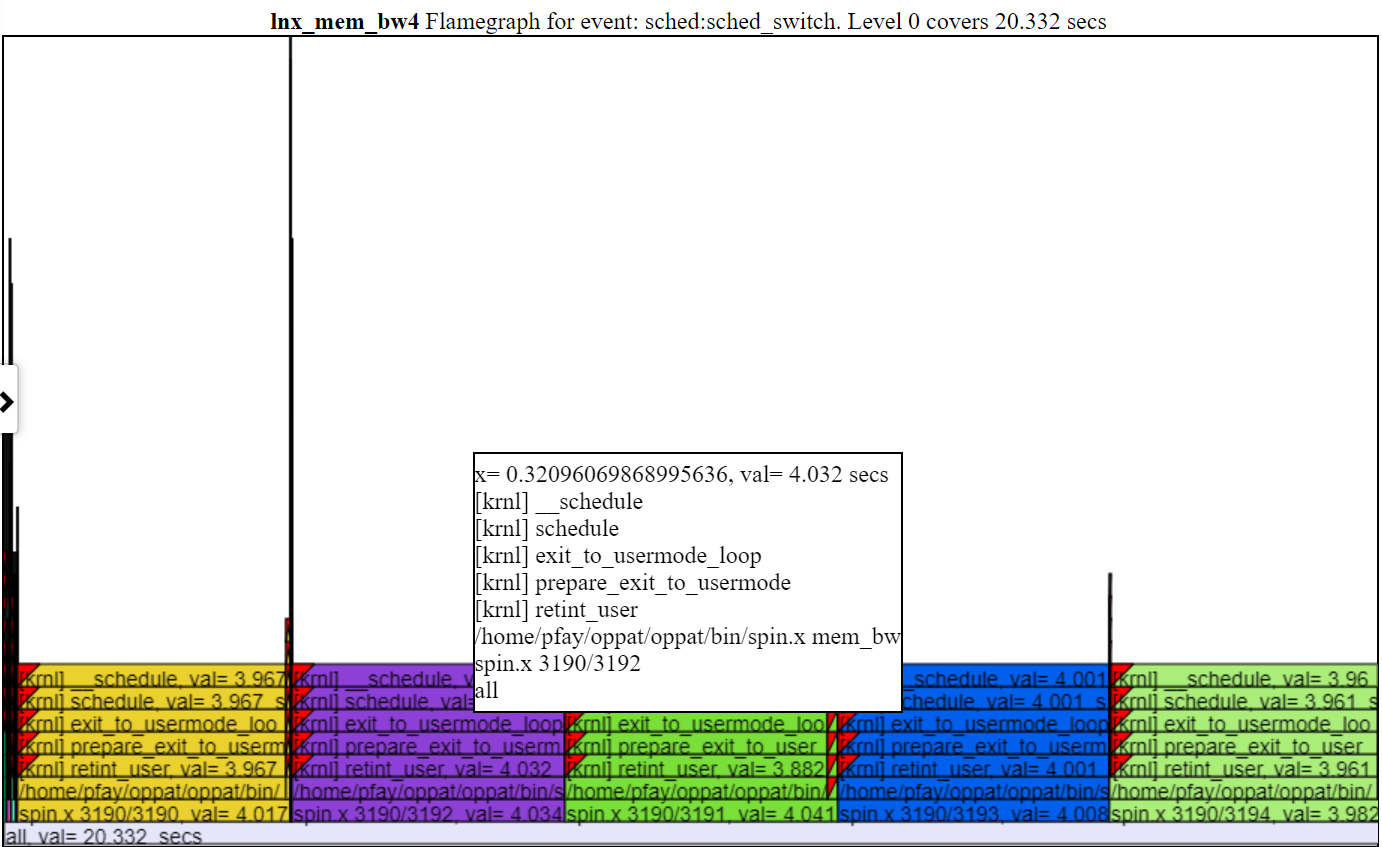
- ด้านล่างเป็นภาพหน้าจอที่แสดงข้อมูล CallStack (ถ้ามี) สำหรับกิจกรรม
การซูม
- ไม่ จำกัด การซูมเข้าสู่ระดับนาโนและซูมกลับ
- อาจมีคำสั่งของขนาดคะแนนมากกว่าการพล็อตมากกว่าพิกเซลดังนั้นข้อมูลเพิ่มเติมจะปรากฏขึ้นเมื่อคุณซูมเข้า
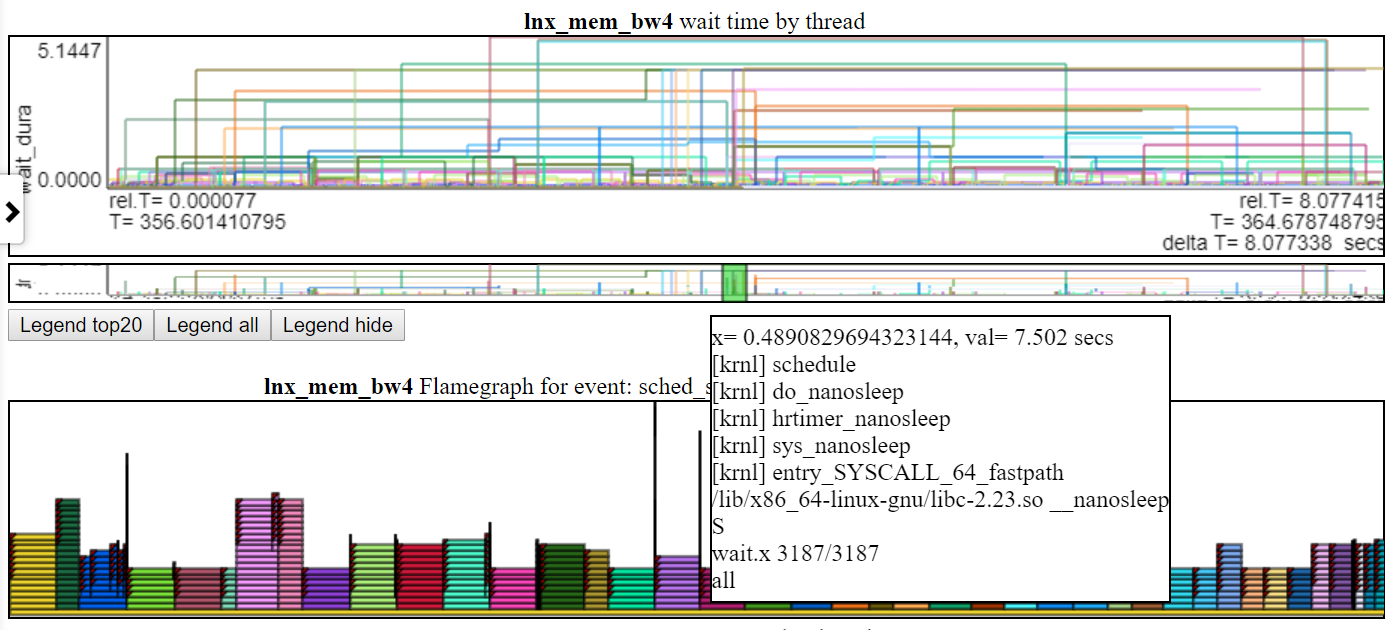
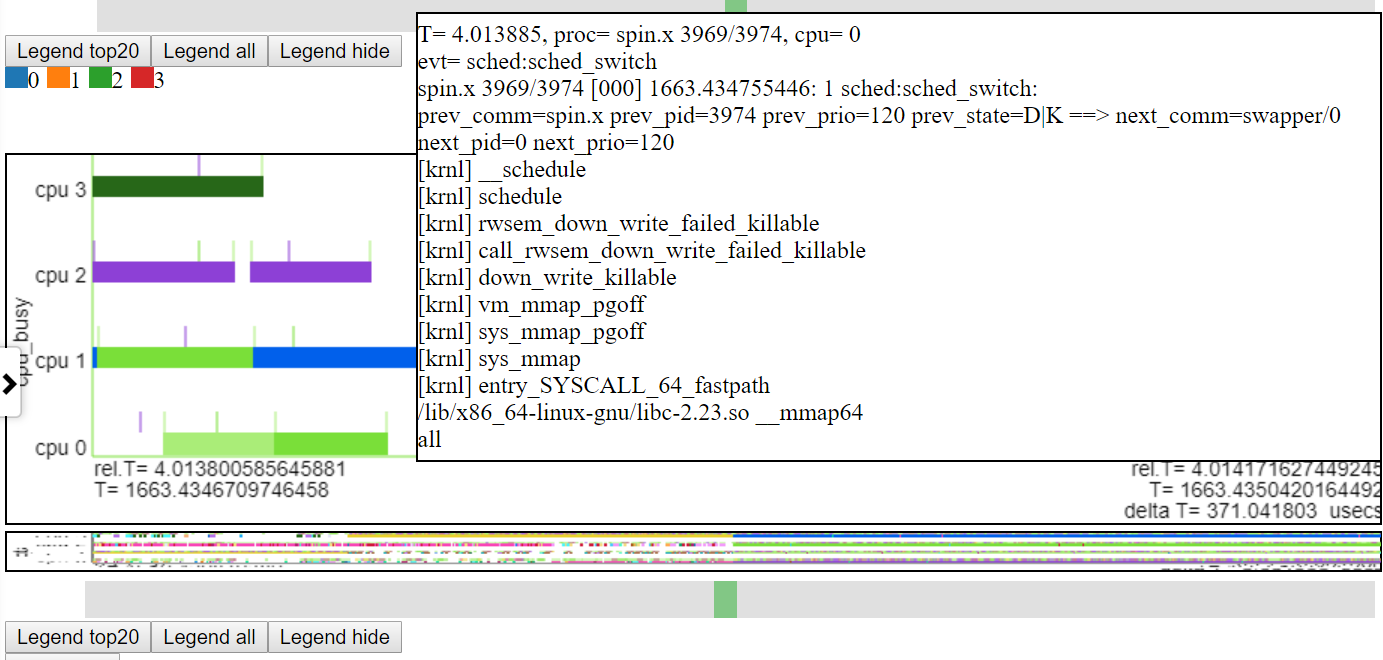
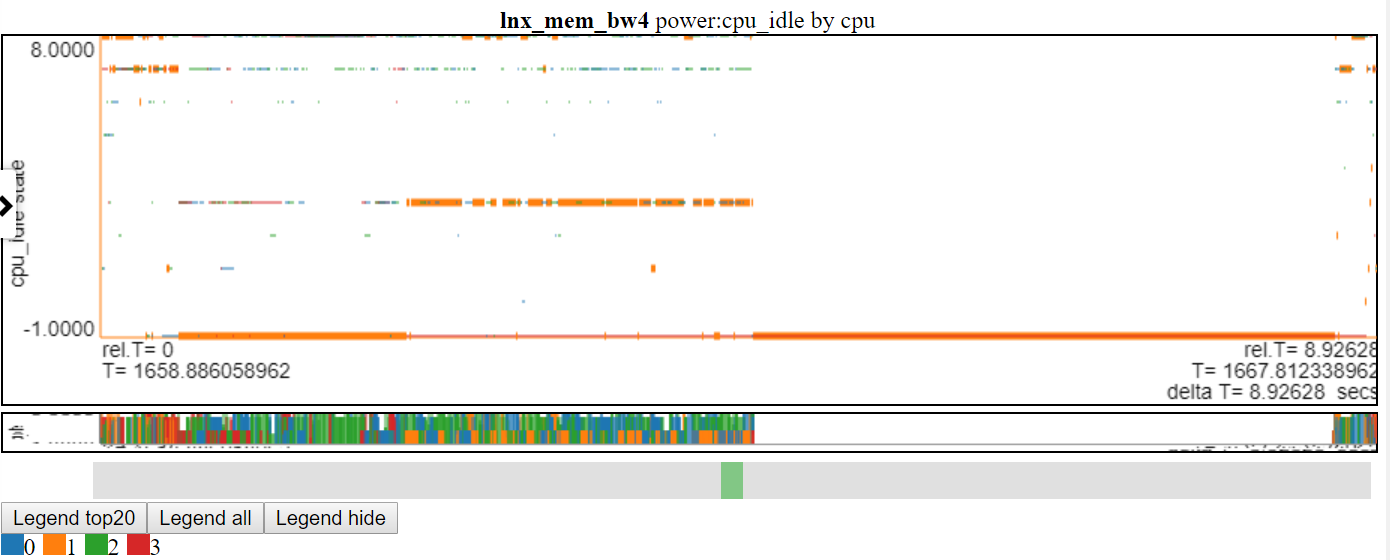
- ด้านล่างเป็นภาพหน้าจอที่แสดงการซูมไปยังระดับไมโครวินาที สิ่งนี้แสดงเหตุการณ์ callstack สำหรับเหตุการณ์ sched_switch ที่ spin.x ถูกบล็อกโดยการดำเนินการแมปหน่วยความจำและไปไม่ได้ใช้งาน แผนภูมิ 'CPU ไม่ว่าง' แสดง 'ไปไม่ได้ใช้งาน' ว่างเปล่า
 -
-
- แผนภูมิสามารถซูมแยกกันหรือชาร์ตที่มีไฟล์เดียวกันสามารถเชื่อมโยงได้
- เลื่อนไปที่ด้านล่างของ Navbar ด้านซ้ายแล้วคลิกที่ 'Zoom/Pan: Unlinked' สิ่งนี้จะเปลี่ยนรายการเมนูเป็น 'ซูม/แพน: เชื่อมโยง' สิ่งนี้จะซูม/แพนชาร์ตทั้งหมดในกลุ่มไฟล์ไปยังเวลาซูม/แพนที่แน่นอนที่สุด สิ่งนี้จะใช้เวลาสักครู่ในการวาดแผนภูมิทั้งหมด
- เริ่มแรกแผนภูมิแต่ละแผนจะแสดงข้อมูลทั้งหมดที่มีอยู่ หากแผนภูมิของคุณมาจากแหล่งที่แตกต่างกัน T_BEGIN และ T_END (สำหรับแผนภูมิจากแหล่งต่าง ๆ ) อาจแตกต่างกัน
- เมื่อการดำเนินการซูม/แพนเสร็จสิ้นทั้งหมดและการเชื่อมโยงมีผลบังคับใช้แผนภูมิทั้งหมดในกลุ่มไฟล์จะซูม/แพนไปยังช่วงเวลาที่แน่นอนเดียวกัน
- นี่คือเหตุผลที่ 'นาฬิกา' ที่ใช้สำหรับแต่ละแหล่งจะต้องเหมือนกัน
- Oppat สามารถแปลจากนาฬิกาหนึ่งไปยังอีกนาฬิกาหนึ่ง (เช่นระหว่าง getTime (clock_monotonic) และ gettimeofday ()) แต่ตรรกะนั้น
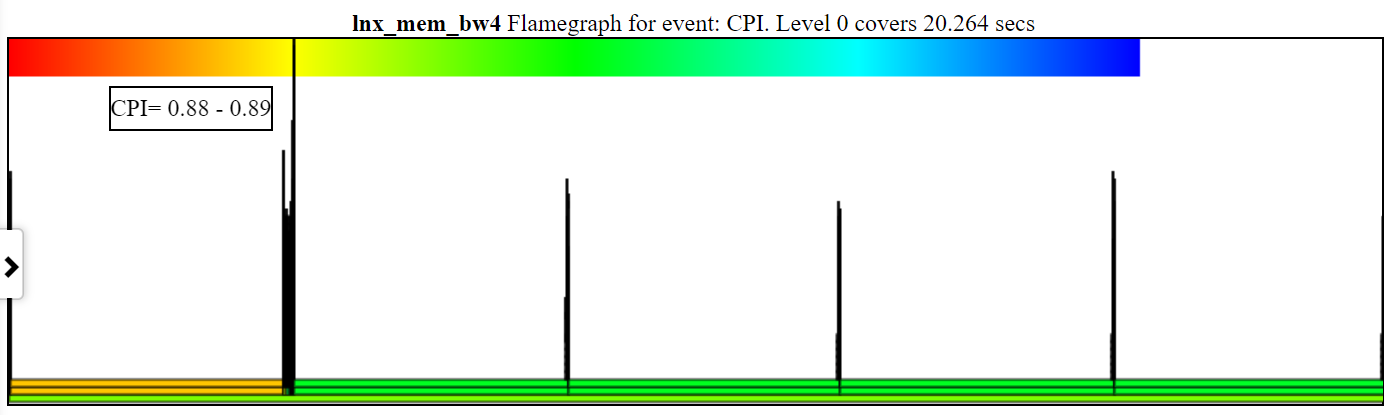
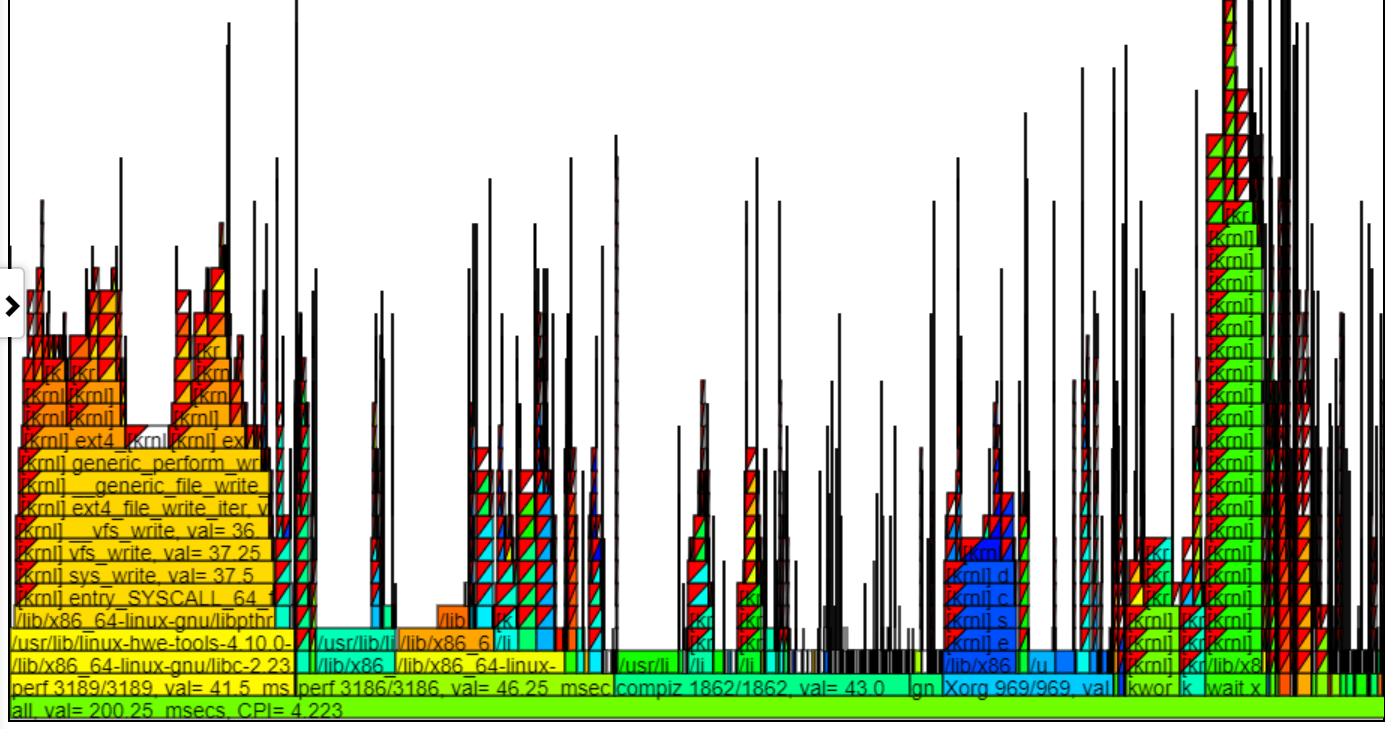
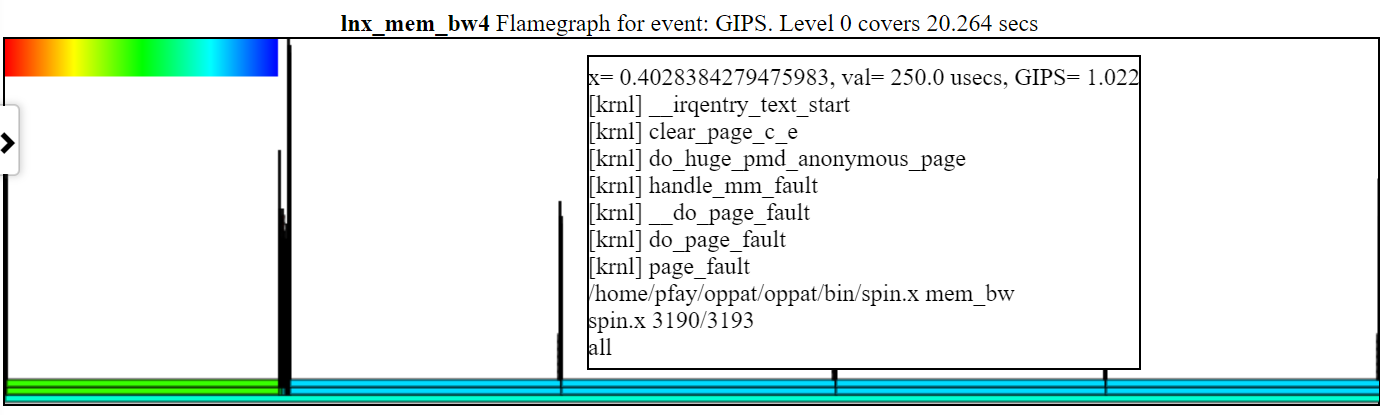
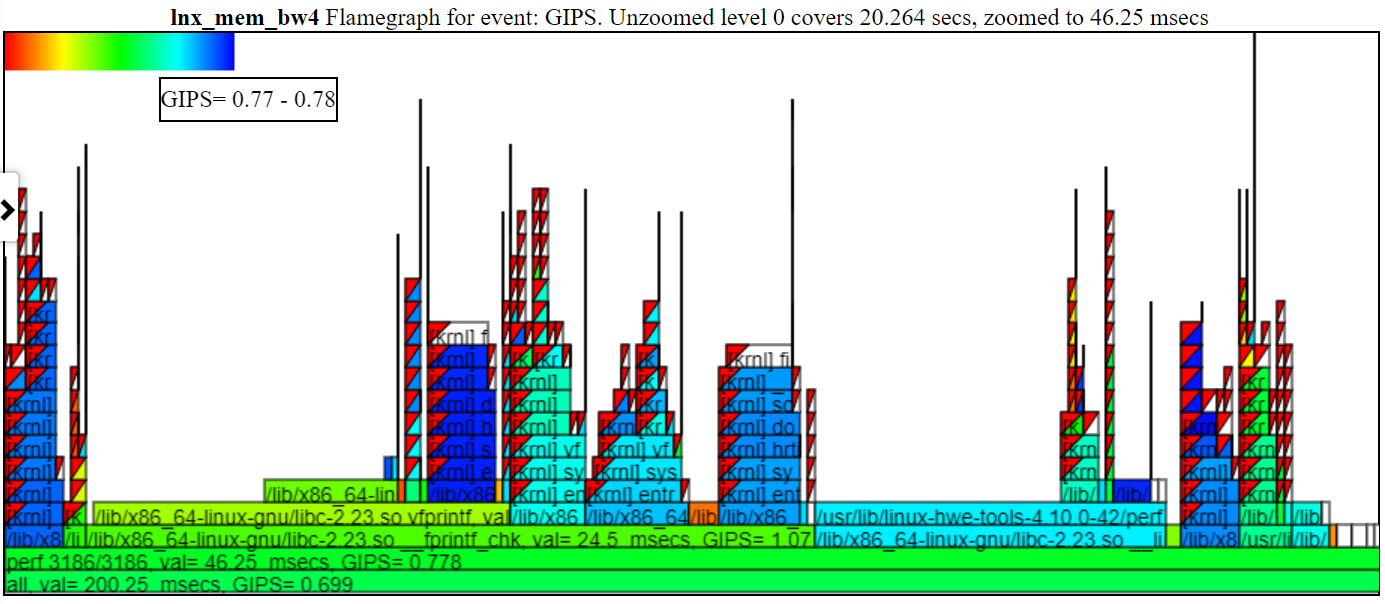
- flamegraphs ใด ๆ สำหรับช่วงเวลามักจะถูกซูมไปยังช่วงเวลา 'การเป็นเจ้าของแผนภูมิ' โดยไม่คำนึงถึงสถานะการเชื่อมโยง
- คุณสามารถซูมเข้า/ออกโดย:
- ซูมเข้า: ล้อเมาส์ในแนวตั้งในพื้นที่แผนภูมิ แผนภูมิซูมในเวลาที่อยู่ตรงกลางของแผนภูมิ
- บนแล็ปท็อปของฉันนี่คือการเลื่อน 2 นิ้วในแนวตั้งบนทัชแพด
- ซูมเข้า: คลิกที่แผนภูมิและลากเมาส์ไปทางขวาและปล่อยเมาส์ (แผนภูมิจะซูมไปยังช่วงเวลาที่เลือก)
- Zoom Out: คลิกที่แผนภูมิและลากเมาส์ไปทางซ้ายและปล่อยเมาส์จะซูมออกตามสัดส่วนผกผันกับจำนวนแผนภูมิที่คุณเลือก นั่นคือถ้าคุณออกจากการลากเกือบพื้นที่ชาร์ตทั้งหมดแผนภูมิจะซูมกลับ ~ 2x หากคุณเพิ่งออกจากการลากช่วงเวลาเล็ก ๆ แผนภูมิจะซูมออก ~ ตลอดทาง
- ซูมออก: บนแล็ปท็อปของฉันทำทัชแพด 2 นิ้วในแนวตั้งในทิศทางตรงกันข้ามของการซูม
- คุณต้องระวังว่าเคอร์เซอร์อยู่ที่ไหน ... คุณอาจซูมแผนภูมิโดยไม่ตั้งใจเมื่อคุณหมายถึงการเลื่อนรายการแผนภูมิ ดังนั้นฉันมักจะวางเคอร์เซอร์ที่ขอบด้านซ้ายของหน้าจอเมื่อฉันต้องการเลื่อนแผนภูมิ
การแพน
- บนแล็ปท็อปของฉันนี่กำลังทำ 2 นิ้วในการเคลื่อนไหวเลื่อนแนวนอนบนทัชแพด
- ใช้กล่องสีเขียวบนภาพขนาดย่อใต้แผนภูมิ
- การแพนทำงานในระดับซูมใด ๆ
- ภาพ 'ภาพขนาดย่อ' ของแผนภูมิเต็มจะถูกวางไว้ด้านล่างแต่ละชาร์ตพร้อมเคอร์เซอร์เพื่อเลื่อนไปตามรูปขนาดย่อเพื่อให้คุณสามารถนำทางไปรอบ ๆ แผนภูมิเมื่อคุณซูม/แพน
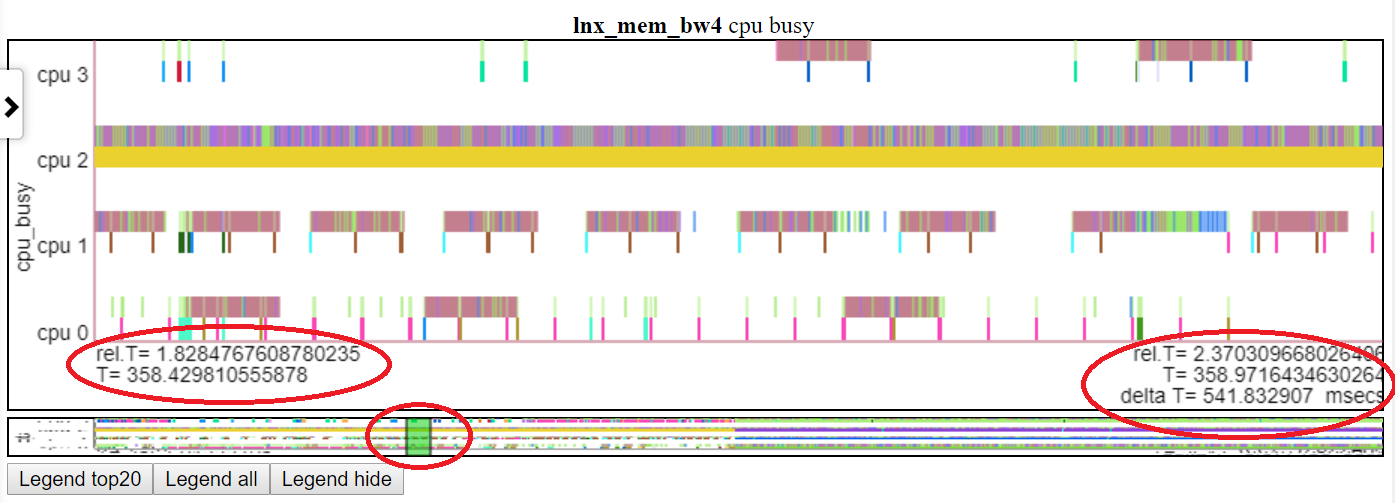
- ด้านล่างแสดงการแพนแผนภูมิ 'CPU ไม่ว่าง' เป็น t = 1.8-2.37 วินาที เวลาสัมพัทธ์และเวลาเริ่มต้นสัมบูรณ์จะสูงในรูปไข่สีแดงด้านซ้าย เวลาสิ้นสุดจะถูกเน้นในรูปไข่สีแดงด้านขวา ตำแหน่งสัมพัทธ์ของรูปขนาดย่อแสดงโดยรูปไข่สีแดงกลาง
 -
-
การโฉบในรายการตำนานแผนภูมิไฮไลต์บรรทัดนั้น
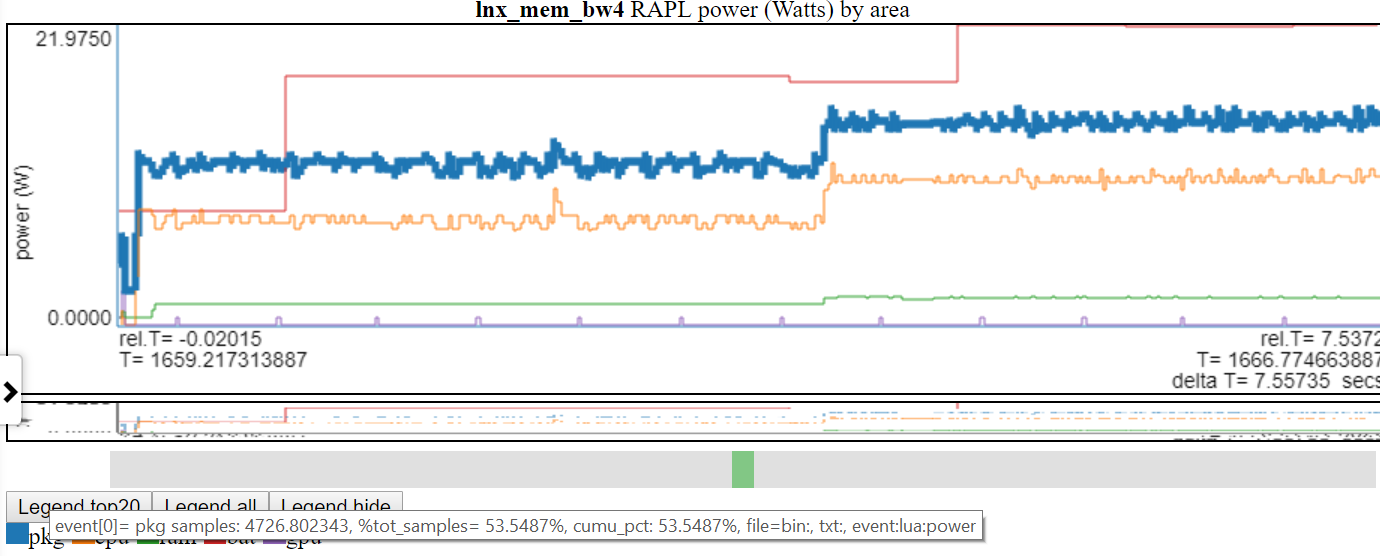
- ด้านล่างเป็นภาพหน้าจอที่ไฮไลต์พลังงาน 'PKG' (แพ็คเกจ)
คลิกที่รายการตำนานแผนภูมิสลับการมองเห็นของบรรทัดนั้น
ดับเบิลคลิกที่รายการตำนานทำให้เฉพาะรายการที่มองเห็นได้/ซ่อน
- ด้านล่างนี้เป็นภาพหน้าจอที่กำลัง 'PKG' ถูกคลิกสองครั้งดังนั้นจะมองเห็นเฉพาะบรรทัด PKG เท่านั้น
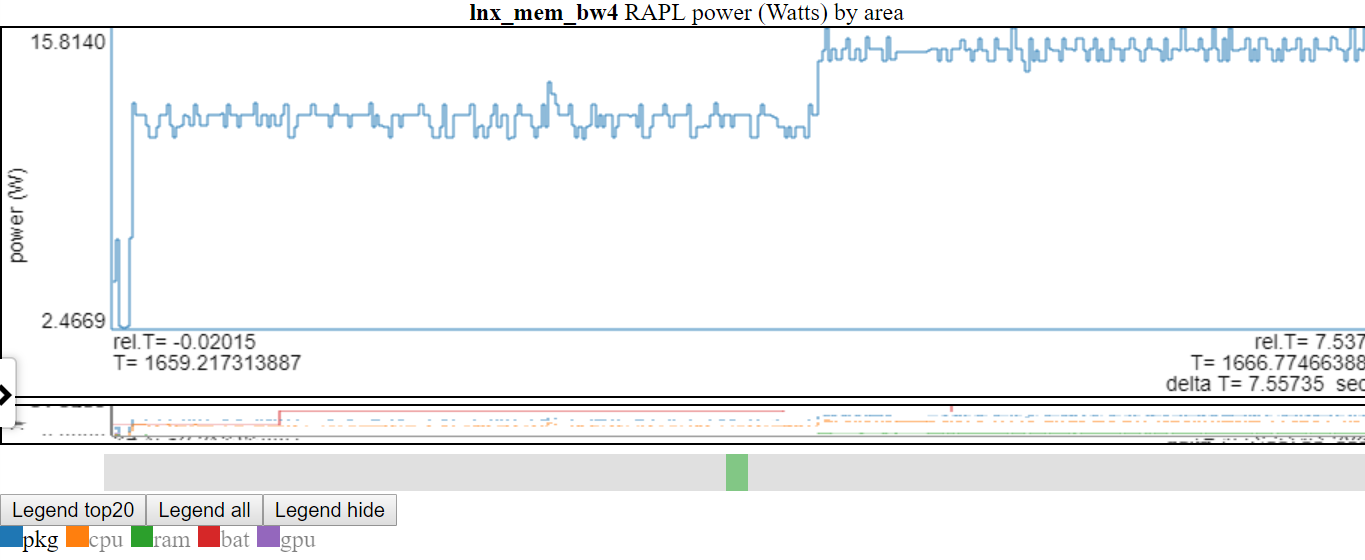
- ด้านบนแสดงให้เห็นว่าแกน y ถูกปรับเป็นขั้นต่ำ/สูงสุดของตัวแปรที่แสดง บรรทัด 'ไม่แสดง' จะถูกกำหนดออกไปในตำนาน หากคุณโฮเวอร์เหนือบรรทัด 'ไม่แสดง' ในตำนานมันจะถูกวาด (ในขณะที่คุณกำลังโฉบในรายการตำนาน) คุณสามารถรับรายการทั้งหมดที่จะแสดงอีกครั้งโดยคลิกสองครั้งที่รายการตำนาน 'ไม่ชุ่ม' สิ่งนี้จะแสดงบรรทัด 'ไม่แสดง' ทั้งหมด แต่มันจะสลับออกจากบรรทัดที่คุณเพิ่งคลิก ... ดังนั้นคลิกรายการเดียวที่คุณคลิกสองครั้ง ฉันรู้ว่ามันฟังดูสับสน
หากรายการในตำนานถูกซ่อนไว้และคุณโฮเวอร์เหนือมันมันจะปรากฏขึ้นจนกว่าคุณจะโฮเวอร์ออก
ประเภทแผนภูมิ:
การรวบรวมข้อมูลสำหรับ Oppat
การรวบรวมข้อมูลประสิทธิภาพและพลังงานเป็น 'สถานการณ์' มาก คนหนึ่งจะต้องการเรียกใช้สคริปต์อีกคนหนึ่งจะต้องเริ่มการวัดด้วยปุ่มจากนั้นเริ่มวิดีโอแล้วจบคอลเลกชันด้วยการกดปุ่ม ฉันมีสคริปต์สำหรับ Windows และสคริปต์สำหรับ Linux ซึ่งแสดงให้เห็น:
- เริ่มต้นการรวบรวมข้อมูล
- เรียกใช้เวิร์กโหลด
- หยุดการรวบรวมข้อมูล
- โพสต์ประมวลผลข้อมูล (การสร้างไฟล์ข้อความจากข้อมูลไบนารี PERF/XPERF/TRACE-CMD)
- วางไฟล์ข้อมูลทั้งหมดไว้ในเอาต์พุต DIR
- การสร้างไฟล์ file_list.json ในเอาต์พุต dir (ซึ่งบอกชื่อและประเภทของไฟล์เอาต์พุต)
ขั้นตอนสำหรับการรวบรวมข้อมูลโดยใช้สคริปต์:
- Build Spin.exe (spin.x) และ wait.exe (wait.x) ยูทิลิตี้
- จากรากของ oppat dir ทำ:
- บน linux:
./mk_spin.sh - บน windows:.
.mk_spin.bat (จากกล่อง Visual Studio CMD) - ไบนารีจะถูกใส่ใน./bin subdir
- เริ่มต้นด้วยการเรียกใช้สคริปต์ที่ให้ไว้:
- run_perf_x86_haswell.sh - สำหรับการรวบรวมข้อมูล haswell cpu_diagram
- บน linux, ประเภท:
sudo bash ./scripts/run_perf.sh - โดยค่าเริ่มต้นสคริปต์จะทำให้ข้อมูลเป็น dir ../oppat_data/lnx/mem_bw7
- run_perf.sh - คุณต้องมีการติดตาม CMD และ Perf ที่ติดตั้ง
- บน linux, ประเภท:
sudo bash ./scripts/run_perf.sh - โดยค่าเริ่มต้นสคริปต์จะทำให้ข้อมูลเป็น dir ../oppat_data/lnx/mem_bw4
- run_xperf.bat - คุณต้องติดตั้ง xperf.exe
- บน Windows จากกล่อง CMD ที่มีสิทธิ์ผู้ดูแลระบบพิมพ์:
.scriptsrun_xperf.sh - โดยค่าเริ่มต้นสคริปต์จะทำให้ข้อมูลเป็น dir .. oppat_data win mem_bw4
- แก้ไขสคริปต์เรียกใช้หากคุณต้องการเปลี่ยนค่าเริ่มต้น
- นอกเหนือจากไฟล์ข้อมูลแล้วสคริปต์รันจะสร้างไฟล์ file_list.json ในเอาต์พุต DIR Oppat ใช้ไฟล์ file_list.json เพื่อหาชื่อไฟล์และประเภทของไฟล์ในเอาต์พุต DIR
- 'เวิร์กโหลด' สำหรับสคริปต์การเรียกใช้คือ spin.x (หรือ spin.exe) ซึ่งทำการทดสอบแบนด์วิดท์หน่วยความจำใน 1 ซีพียูเป็นเวลา 4 วินาทีจากนั้นในซีพียูทั้งหมดเป็นเวลา 4 วินาที
- โปรแกรมอื่น wait.x/wait.exe เริ่มต้นในพื้นหลัง รอ. cpp อ่านข้อมูลแบตเตอรี่สำหรับแล็ปท็อปของฉัน มันใช้งานได้กับแล็ปท็อปบูตคู่ของฉัน Windows 10/Linux Ubuntu ไฟล์ SYSFS อาจมีชื่อที่แตกต่างกันใน Linux ของคุณและเกือบจะแตกต่างกันอย่างแน่นอนใน Android
- บน Linux คุณอาจสร้างไฟล์ prf_trace.data และ prf_trace.txt โดยใช้ไวยากรณ์เดียวกับที่อยู่ใน run_perf.sh แต่ฉันไม่ได้ลองใช้
- หากคุณใช้งานบนแล็ปท็อปและต้องการรับพลังงานแบตเตอรี่อย่าลืมถอดสายเคเบิลไฟก่อนที่จะเรียกใช้สคริปต์
รองรับข้อมูล PCM
- Oppat สามารถอ่านและจัดทำแผนภูมิไฟล์ PCM .CSV
- ด้านล่างเป็นภาพรวมของรายการแผนภูมิที่สร้างขึ้น
- น่าเสียดายที่คุณต้องทำแพตช์เป็น PCM เพื่อสร้างไฟล์ที่มีการประทับเวลาที่แน่นอนเพื่อให้ OPPAT ดำเนินการ
- นี่เป็นเพราะไฟล์ PCM CSV ไม่มีการประทับเวลาที่ฉันสามารถใช้เพื่อเชื่อมโยงกับแหล่งข้อมูลอื่น ๆ
- ฉันได้เพิ่มแพตช์ที่นี่ PCM Patch
อาคาร Oppat
- บน linux ให้
make ใน rot oppat root dir- หากทุกอย่างทำงานควรมีไฟล์ bin/oppat.x
- บน Windows คุณต้อง:
- ติดตั้ง GNU Make เวอร์ชัน Windows ดู http://gnuwin32.sourceforge.net/packages/make.htm หรือสำหรับไบนารีขั้นต่ำที่จำเป็นต้องใช้ http://gnuwin32.sourceforge.net/downlinks/make.php
- ใส่ไบนารี 'Make' ใหม่นี้ในเส้นทาง
- คุณต้องการคอมไพเลอร์ Visual Visual Studio 2015 หรือ 2017 C/C ++ (ฉันใช้ทั้ง VS 2015 Professional และ VS 2017 Community Compilers)
- เริ่มต้นกล่องพรอมต์ CMD Native Windows Visual Studio X64
- พิมพ์
make in the oppat root dir - หากทุกอย่างทำงานควรมีไฟล์ bin oppat.exe
- หากคุณกำลังเปลี่ยนซอร์สโค้ดคุณอาจต้องสร้างไฟล์การพึ่งพา
- คุณต้องติดตั้ง Perl
- บน Linux ใน rot dir dir:
./mk_depends.sh สิ่งนี้จะสร้างไฟล์การพึ่งพาอาศัยของ Inders_lnx.mk - on Windows, in the OPPAT root dir do:
.mk_depends.bat . This will create a depends_win.mk dependency file.
- If you are going to run the sample run_perf.sh or run_xperf.bat scripts, then you need to build the spin and wait utilities:
- On Linux:
./mk_spin.sh - On Windows:
.mk_spin.bat
Running OPPAT
- Run the data collection steps above
- now you have data files in a dir (if you ran the default run_* scripts:
- on Windows ..oppat_datawinmem_bw4
- on Linux ../oppat_data/lnx/mem_bw4
- You need to add the created files to the input_filesinput_data_files.json file:
- Starting OPPAT reads all the data files and starts the web server
- on Windows to generate the haswell cpu_diagram (assuming your data dir is ..oppat_datalnxmem_bw7)
binoppat.exe -r ..oppat_datalnxmem_bw7 --cpu_diagram webhaswell_block_diagram.svg > tmp.txt
- on Windows (assuming your data dir is ..oppat_datawinmem_bw4)
binoppat.exe -r ..oppat_datawinmem_bw4 > tmp.txt
- on Linux (assuming your data dir is ../oppat_data/lnx/mem_bw4)
bin/oppat.exe -r ../oppat_data/lnx/mem_bw4 > tmp.txt
bin/oppat.exe -r ../oppat_data/lnx/mem_bw4 --web_file tst2.html > tmp.txt
- Then you can load the file into the browser with the URL address:
file:///C:/some_path/oppat/tst2.html
Derived Events
'Derived events' are new events created from 1 or more events in a data file.
- Say you want to use the ETW Win32k InputDeviceRead events to track when the user is typing or moving the mouse.
- ETW has 2 events:
- Microsoft-Windows-Win32k/InputDeviceRead/win:Start
- Microsoft-Windows-Win32k/InputDeviceRead/win:Stop
- So with the 2 above events we know when the system started reading input and we know when it stopped reading input
- But OPPAT plots just 1 event per chart (usually... the cpu_busy chart is different)
- We need a new event that marks the end of the InputDeviceRead and the duration of the event
- The derived event needs:
- a new event name (in chart.json... see for example the InputDeviceRead event)
- a LUA file and routine in src_lua subdir
- 1 or more 'used events' from which the new event is derived
- the derived events have to be in the same file
- For the InputDeviceRead example, the 2 Win32k InputDeviceRead Start/Stop events above are used.
- The 'used events' are passed to the LUA file/routine (along with the column headers for the 'used events') as the events are encountered in the input trace file
- In the InputDeviceRead lua script:
- the script records the timestamp and process/pid/tid of a 'start' event
- when the script gets a matching 'Stop' event (matching on process/pid/tid), the script computes a duration for the new event and passes it back to OPPAT
- A 'trigger event' is defined in chart.json and if the current event is the 'trigger event' then (after calling the lua script) the new event is emitted with the new data field(s) from the lua script.
- An alternate to the 'trigger event' method is to have the lua script indicate whether or not it is time to write the new event. For instance, the scr_lua/prf_CPI.lua script writes a '1' to a variable named ' EMIT ' to indicate that the new CPI event should be written.
- The new event will have:
- the name (from the chart.json evt_name field)
- The data from the trigger event (except the event name and the new fields (appended)
- I have tested this on ETW data and for perf/trace-cmd data
Using the browser GUI Interface
TBD
Defining events and charts in charts.json
TBD
Rules for input_data_files.json
- The file 'input_files/input_data_files.json' can be used to maintain a big list of all the data directories you have created.
- You can then select the directory by just specifying the file_tag like:
- bin/oppat.x -u lnx_mem_bw4 > tmp.txt # assuming there is a file_tag 'lnx_mem_bw4' in the json file.
- The big json file requires you to copy the part of the data dir's file_list.json into input_data_files.json
- in the file_list.json file you will see lines like:
{ "cur_dir" : " %root_dir%/oppat_data/win/mem_bw4 " },
{ "cur_tag" : " win_mem_bw4 " },
{ "txt_file" : " etw_trace.txt " , "tag" : " %cur_tag% " , "type" : " ETW " },
{ "txt_file" : " etw_energy2.txt " , "wait_file" : " wait.txt " , "tag" : " %cur_tag% " , "type" : " LUA " }- don't copy the lines like below from the file_list.json file:
- paste the copied lines into input_data_files.json. Pay attention to where you paste the lines. If you are pasting the lines at the top of input_data_files.json (after the
{"root_dir":"/data/ppat/"}, then you need add a ',' after the last pasted line or else JSON will complain. - for Windows data files add an entry like below to the input_filesinput_data_files.json file:
- yes, use forward slashes:
{ "root_dir" : " /data/ppat/ " },
{ "cur_dir" : " %root_dir%/oppat_data/win/mem_bw4 " },
{ "cur_tag" : " win_mem_bw4 " },
{ "txt_file" : " etw_trace.txt " , "tag" : " %cur_tag% " , "type" : " ETW " },
{ "txt_file" : " etw_energy2.txt " , "wait_file" : " wait.txt " , "tag" : " %cur_tag% " , "type" : " LUA " }- for Linux data files add an entry like below to the input_filesinput_data_files.json file:
{ "root_dir" : " /data/ppat/ " },
{ "cur_dir" : " %root_dir%/oppat_data/lnx/mem_bw4 " },
{ "cur_tag" : " lnx_mem_bw4 " },
{ "bin_file" : " prf_energy.txt " , "txt_file" : " prf_energy2.txt " , "wait_file" : " wait.txt " , "tag" : " %cur_tag% " , "type" : " LUA " },
{ "bin_file" : " prf_trace.data " , "txt_file" : " prf_trace.txt " , "tag" : " %cur_tag% " , "type" : " PERF " },
{ "bin_file" : " tc_trace.dat " , "txt_file" : " tc_trace.txt " , "tag" : " %cur_tag% " , "type" : " TRACE_CMD " },- Unfortunately you have to pay attention to proper JSON syntax (such as trailing ','s)
- Here is an explanation of the fields:
- The 'root_dir' field only needs to entered once in the json file.
- It can be overridden on the oppat cmd line line with the
-r root_dir_path option - If you use the
-r root_dir_path option it is as if you had set "root_dir":"root_dir_path" in the json file - the 'root_dir' field has to be on a line by itself.
- The cur_dir field applies to all the files after the cur_dir line (until the next cur_dir line)
- the '%root_dir% string in the cur_dir field is replaced with the current value of 'root_dir'.
- the 'cur_dir' field has to be on a line by itself.
- the 'cur_tag' field is a text string used to group the files together. The cur_tag field will be used to replace the 'tag' field on each subsequent line.
- the 'cur_tag' field has to be on a line by itself.
- For now there are four types of data files indicated by the 'type' field:
- type:PERF These are Linux perf files. OPPAT currently requires both the binary data file (the bin_file field) created by the
perf record cmd and the perf script text file (the txt_file field). - type:TRACE_CMD These are Linux trace-cmd files. OPPAT currently requires both the binary dat file (the bin_file field) created by the
trace-cmd record cmd and the trace-cmd report text file (the txt_file field). - type:ETW These are Windows ETW xperf data files. OPPAT currently requires only the text file (I can't read the binary file). The txt_file is created with
xperf ... -a dumper command. - type:LUA These files are all text files which will be read by the src_lua/test_01.lua script and converted to OPPAT data.
- the 'prf_energy.txt' file is
perf stat output with Intel RAPL energy data and memory bandwidth data. - the 'prf_energy2.txt' file is created by the wait utility and contains battery usage data in the 'perf stat' format.
- the 'wait.txt' file is created by the wait utility and shows the timestamp when the wait utility began
- Unfortunately 'perf stat' doesn't report a high resolution timestamp for the 'perf stat' start time
ข้อ จำกัด
- The data is not reduced on the back-end so every event is sent to the browser... this can be a ton of data and overwhelm the browsers memory
- I probably should have some data reduction logic but I wanted to get feedback first
- You can clip the files to a time range:
oppat.exe -b abs_beg_time -e abs_beg_time to reduce the amout of data- This is a sort of crude mechanism right now. I just check the timestamp of the sample and discard it if the timestamp is outside the interval. If the sample has a duration it might actually have data for the selected interval...
- There are many cases where you want to see each event as opposed to averages of events.
- On my laptop (with 4 CPUs), running for 10 seconds of data collection runs fine.
- Servers with lots of CPUs or running for a long time will probably blow up OPPAT currently.
- The stacked chart can cause lots of data to be sent due to how it each event on one line is now stacked on every other line.
- Limited mechanism for a chart that needs more than 1 event on a chart...
- say for computing CPI (cycles per instruction).
- Or where you have one event that marks the 'start' of some action and another event that marks the 'end' of the action
- There is a 'derived events' logic that lets you create a new event from 1 or more other events
- See the derived event section
- The user has to supply or install the data collection software:
- on Windows xperf
- See https://docs.microsoft.com/en-us/windows-hardware/get-started/adk-install
- You don't need to install the whole ADK... the 'select the parts you want to install' will let you select just the performance tools
- on Linux perf and/or trace-cmd
sudo apt-get install linux-tools-common linux-tools-generic linux-tools- ` uname -r `
- For trace-cmd, see https://github.com/rostedt/trace-cmd
- You can do (AFAIK) everything in 'perf' as you can in 'trace-cmd' but I have found trace-cmd has little overhead... perhaps because trace-cmd only supports tracepoints whereas perf supports tracepoints, sampling, callstacks and more.
- Currently for perf and trace-cmd data, you have to give OPPAT both the binary data file and the post-processed text file.
- Having some of the data come from the binary file speeds things up and is more reliable.
- But I don't want to the symbol handling and I can't really do the post-processing of the binary data. Near as I can tell you have to be part of the kernel to do the post processing.
- OPPAT requires certain clocks and a certain syntax of 'convert to text' for perf and trace-cmd data.
- OPPAT requires clock_monotonic so that different file timestamps can be correlated.
- When converting the binary data to text (trace-cmd report or 'perf script') OPPAT needs the timestamp to be in nanoseconds.
- see scriptsrun_xperf.bat and scriptsrun_perf.sh for the required syntax
- given that there might be so many files to read (for example, run_perf.sh generates 7 input files), it is kind of a pain to add these files to the json file input_filesinput_data_files.json.
- the run_xperf.bat and run_perf.sh generate a file_list.json in the output directory.
- perf has so, so many options... I'm sure it is easy to generate some data which will break OPPAT
- The most obvious way to break OPPAT is to generate too much data (causing browser to run out of memory). I'll probably handle this case better later but for this release (v0.1.0), I just try to not generate too much data.
- For perf I've tested:
- sampling hardware events (like cycles, instructions, ref-cycles) and callstacks for same
- software events (cpu-clock) and callstacks for same
- tracepoints (sched_switch and a bunch of others) with/without callstacks
- Zooming Using touchpad scroll on Firefox seems to not work as well it works on Chrome
 -
- -
-