virHEAT
v.0.7.3

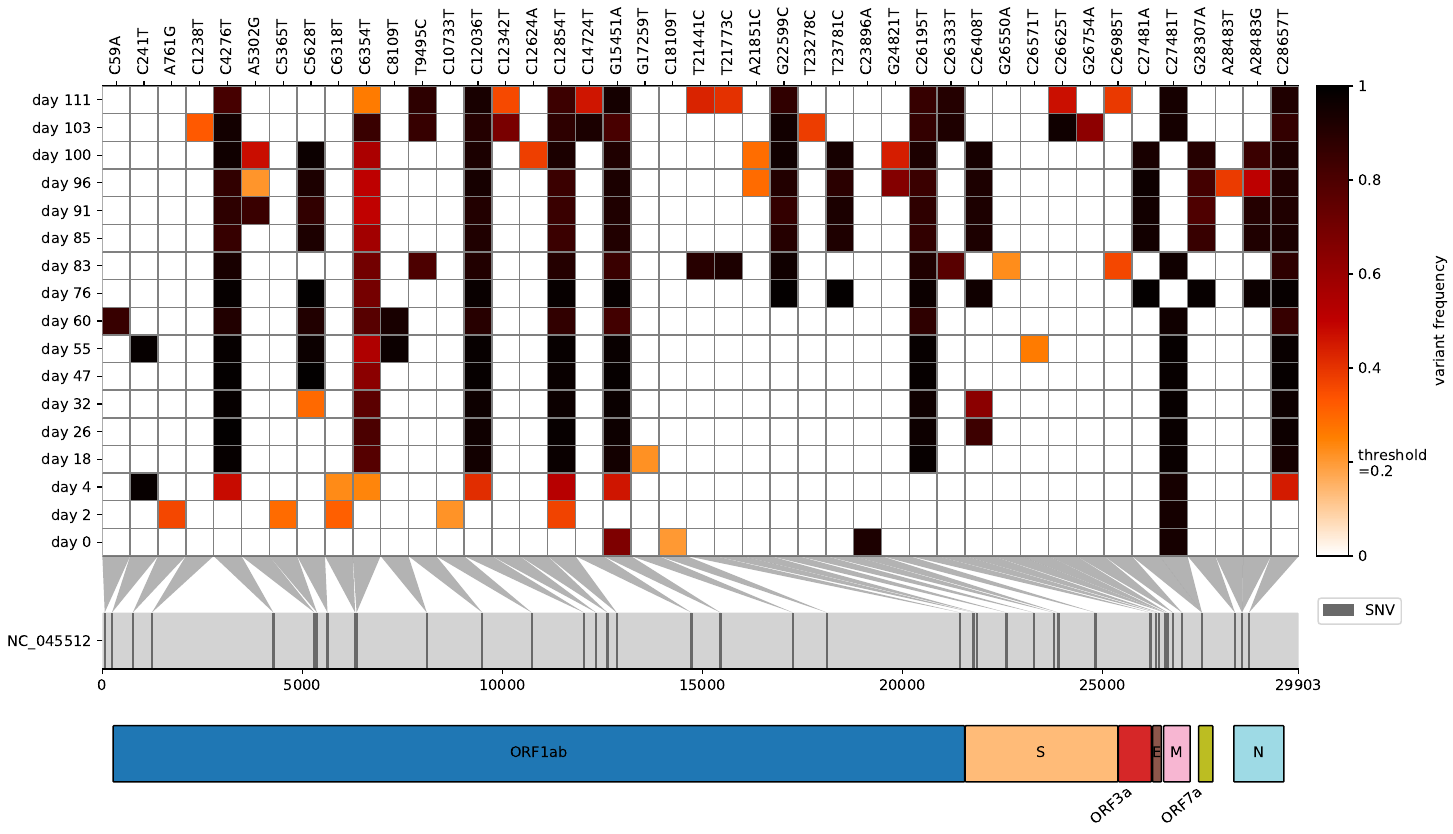
Virheat是將VCF視為熱圖和將突變的圖像可視化到各自基因的工具。
曾經想在將原始讀物映射到病毒/細菌參考基因組之後,對變體頻率進行凝結,並同時比較多個VCF文件?比Virheat適合您。您不僅可以看到熱圖,而且可以在GFF3文件中讀取,該文件使您可以顯示具有突變的基因。這個輕巧的腳本的靈感來自Snipit和我的變體頻率圖,獲得了兩者的最佳可視化功能。
--scores 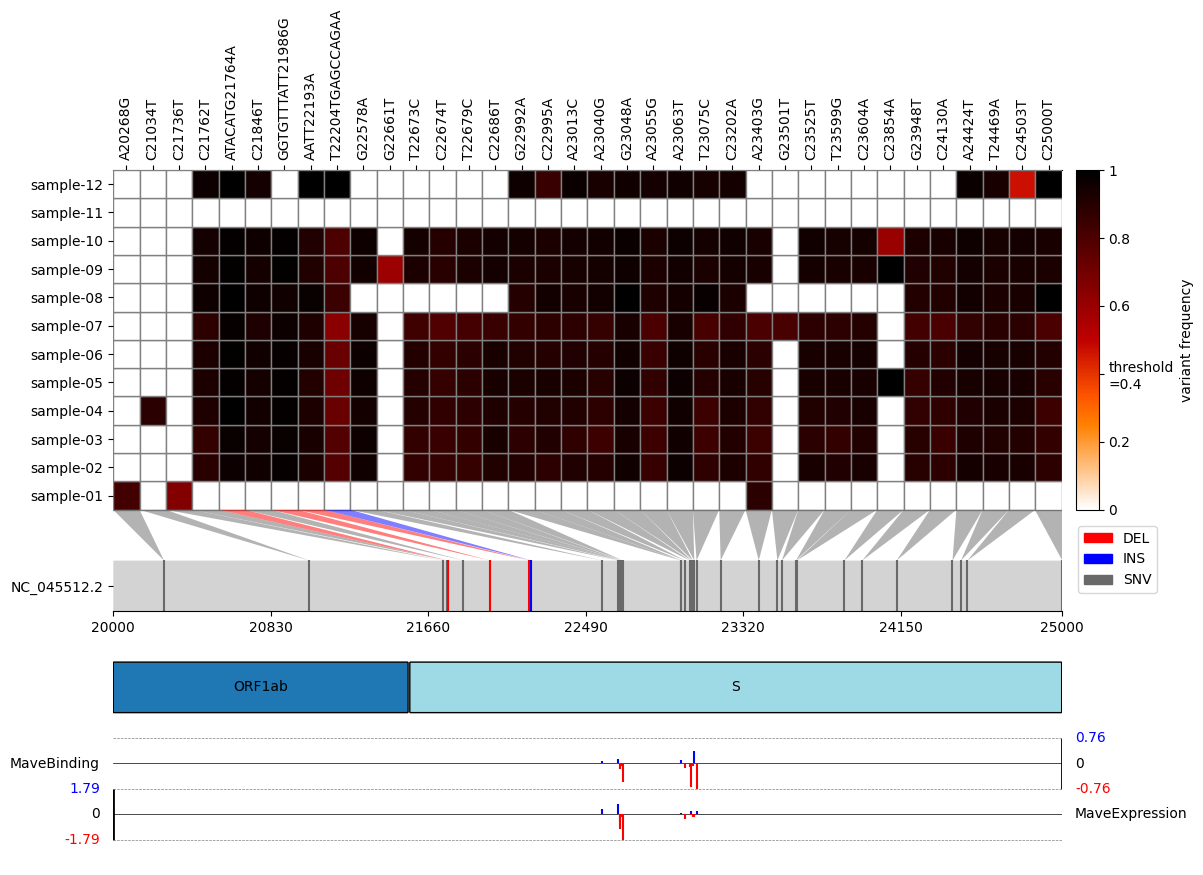
pip install virheatconda install -c bioconda virheatgit clone https://github.com/jonas-fuchs/virHEAT
cd virHEAT
pip install -r requirements.txt
# or
pip install .就是這樣。檢查是否有效:
virheat -v您應該看到當前的Virheat版本。
usage: virheat < folder containing vcfs > < output dir > -l or -g [additional arguments]
參數:
 positional arguments:
  input                 folder containing input files and output folder

options:
  -h, --help            show this help message and exit
  -r ref_id, --reference ref_id
                        reference identifier
  --name virHEAT_plot.pdf
                        plot name and file type (pdf, png, svg, jpg). Default: virHEAT_plot.pdf
  -l None, --genome-length None
                        length of the genome (needed if gff3 is not provided)
  -g None, --gff3-path None
                        path to gff3 (needed if length is not provided)
  -a [gene ...], --gff3-annotations [gene ...]
                        annotations to display from gff3 file (standard: gene). Multiple possible.
  --gene-arrows, --no-gene-arrows
                        show genes in arrow format (only if the -g argument is provided) (default: False)
  -t 0, --threshold 0   display frequencies above this threshold (0-1)
  --delete, --no-delete
                        delete mutations that are present in all samples and their maximum frequency divergence is smaller than 0.5 (default: True)
  -n None, --delete-n None
                        do not show mutations that occur n times or less (default: Do not delete)
  -z start stop, --zoom start stop
                        restrict the plot to a specific genomic region.
  --sort, --no-sort     sort sample names alphanumerically (default: False)
  --min-cov 20          display mutations covered at least x time (only if per base cov tsv files are provided)
  -s scores_file pos_col score_col score_name, --scores scores_file pos_col score_col score_name
                        specify scores to be added to the plot by providing a CSV file containing scores, along with its column for amino-acid positions, its column for scores, and descriptive score names (e.g., expression, binding, antibody escape, etc.).
                        This option can be used multiple times to include multiple sets of scores.
  -v, --version         show program's version number and exit
您需要提供參考基因組的長度,或者如果要獲取序列註釋,則需要提供GFF3文件。
此外,您還可以分析是否充分覆蓋突變並以灰色顯示未覆蓋的細胞。為此,首先使用QualiMap為每個BAM文件創建每個基本覆蓋範圍TSV文件,並將其與VCF文件相同的文件夾提供。給他們與VCF文件相同的名稱。
此外,還有一個選項可以包括額外分數的可視化(例如,結合親和力的MAVE分數,表達水平,抗體逃逸等)映射到熱圖上的突變。要使用此功能,請使用-s或-scores參數,並提供以下參數:1)包含分數的CSV文件的路徑; 2)該文件中包含經典符號中的突變位置的列的名稱(例如,T430Y); 3)該文件中包含分數本身的列的名稱; 4)描述性得分名稱將用作圖中的標籤。可以通過重複具有不同參數的-s或得分選項同時包含多個分數集。例如,輸入和可能的輸出數據,請參閱示例_data/example_mave_data文件夾中的文件。
重要免責聲明:該代碼屬於GPLV3許可證。該代碼沒有任何保修;即使沒有對特定目的的適銷性或適合性的隱含保證。該程序是免費的軟件:您可以根據自由軟件基金會發布的GNU通用公共許可證的條款對其進行重新分配和/或修改它,該版本是該許可證的版本3,或(按您的選項)任何以後的版本。


