virHEAT
v.0.7.3

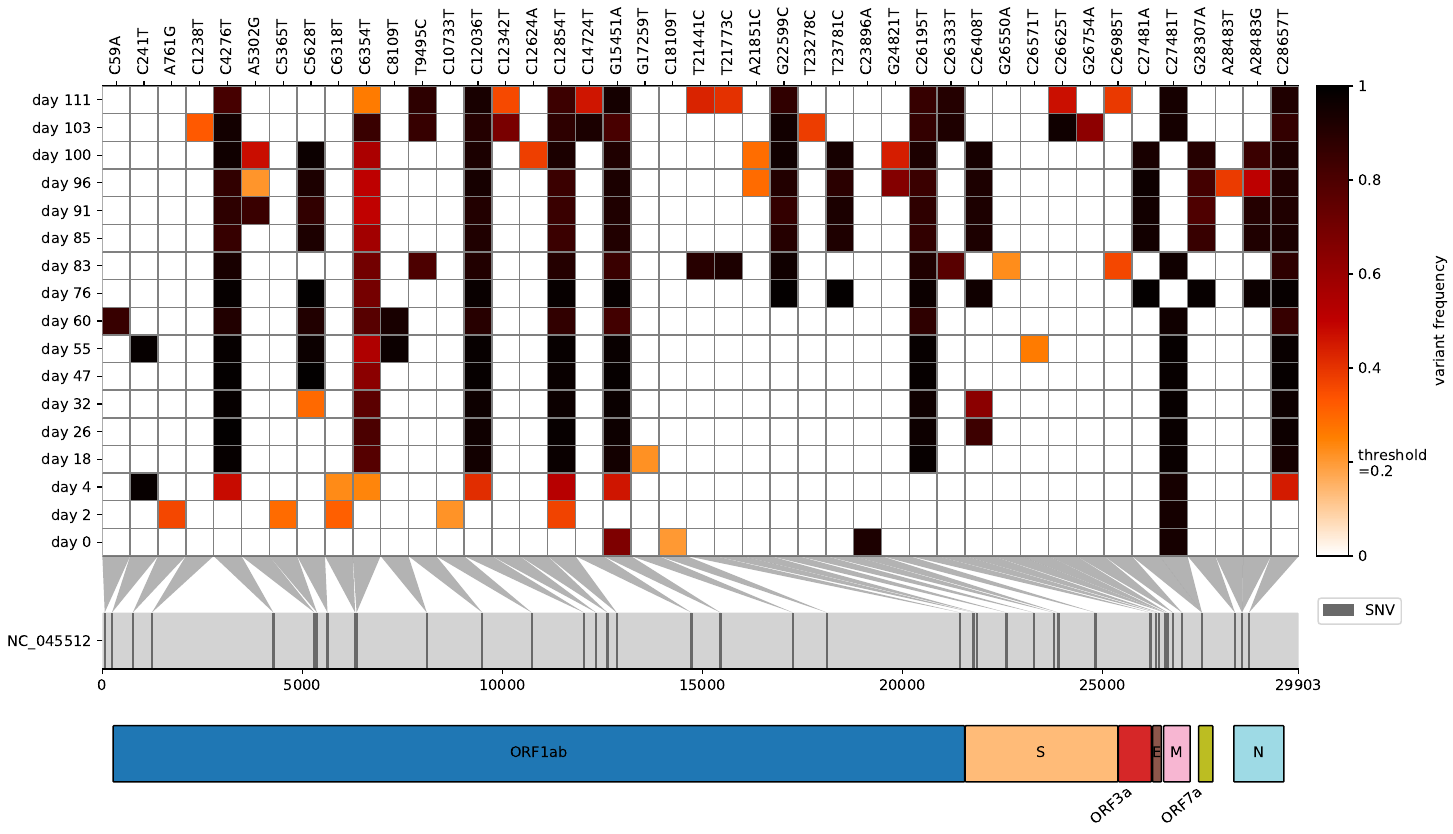
Virheat เป็นเครื่องมือในการมองเห็น VCFS เป็นความร้อนและการกลายพันธุ์ของแผนที่ไปยังยีนที่เกี่ยวข้อง
เคยต้องการดูความถี่ที่แปรปรวนหลังจากทำแผนที่การอ่านดิบของคุณกับจีโนมอ้างอิงไวรัส/แบคทีเรียและเปรียบเทียบไฟล์ VCF หลายไฟล์ในเวลาเดียวกันหรือไม่? มากกว่า Virheat สำหรับคุณ คุณไม่เพียงสามารถเห็นภาพความร้อน แต่ยังอ่านในไฟล์ GFF3 ที่ให้คุณแสดงยีนที่มีการกลายพันธุ์ สคริปต์ที่มีน้ำหนักเบานี้ได้รับแรงบันดาลใจจาก Snipit และพล็อตความถี่ตัวแปรของฉันได้รับคุณสมบัติการสร้างภาพที่ดีที่สุดของทั้งคู่
--scores 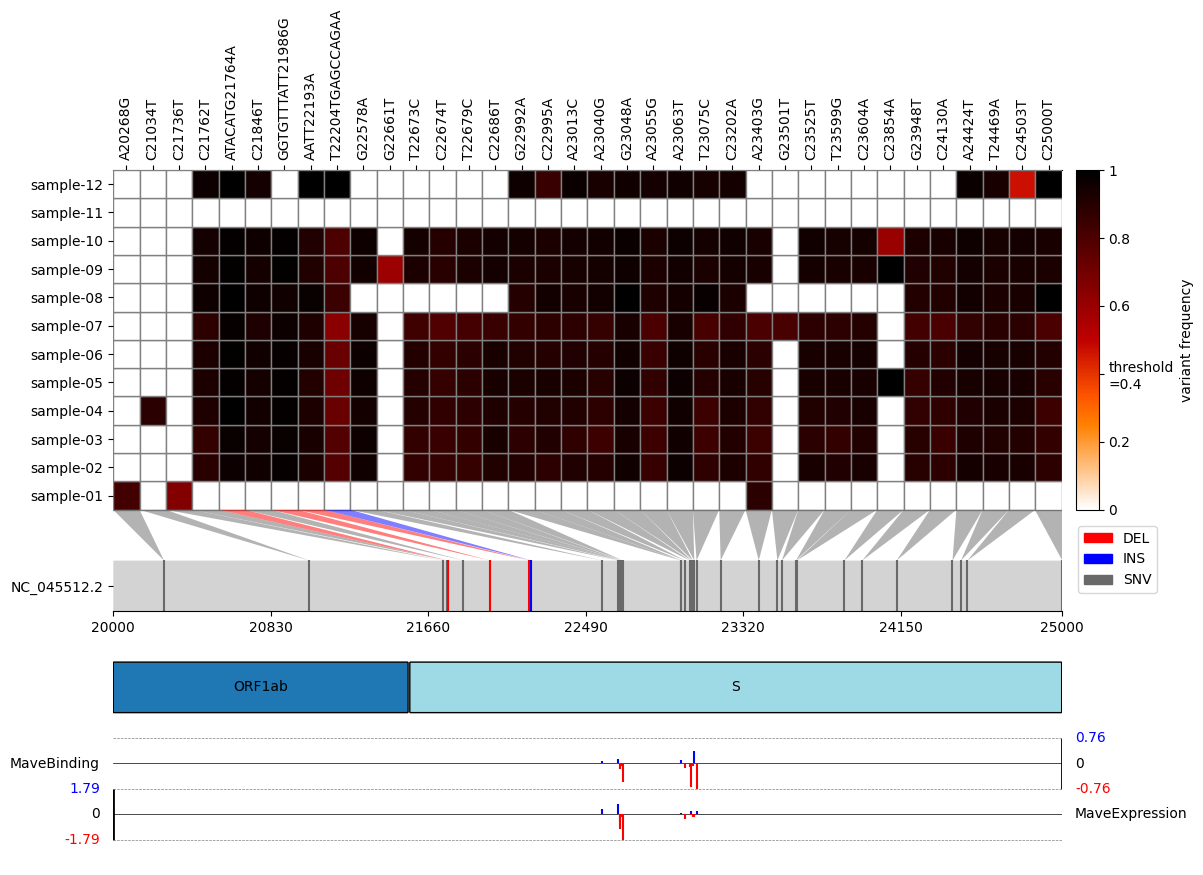
pip install virheatconda install -c bioconda virheatgit clone https://github.com/jonas-fuchs/virHEAT
cd virHEAT
pip install -r requirements.txt
# or
pip install .นั่นคือมันแล้ว เพื่อตรวจสอบว่ามันใช้งานได้หรือไม่:
virheat -vคุณควรเห็นเวอร์ชัน Virheat ปัจจุบัน
usage: virheat < folder containing vcfs > < output dir > -l or -g [additional arguments]
ข้อโต้แย้ง:
 positional arguments:
  input                 folder containing input files and output folder

options:
  -h, --help            show this help message and exit
  -r ref_id, --reference ref_id
                        reference identifier
  --name virHEAT_plot.pdf
                        plot name and file type (pdf, png, svg, jpg). Default: virHEAT_plot.pdf
  -l None, --genome-length None
                        length of the genome (needed if gff3 is not provided)
  -g None, --gff3-path None
                        path to gff3 (needed if length is not provided)
  -a [gene ...], --gff3-annotations [gene ...]
                        annotations to display from gff3 file (standard: gene). Multiple possible.
  --gene-arrows, --no-gene-arrows
                        show genes in arrow format (only if the -g argument is provided) (default: False)
  -t 0, --threshold 0   display frequencies above this threshold (0-1)
  --delete, --no-delete
                        delete mutations that are present in all samples and their maximum frequency divergence is smaller than 0.5 (default: True)
  -n None, --delete-n None
                        do not show mutations that occur n times or less (default: Do not delete)
  -z start stop, --zoom start stop
                        restrict the plot to a specific genomic region.
  --sort, --no-sort     sort sample names alphanumerically (default: False)
  --min-cov 20          display mutations covered at least x time (only if per base cov tsv files are provided)
  -s scores_file pos_col score_col score_name, --scores scores_file pos_col score_col score_name
                        specify scores to be added to the plot by providing a CSV file containing scores, along with its column for amino-acid positions, its column for scores, and descriptive score names (e.g., expression, binding, antibody escape, etc.).
                        This option can be used multiple times to include multiple sets of scores.
  -v, --version         show program's version number and exit
คุณต้องให้ความยาวของจีโนมอ้างอิงของคุณหรือหากคุณต้องการรับคำอธิบายประกอบลำดับคุณจะต้องระบุไฟล์ GFF3
นอกจากนี้คุณยังสามารถวิเคราะห์ว่าการกลายพันธุ์นั้นครอบคลุมและแสดงเซลล์ที่ไม่ได้ปกคลุมด้วยสีเทาอย่างเพียงพอหรือไม่ สำหรับการสร้างไฟล์ TSV แบบครอบคลุมต่อฐานแรกสำหรับไฟล์ BAM แต่ละไฟล์ด้วย QualImap และระบุไว้ในโฟลเดอร์เดียวกับไฟล์ VCF ให้ชื่อเดียวกันกับไฟล์ VCF ของคุณ
นอกจากนี้ยังมีตัวเลือกในการรวมการสร้างภาพของคะแนนเพิ่มเติม (เช่นคะแนน MAVE สำหรับความสัมพันธ์ที่มีผลผูกพันระดับการแสดงออกการหลบหนีแอนติบอดี ฯลฯ ) แมปกับการกลายพันธุ์บนความร้อน ในการใช้คุณสมบัตินี้ให้ใช้อาร์กิวเมนต์ -S หรือ -คะแนนและให้อาร์กิวเมนต์ต่อไปนี้: 1) พา ธ ไปยังไฟล์ CSV ที่มีคะแนน; 2) ชื่อของคอลัมน์ในไฟล์นี้ที่มีตำแหน่งการกลายพันธุ์ในสัญกรณ์คลาสสิก (เช่น T430Y); 3) ชื่อของคอลัมน์ในไฟล์นี้ที่มีคะแนนเอง; 4) ชื่อคะแนนเชิงพรรณนาที่จะใช้เป็นป้ายกำกับในพล็อต สามารถรวมชุดคะแนนหลายชุดพร้อมกันโดยทำซ้ำตัวเลือก -s หรือ -คะแนนด้วยอาร์กิวเมนต์ที่แตกต่างกัน ตัวอย่างเช่นอินพุตและข้อมูลเอาต์พุตที่เป็นไปได้โปรดดูไฟล์ที่อยู่ในโฟลเดอร์ตัวอย่าง _data/example_mave_data
ข้อจำกัดความรับผิดชอบที่สำคัญ: รหัสอยู่ภายใต้ใบอนุญาต GPLV3 รหัสไม่มีการรับประกันใด ๆ โดยไม่มีการรับประกันโดยนัยเกี่ยวกับความสามารถในการค้าหรือความเหมาะสมสำหรับวัตถุประสงค์เฉพาะ โปรแกรมนี้เป็นซอฟต์แวร์ฟรี: คุณสามารถแจกจ่ายใหม่และ/หรือแก้ไขภายใต้ข้อกำหนดของใบอนุญาตสาธารณะ GNU ทั่วไปที่เผยแพร่โดย Free Software Foundation ไม่ว่าจะเป็นเวอร์ชัน 3 ของใบอนุญาตหรือ (ตามตัวเลือกของคุณ) รุ่นใหม่ ๆ


