virHEAT
v.0.7.3

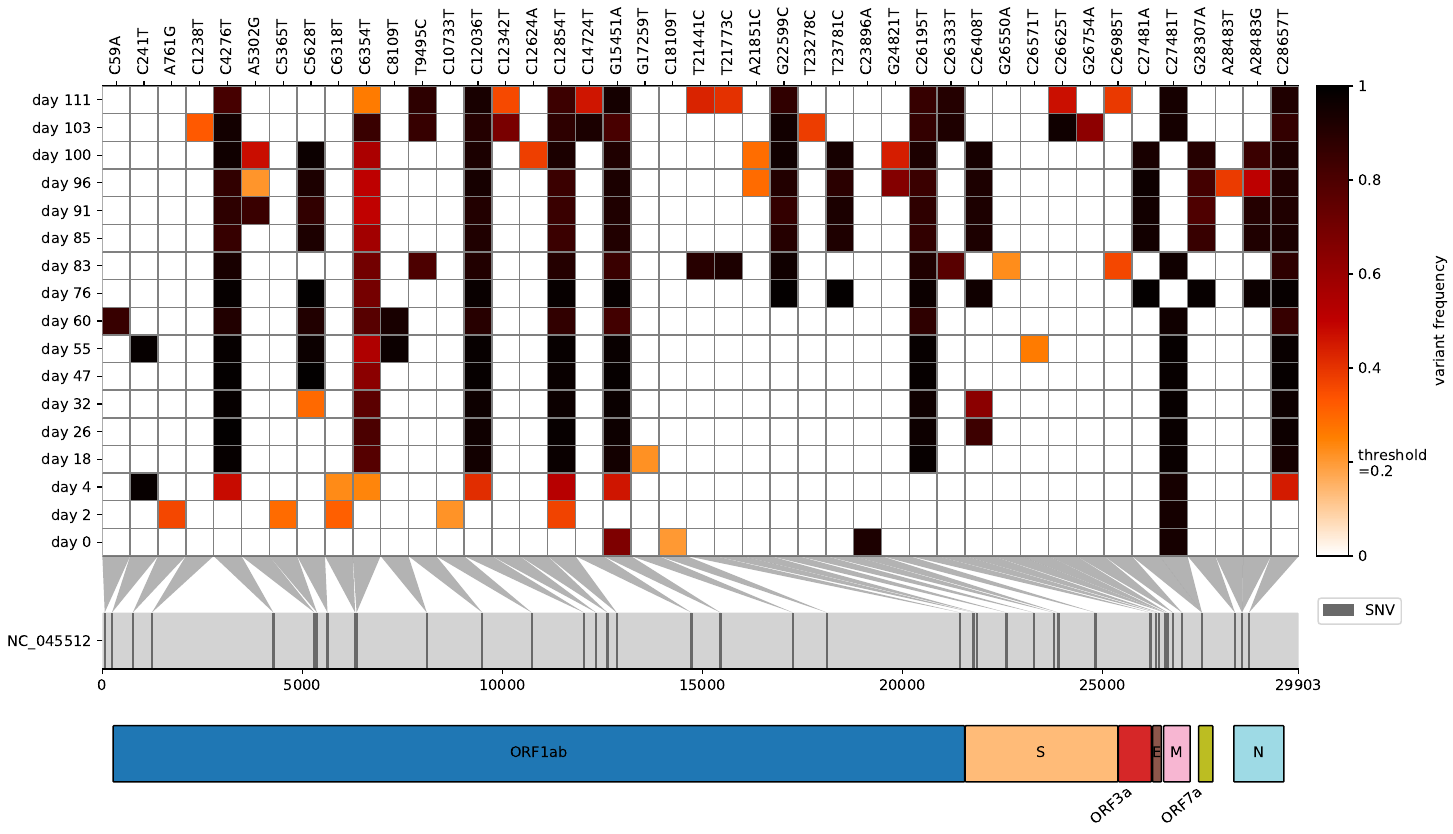
Virheatは、VCFをヒートマップとして視覚化し、それぞれの遺伝子に変異をマッピングするツールです。
RAW読み取りをウイルス/細菌の参照ゲノムにマッピングした後、バリアント周波数を凝縮した状態にしたいと思ったことがあります。 Virheatがあなたのためです。ヒートマップを視覚化するだけでなく、突然変異を抱える遺伝子を表示できるGFF3ファイルでも読み取ることができます。この軽量スクリプトは、スナイピットと私のバリアント周波数プロットに触発され、両方の最高の視覚化機能を獲得しました。
--scores 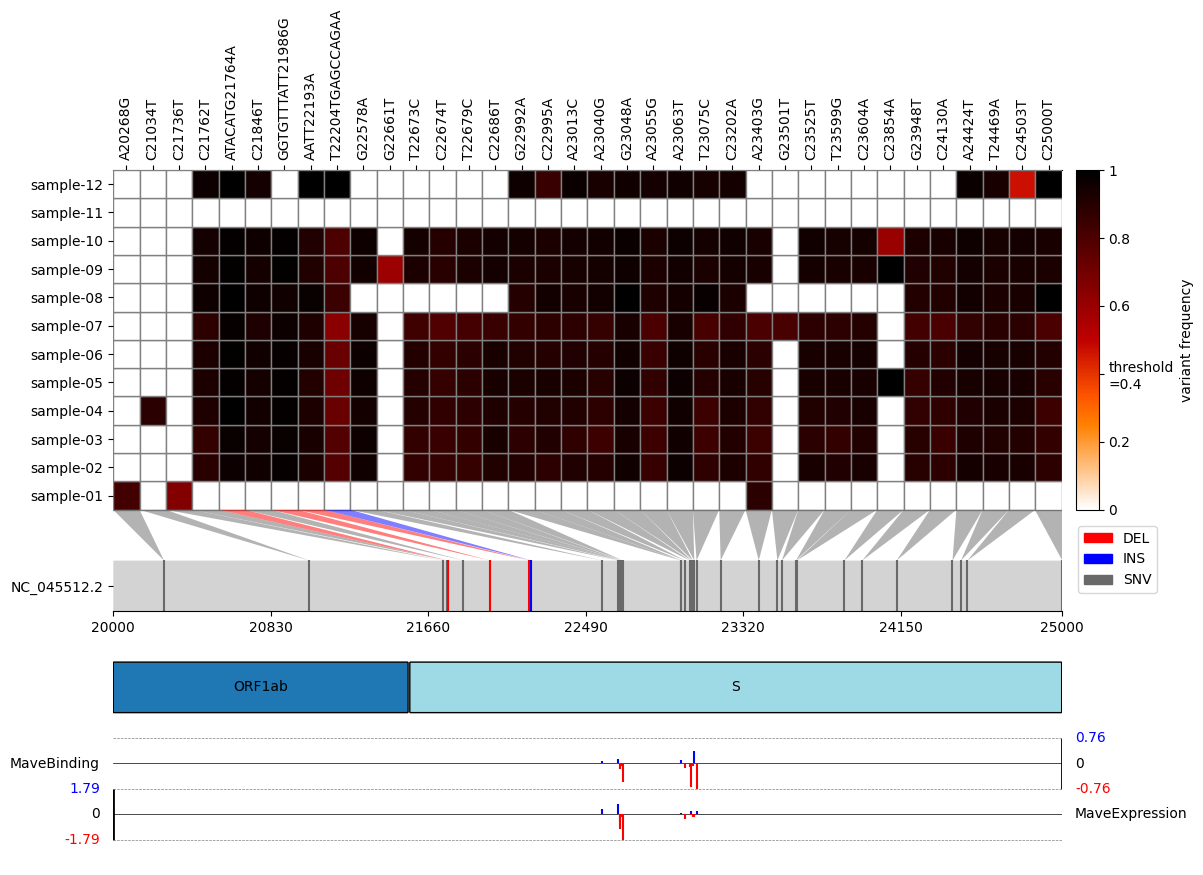
pip install virheatconda install -c bioconda virheatgit clone https://github.com/jonas-fuchs/virHEAT
cd virHEAT
pip install -r requirements.txt
# or
pip install .それはすでにそれでした。それが機能したかどうかを確認するには:
virheat -v現在のVirheatバージョンが表示されます。
usage: virheat < folder containing vcfs > < output dir > -l or -g [additional arguments]
議論:
 positional arguments:
  input                 folder containing input files and output folder

options:
  -h, --help            show this help message and exit
  -r ref_id, --reference ref_id
                        reference identifier
  --name virHEAT_plot.pdf
                        plot name and file type (pdf, png, svg, jpg). Default: virHEAT_plot.pdf
  -l None, --genome-length None
                        length of the genome (needed if gff3 is not provided)
  -g None, --gff3-path None
                        path to gff3 (needed if length is not provided)
  -a [gene ...], --gff3-annotations [gene ...]
                        annotations to display from gff3 file (standard: gene). Multiple possible.
  --gene-arrows, --no-gene-arrows
                        show genes in arrow format (only if the -g argument is provided) (default: False)
  -t 0, --threshold 0   display frequencies above this threshold (0-1)
  --delete, --no-delete
                        delete mutations that are present in all samples and their maximum frequency divergence is smaller than 0.5 (default: True)
  -n None, --delete-n None
                        do not show mutations that occur n times or less (default: Do not delete)
  -z start stop, --zoom start stop
                        restrict the plot to a specific genomic region.
  --sort, --no-sort     sort sample names alphanumerically (default: False)
  --min-cov 20          display mutations covered at least x time (only if per base cov tsv files are provided)
  -s scores_file pos_col score_col score_name, --scores scores_file pos_col score_col score_name
                        specify scores to be added to the plot by providing a CSV file containing scores, along with its column for amino-acid positions, its column for scores, and descriptive score names (e.g., expression, binding, antibody escape, etc.).
                        This option can be used multiple times to include multiple sets of scores.
  -v, --version         show program's version number and exit
参照ゲノムの長さを提供するか、シーケンスアノテーションを取得する場合は、GFF3ファイルを提供する必要があります。
さらに、変異が十分に覆われているかどうかを分析し、灰色で非覆われていない細胞を表示することもできます。そのために、最初にVAMファイルのベースごとのカバレッジTSVファイルを作成し、VCFファイルと同じフォルダーで提供します。 VCFファイルと同じ名前を付けます。
さらに、ヒートマップの突然変異にマッピングされた追加のスコア(たとえば、結合親和性、発現レベル、抗体脱出など)の追加スコアの視覚化を含めるオプションがあります。この機能を利用するには、-sまたは - スコアの引数を使用し、次の引数を提供します。1)スコアを含むCSVファイルへのパス。 2)このファイルの列の名前は、古典的な表記法の突然変異位置を含む(たとえば、T430y)。 3)スコア自体を含むこのファイルの列の名前。 4)プロット内のラベルとして使用される記述スコア名。異なる引数で-sまたは - スコアオプションを繰り返すことにより、複数のスコアセットを同時に含めることができます。たとえば、入力データや可能な出力データなど、example_data/emple_mave_dataフォルダーにあるファイルを参照してください。
重要な免責事項:コードはGPLV3ライセンスの下にあります。コードには保証がありません。商品性や特定の目的に対するフィットネスの暗黙の保証さえありません。このプログラムはフリーソフトウェアです。フリーソフトウェアファンデーションの条件、ライセンスのバージョン3、または(オプションで)後のバージョンのいずれかで公開されているように、GNU一般公開ライセンスの条件の下でそれを再配布したり、変更したりできます。


