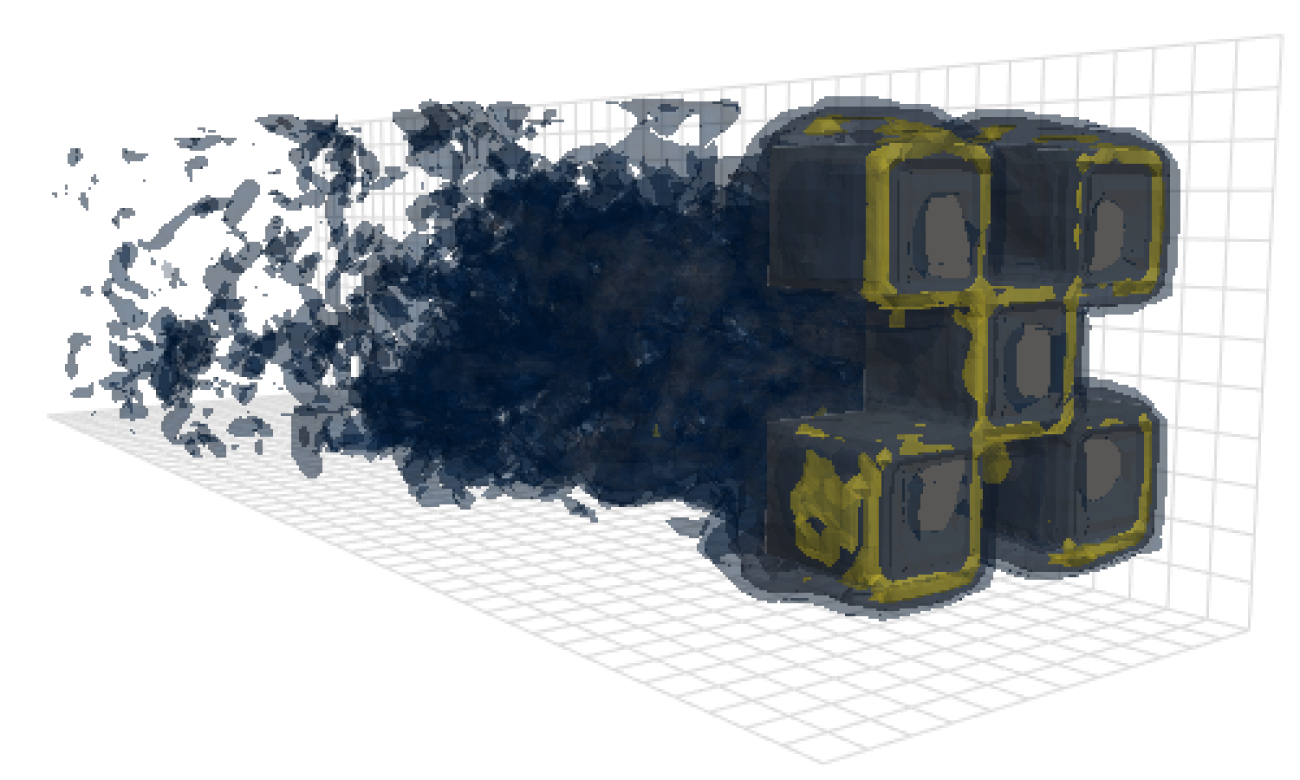
generative turbulence
1.0.0
Marten Lienen, David Lüdke, Jan Hansen-Palmus, Stephan Günnemann
ที่เก็บนี้มีรหัสที่ใช้ในการสร้างผลลัพธ์ในบทความของเรา: OpenReview, arxiv
นอกเหนือจากโมเดลแล้วการโหลดข้อมูลและรหัสการฝึกอบรมที่เก็บนี้ยังมีรหัสเพื่อกำหนดค่าและเรียกใช้ OpenFOAM และโพสต์เอาต์พุต เครื่องมือเหล่านี้อาจเป็นจุดเริ่มต้นที่มีประโยชน์อย่างมากสำหรับนักวิจัยคนอื่น ๆ ในสาขา โดยเฉพาะอย่างยิ่งมี
 # Clone the repository
git clone https://github.com/martenlienen/generative-turbulence.git

# Change into the repository
cd generative-turbulence

# Install package editably with dependencies
pip install -e .

# If you need a specific pytorch version, e.g. CPU-only or an older CUDA version, check
#
#     https://pytorch.org/get-started/locally/
#
# and run, for example,
#
# pip install torch --extra-index-url https://download.pytorch.org/whl/cu117
#
# before installing this package. ชุดข้อมูลรูปร่างจัดขึ้นที่ห้องสมุดมหาวิทยาลัย Tum ในการดาวน์โหลดให้ทำตามคำแนะนำในหน้าของพวกเขาหรือดำเนินการตามขั้นตอนต่อไปนี้ ก่อนอื่นให้ดาวน์โหลดไฟล์
 # Download all archives to data/shapes/download
scripts/download-dataset.sh
โปรดทราบว่าสิ่งนี้อาจใช้เวลานานเนื่องจากข้อมูลที่ประมวลผลประมาณ 2TB สคริปต์ใช้ rsync เพื่อให้คุณสามารถดาวน์โหลดบางส่วนได้อีกครั้ง หากคุณต้องการดาวน์โหลดข้อมูลเคส OpenFOAM RAW ให้เรียกใช้แทน
scripts/download-dataset.sh --with-rawหลังจากดาวน์โหลดคลังเก็บของ Invididual คุณจะต้องแยกไฟล์ สคริปต์ต่อไปนี้ทำเพื่อคุณ
scripts/extract-dataset.shหลังจากนั้นคุณสามารถเริ่มการฝึกอบรมแบบจำลองตามที่อธิบายไว้ด้านล่าง
ตัวอย่างข้อมูลต่อไปนี้โหลดข้อมูลจากไฟล์ data.h5 ใด ๆ ในชุดข้อมูลเพื่อให้คุณสำรวจและทดสอบด้วย
 import numpy as np
import h5py as h5

def load_data ( path , idx , features = [ "u" , "p" ]):
    """Load data from a data.h5 file into an easily digestible matrix format.

    Arguments
    ---------
    path
        Path to a data.h5 file in the `shapes` dataset
    idx
        Index or indices of sample to load. Can be a number, list, boolean mask or a slice.
    features
        Features to load. By default loads only velocity and pressure but you can also
        access the LES specific k and nut variables.

    Returns
    -------
    t: np.ndarray of shape T
        Time steps of the loaded data frames
    data_3d: np.ndarray of shape T x W x H x D x F
        3D data with all features concatenated in the order that they are requested, i.e.
        in the default case the first 3 features will be the velocity vector and the fourth
        will be the pressure
    inside_mask: np.ndarray of shape W x H x D
        Boolean mask that marks the inside cells of the domain, i.e. cells that are not part
        of walls, inlets or outlets
    boundary_masks: dict of str to nd.ndarray of shape W x H x D
        Masks that mark cells belonging to each type of boundary
    boundary_values: dict[str, dict[str, np.ndarray]]
        Prescribed values for variables and boundaries with Dirichlet boundary conditions
    """

    with h5 . File ( path , mode = "r" ) as f :
        t = np . array ( f [ "data/times" ])

        cell_data = np . concatenate ([ np . atleast_3d ( f [ "data" ][ name ][ idx ]) for name in features ], axis = - 1 )
        padded_cell_counts = np . array ( f [ "grid/cell_counts" ])
        cell_idx = np . array ( f [ "grid/cell_idx" ])

        n_steps , n_features = cell_data . shape [ 0 ], cell_data . shape [ - 1 ]
        data_3d = np . zeros (( n_steps , * padded_cell_counts , n_features ))
        data_3d . reshape (( n_steps , - 1 , n_features ))[:, cell_idx ] = cell_data

        inside_mask = np . zeros ( padded_cell_counts , dtype = bool )
        inside_mask . reshape ( - 1 )[ cell_idx ] = 1

        boundary_masks = { name : np . zeros ( padded_cell_counts , dtype = bool ) for name in f [ "grid/boundaries" ]. keys ()}
        for name , mask in boundary_masks . items ():
            mask . reshape ( - 1 )[ np . array ( f [ "grid/boundaries" ][ name ])] = 1

        boundary_values = {
            ft : {
                name : np . atleast_1d ( desc [ "value" ])
                for name , desc in f [ "boundary-conditions" ][ ft ]. items ()
                if desc . attrs [ "type" ] == "fixed-value"
            }
            for ft in features
        }

    return t , data_3d , inside_mask , boundary_masks , boundary_values
คุณสามารถใช้มันได้เช่น
 from matplotlib . pyplot import matshow

path = "data/shapes/data/2x2-large/data.h5"
t , data_3d , inside_mask , boundary_masks , boundary_values = load_data ( path , [ 50 , 300 ])

matshow ( np . linalg . norm ( data_3d [ - 1 , :, :, 20 , : 3 ], axis = - 1 ). T )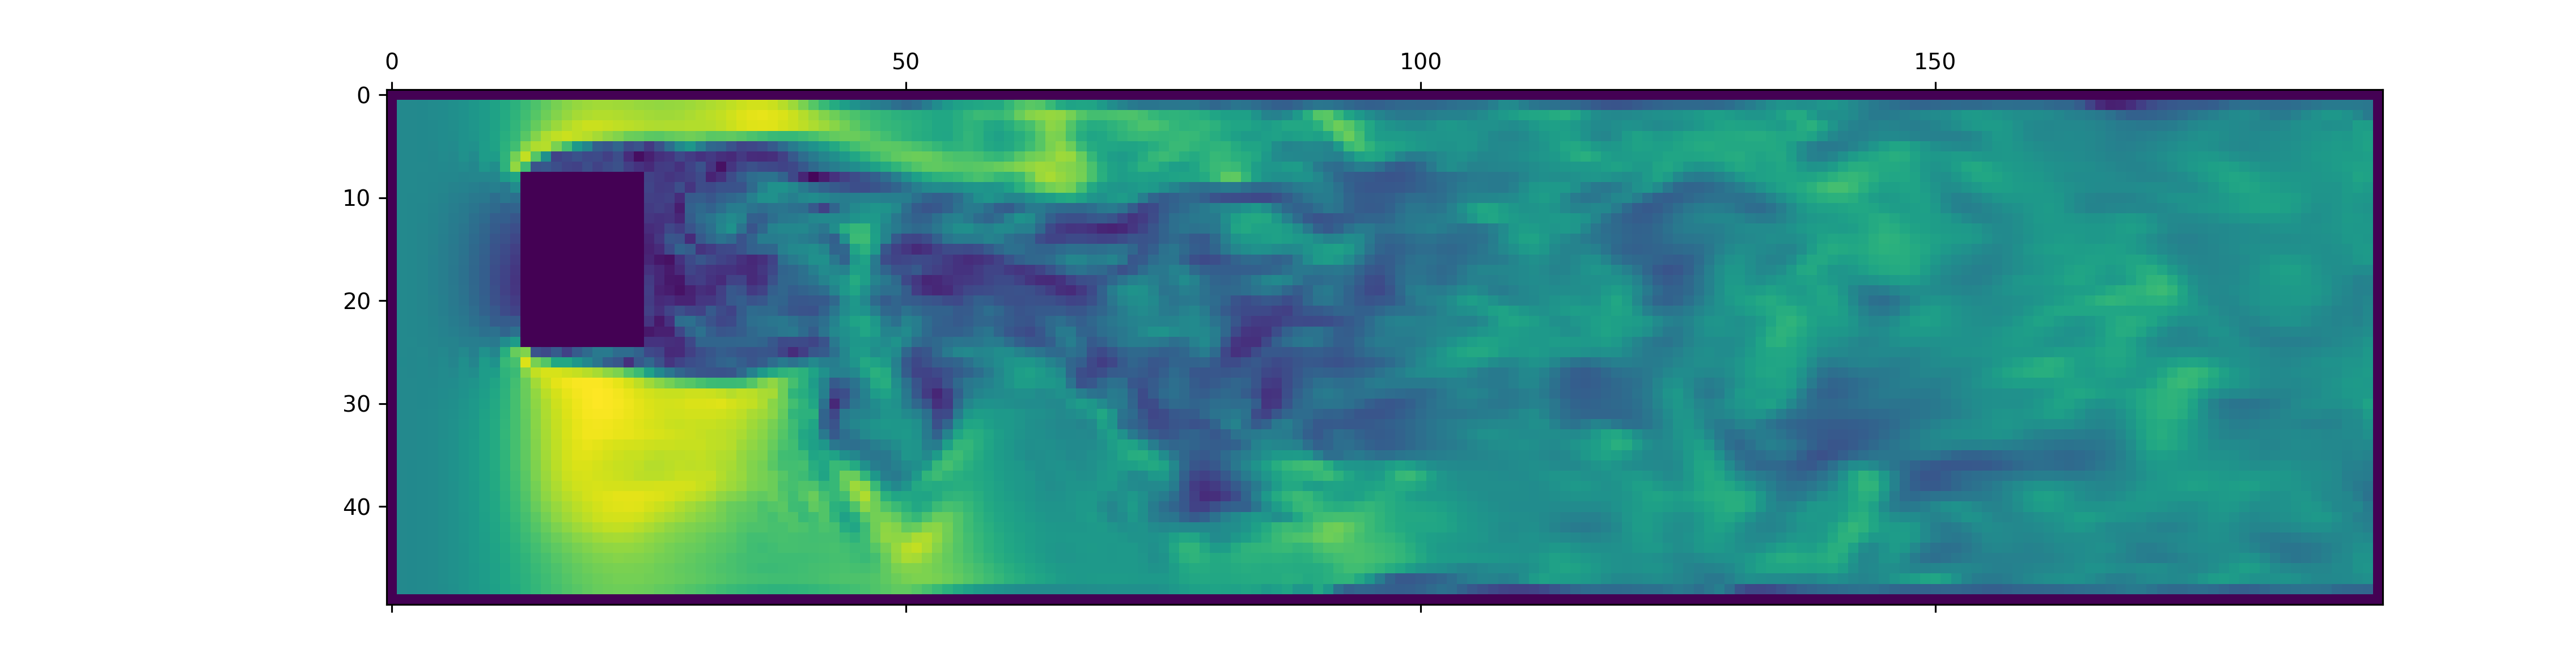
ไฟล์ data.h5 มีข้อมูลเพิ่มเติมมากกว่าการโหลดตัวอย่างนี้ ในการสำรวจสิ่งที่มีอยู่ให้เข้ามาในตัวโหลดข้อมูลของเรา
ในการสร้างข้อมูลสำหรับการจำลอง OpenFOAM ใหม่ก่อนอื่นตรวจสอบให้แน่ใจว่าคุณได้ติดตั้งการพึ่งพาพิเศษและมี just :
pip install -e " .[data] " หากคุณไม่ต้องการใช้ just คุณสามารถอ่าน justfile และเรียกใช้คำสั่งด้วยตัวเอง
เริ่มต้นด้วยการสร้างคอนเทนเนอร์ Docker ที่ติดตั้ง OpenFOAM:
just of-dockerตอนนี้สร้างกรณีใหม่ ๆ ตัวอย่างเช่นการตั้งค่ากรณี OpenFOAM ทั้งหมด (จำลอง) ทั้งหมดจากชุดข้อมูลของเรา:
./scripts/generate-shapes.py data/shapesแน่นอนคุณสามารถปรับสคริปต์เพื่อสร้างรูปร่างอื่น ๆ หรือชุดข้อมูลใหม่อย่างสมบูรณ์
ตอนนี้คุณสามารถแก้ปัญหา (เรียกใช้การจำลอง) ด้วย openfoam ในพื้นที่
just of-solve path/to/caseหรือส่งพวงทั้งหมดไปยังกลุ่ม slurm ของคุณเอง:
./scripts/solve-slurm.py data/shapes/data/ * /caseหลังจากนั้นให้ใช้การประมวลผลหลังการแปลง HDF5 กับการจำลองแต่ละครั้งเช่น
just postprocess data/shapes/data/2x2ในที่สุดคำนวณสถิติชุดการฝึกอบรมสำหรับการทำให้เป็นมาตรฐาน:
./scripts/dataset-stats.py data/shapes หากต้องการเริ่มการฝึกอบรมให้โทร train.py ด้วยการตั้งค่าของคุณเช่น
./train.py data.batch_size=128 สคริปต์การฝึกอบรมใช้ Hydra สำหรับการกำหนดค่าดังนั้นตรวจสอบไฟล์ในไดเรกทอรี config เพื่อเรียนรู้เกี่ยวกับการตั้งค่าที่มีอยู่ทั้งหมด
เพื่อดำเนินการทดลองอีกครั้งจากกระดาษให้ดำเนินการ
./train.py -cn shapes_experiment -m ซึ่งเริ่มการฝึกอบรมด้วยการตั้งค่าใน config/shapes_experiment.yaml หากคุณไม่มีคลัสเตอร์ Slurm ให้ลบการตั้งค่าที่เกี่ยวข้องกับ launcher
หากคุณสร้างงานนี้โปรดอ้างอิงบทความของเราดังนี้
 @inproceedings{lienen2024zero,
  title = {From {{Zero}} to {{Turbulence}}: {{Generative Modeling}} for {{3D Flow Simulation}}},
  author = {Lienen, Marten and L{"u}dke, David and {Hansen-Palmus}, Jan and G{"u}nnemann, Stephan},
  booktitle = {International {{Conference}} on {{Learning Representations}}},
  year = {2024},
}


