whatsapplib
v0.0.5
As the name suggest WhastsApp-Analyzer, it is Whatsapp Group Chat analysis package. It will basically help the programmers to generate visual insights from the whatsapp group chat. You need to do nothing, just export the group chat and use this package to generate or create beautiful different-different charts. Here you do not have to worry about anything, internally it will do everything for you. It will perform ETL(Extract-Transform-Load) and finally generate insights in the form of visuals. There are approx. more than 15 methods are available which will help you to generate insights, even you can download each and every insight.
Link : https://pypi.org/project/WhatsappLib/0.0.5/
The methods are listed below :
Use the package manager pip to install all the requirements. Just follow the commands below :
pip install WhatsappLib==0.0.5
Remember : Your data must be in the format as mention below, if not, then try to transform your data in given format. And ya, If your time period is specified as AM'&'PM' format then you need to change them in lower case 'am'&'pm' format. I will fix this issue and update this package ASAP.

# importing the required libraries
from WhatsappLib.whatsapplib.preprocess import analysis
# you need to do just one simple step, create object of Analyzer class and pass location-
# of directory as parameter which is mendatory.
obj = analysis(r'*Sample.txt')
# Now use this reference variable (obj) to access this methods.
total_users, total_messages, media_messages, links = obj.basicStats() # it is returning 4 parameters
print('Total No. of users : ', total_users)
print('Total No. messages sent : ', total_messages)
print('Total No. of media messages sent : ', media_messages)
print('Total No. of link shared : ', links)
obj.wordCloud_in(user='+91 83900 8', save_fig='y')
obj.mostActiveUsers(save_fig='y')
obj.mostActiveDay(save_fig='y')
obj.topMediaContributor(save_fig='N')
obj.maxWordContributers(save_fig='y')
obj.maxURLContributers(save_fig='N')
obj.mostActiveTime()
obj.mostSuitableHours(save_fig='y')
obj.highlyActiveDates(save_fig='N')
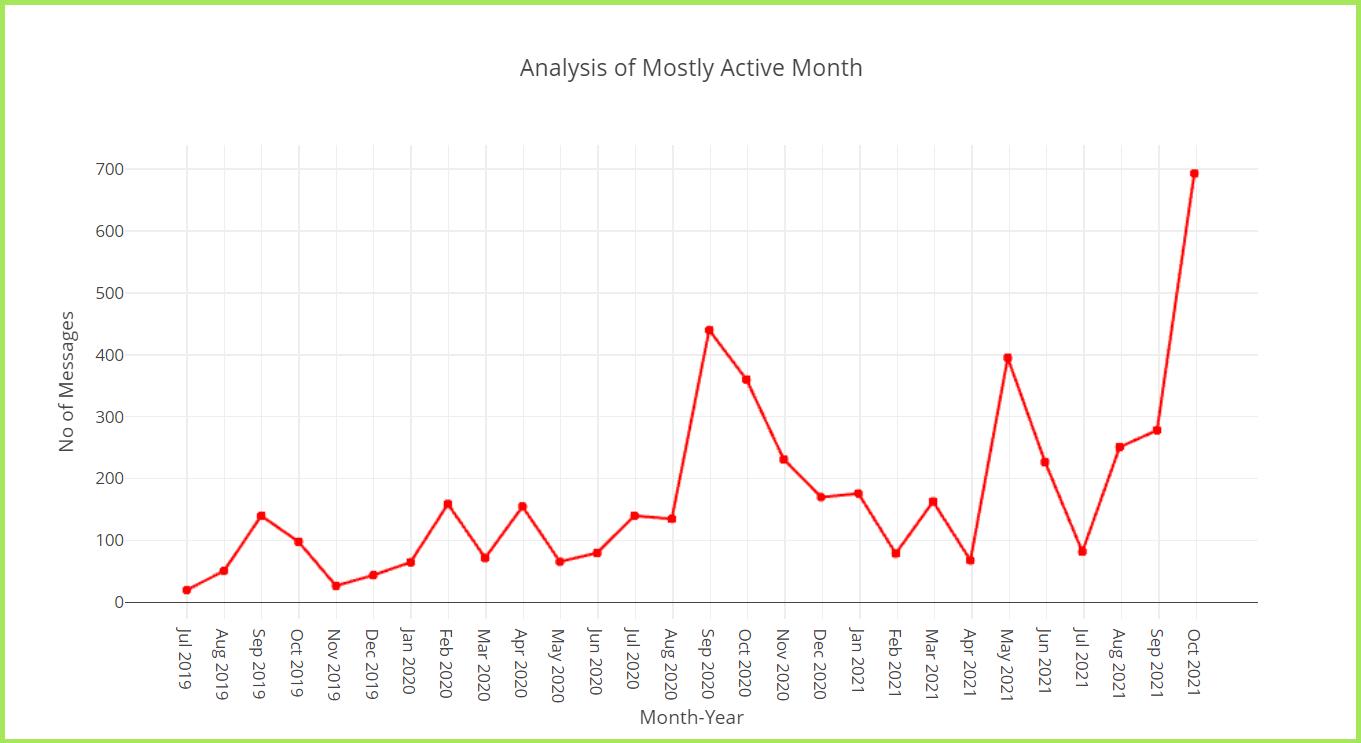
obj.timeseriesAnalysis(save_fig='y')
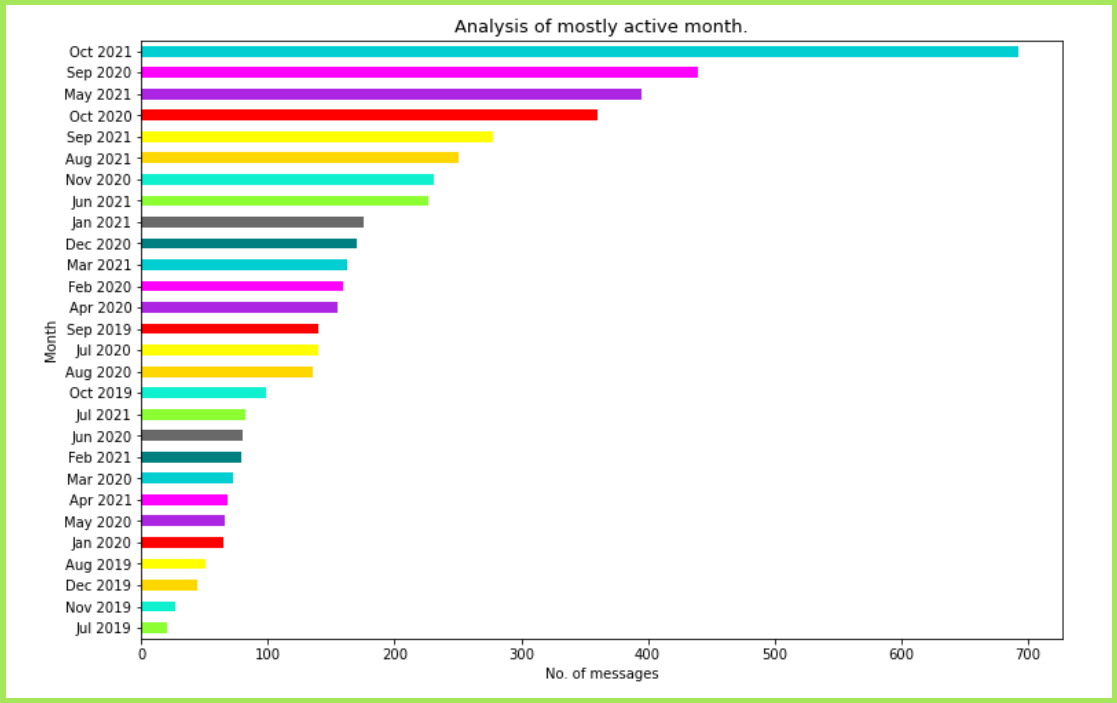
obj.activeMonthsB(save_fig='N')
obj.maxEmojiUsers(save_fig='y')
obj.activeMonthsT()
obj.trafficPerYear(save_fig='N')
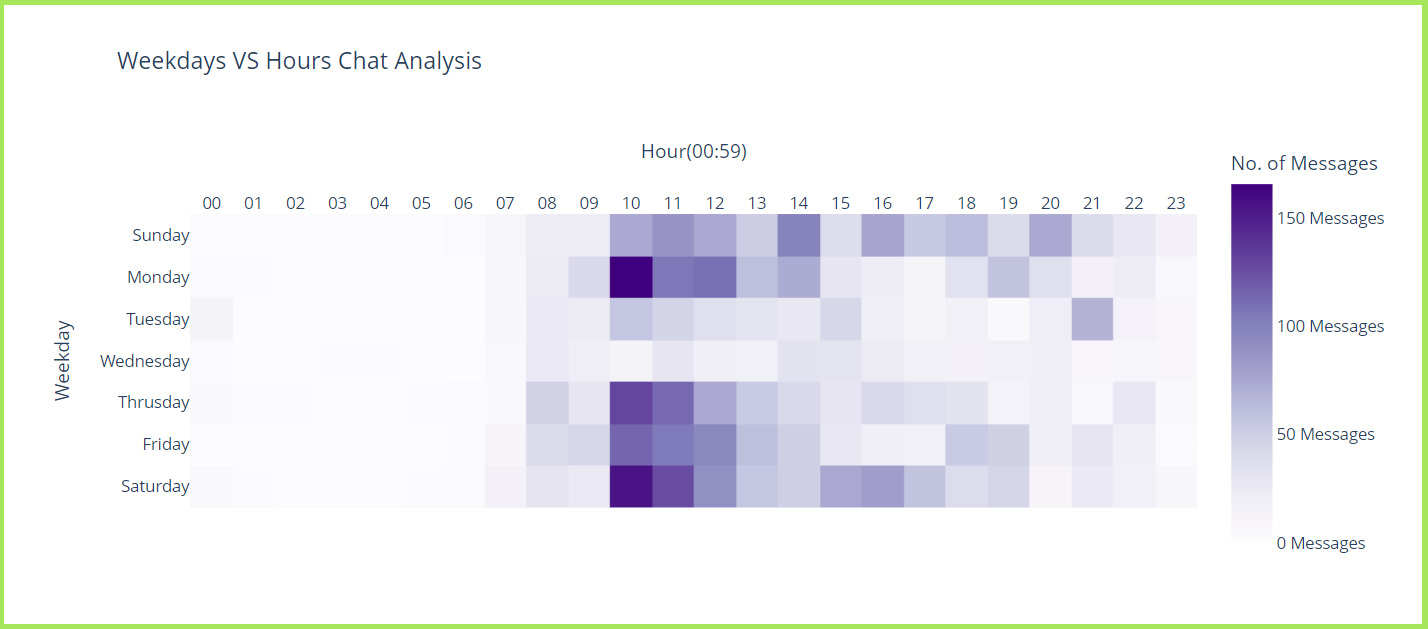
obj.weekdaysTraffic(save_fig='y')
top_emojis = obj.topEmojis_G() # returning pandas dataframe
obj.saveDatframe() # saving the dataframe
top_emojis_i = obj.topEmojis_I('+91 81*** 00***') # returning pandas dataframe
# Again Note :) : In some methods you need to pass "User" as a parameter which is mandatory, some methods-
# are taking "save_fig" parameter to save the figure in current directory, which is optional, if you want to-
# download the figure or plot you can tweak the parameter.Sample Output :

This is my small open source contribution to Python's community. Feel free to connect me on linkedin. To check out my amazing blogs click here.
Made with ❤ by ronil


