SwiftUICharts
v2.10.3
แผนภูมิ / ห้องสมุดพล็อตสำหรับ Swiftui ทำงานบน macOS, iOS, watchos และ tvos และมีคุณสมบัติการเข้าถึงและการแปลในตัว
โครงการสาธิต
เอกสาร
ทำงานกับเวอร์ชัน 3 ด้วยความรู้สึกที่รวดเร็วยิ่งขึ้นกับ API
แผนภูมิเส้น
แผนภูมิเส้นที่เต็มไป
แผนภูมิหลายบรรทัด
แผนภูมิเส้นระยะไกล
แผนภูมิบาร์
แผนภูมิบาร์
แผนภูมิบาร์
แผนภูมิแท่งซ้อนกัน
แผนภูมิวงกลม
แผนภูมิโดนัท
ใช้โมเดลข้อมูล LineChartData
LineChart ( chartData : LineChartData ) 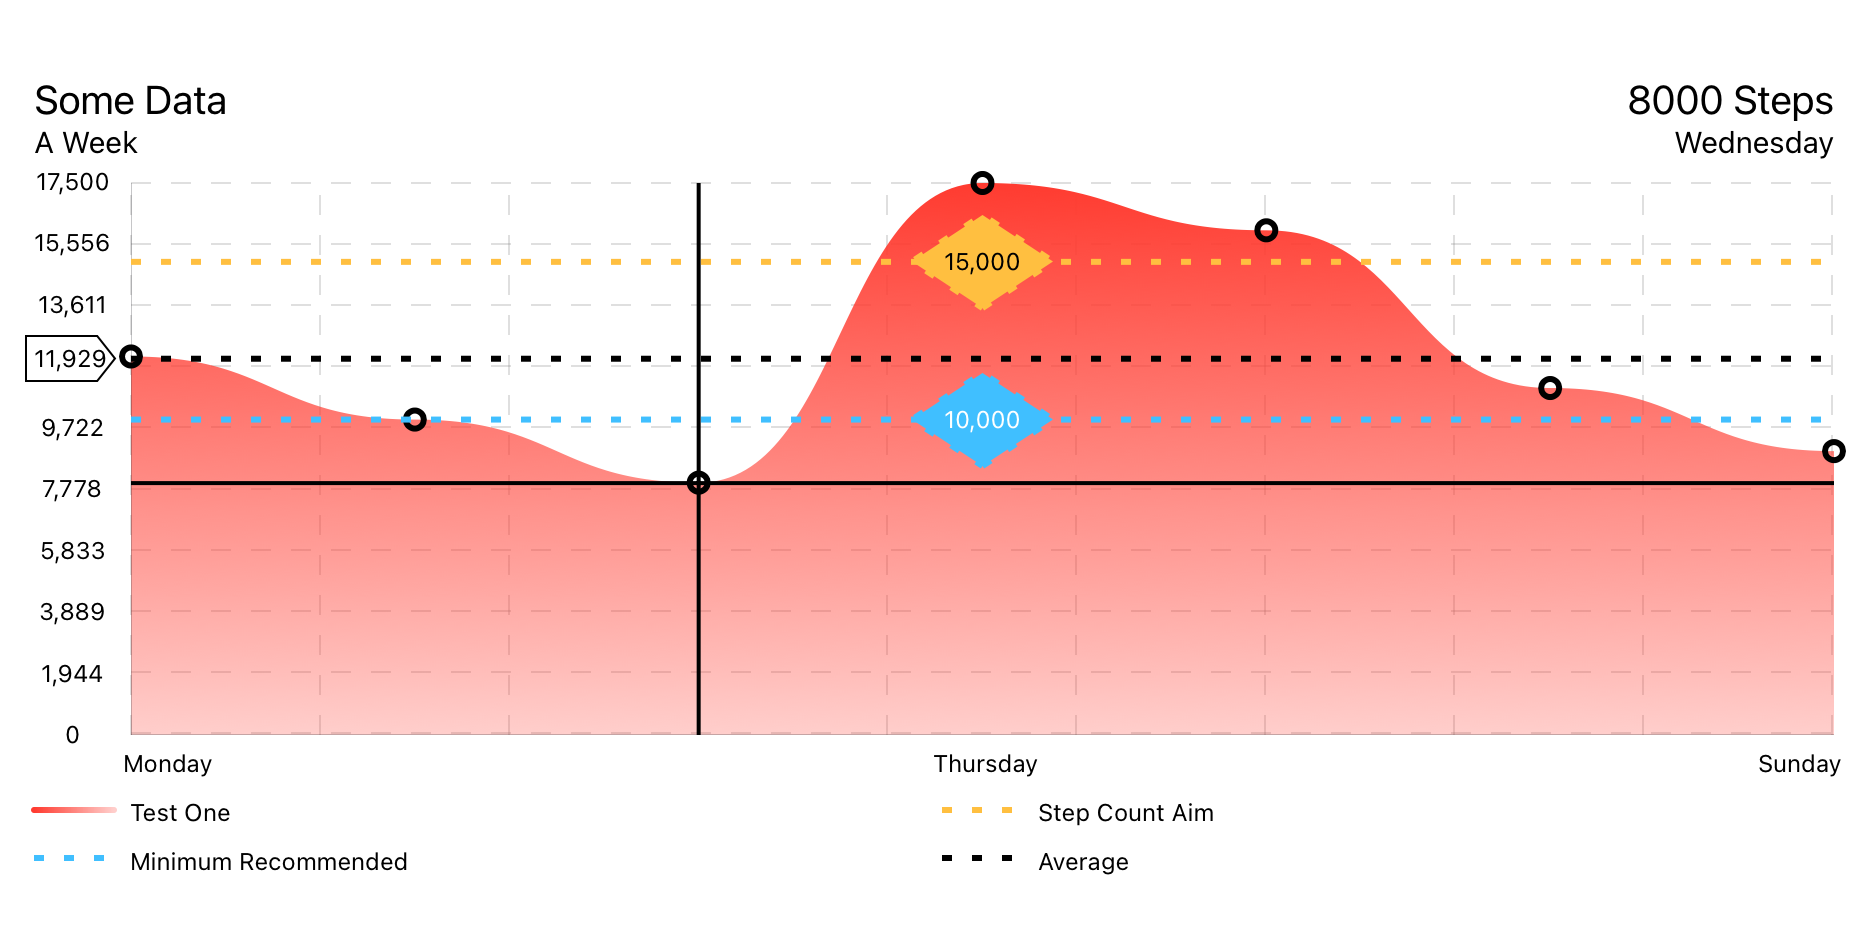
ใช้โมเดลข้อมูล LineChartData
FilledLineChart ( chartData : LineChartData ) 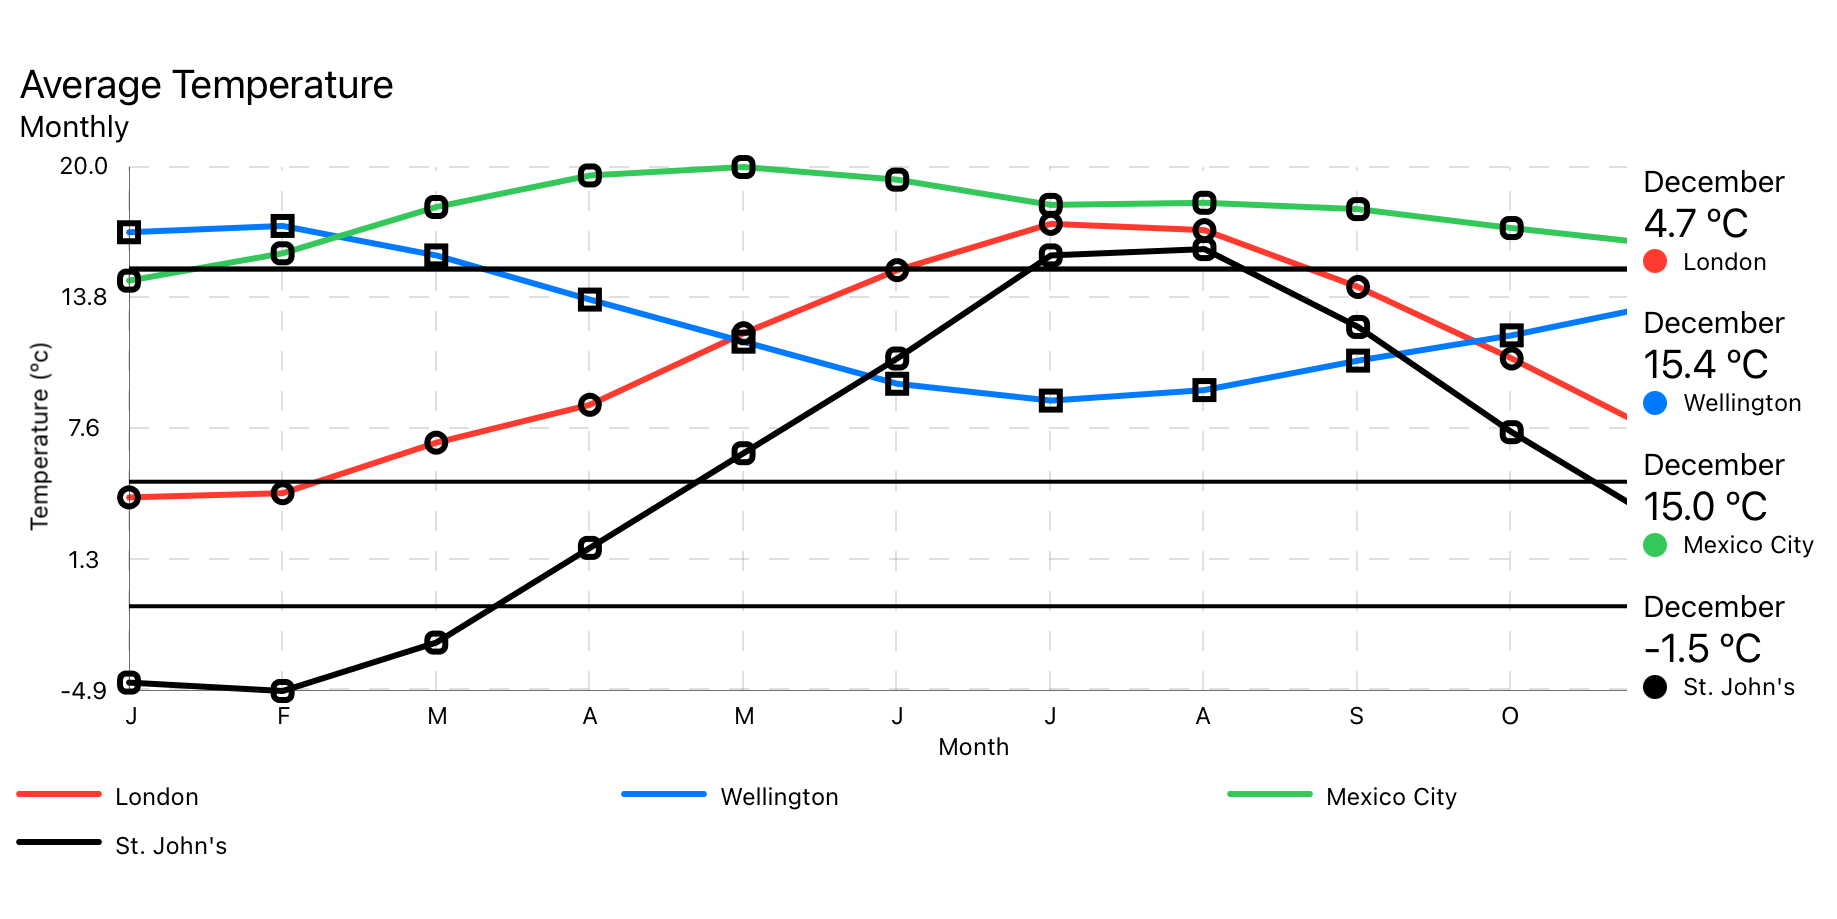
ใช้โมเดลข้อมูล MultiLineChartData
MultiLineChart ( chartData : MultiLineChartData ) 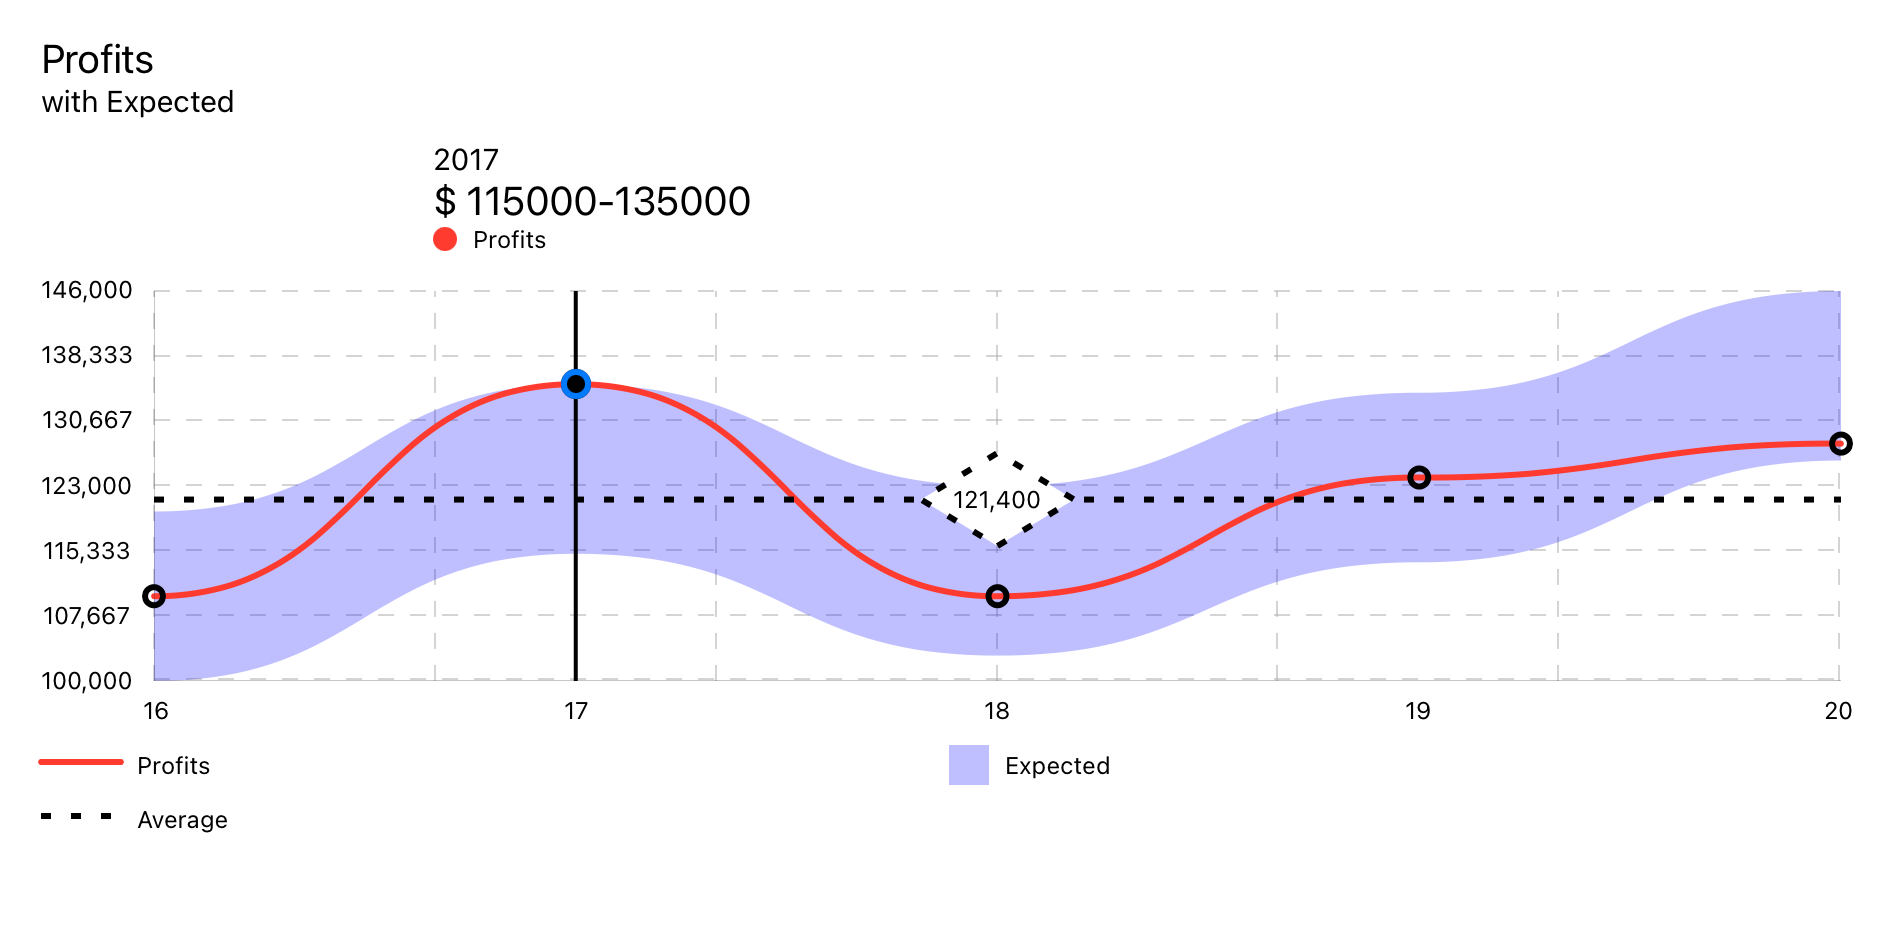
ใช้โมเดลข้อมูล RangedLineChart
RangedLineChart ( chartData : RangedLineChartData )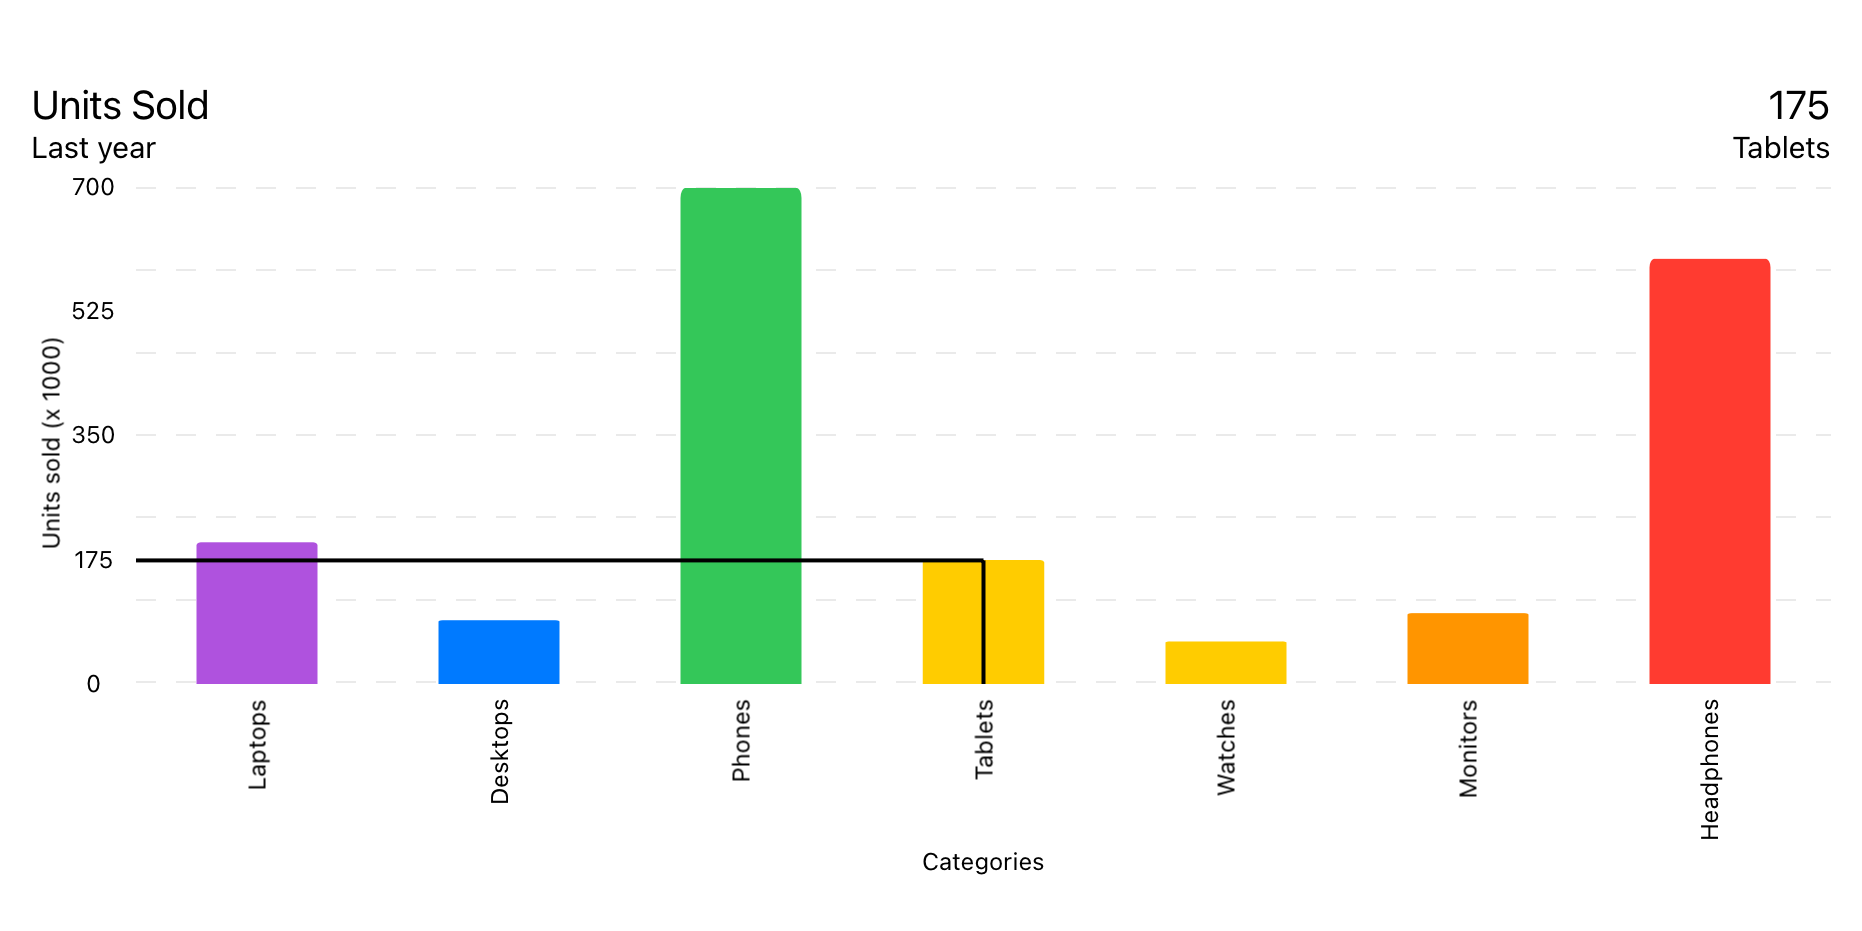
ใช้โมเดลข้อมูล BarChartData
BarChart ( chartData : BarChartData ) 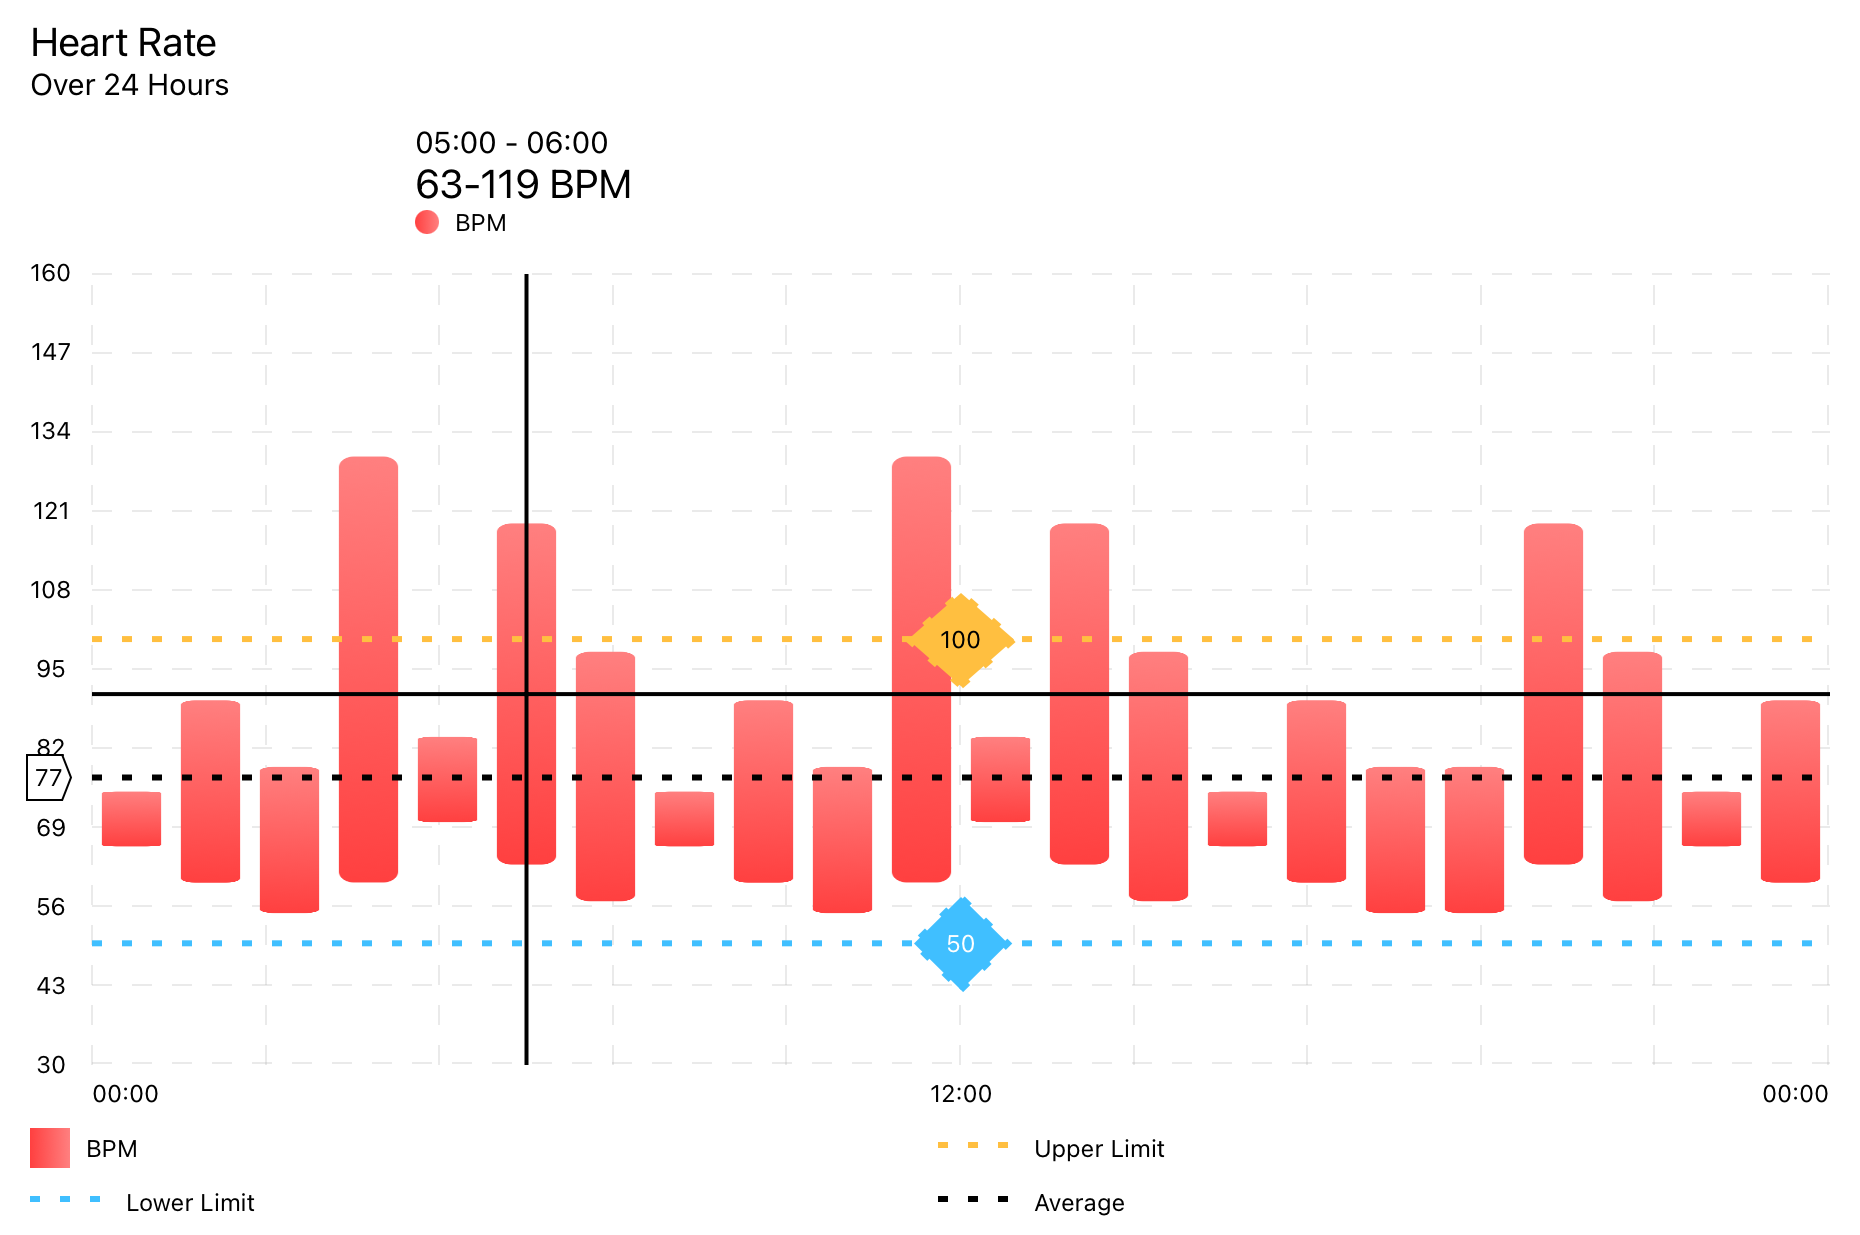
ใช้โมเดลข้อมูล RangedBarChartData
RangedBarChart ( chartData : RangedBarChartData ) 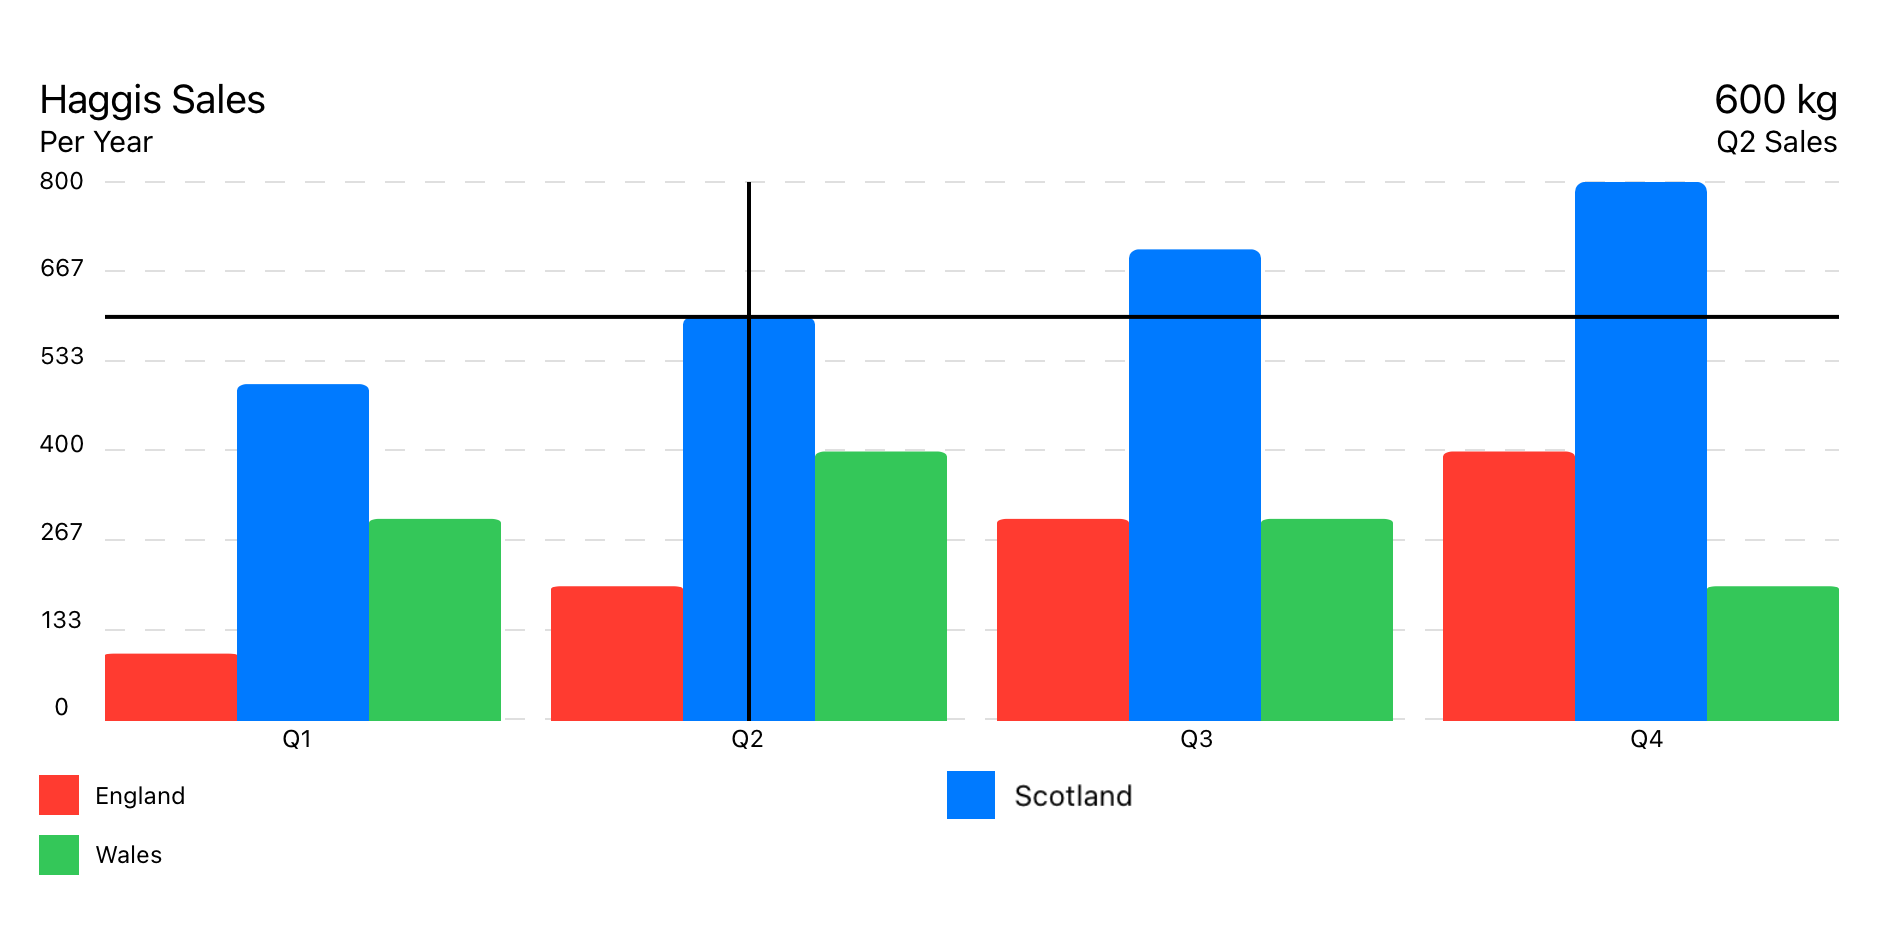
ใช้โมเดลข้อมูล GroupedBarChartData
GroupedBarChart ( chartData : GroupedBarChartData ) 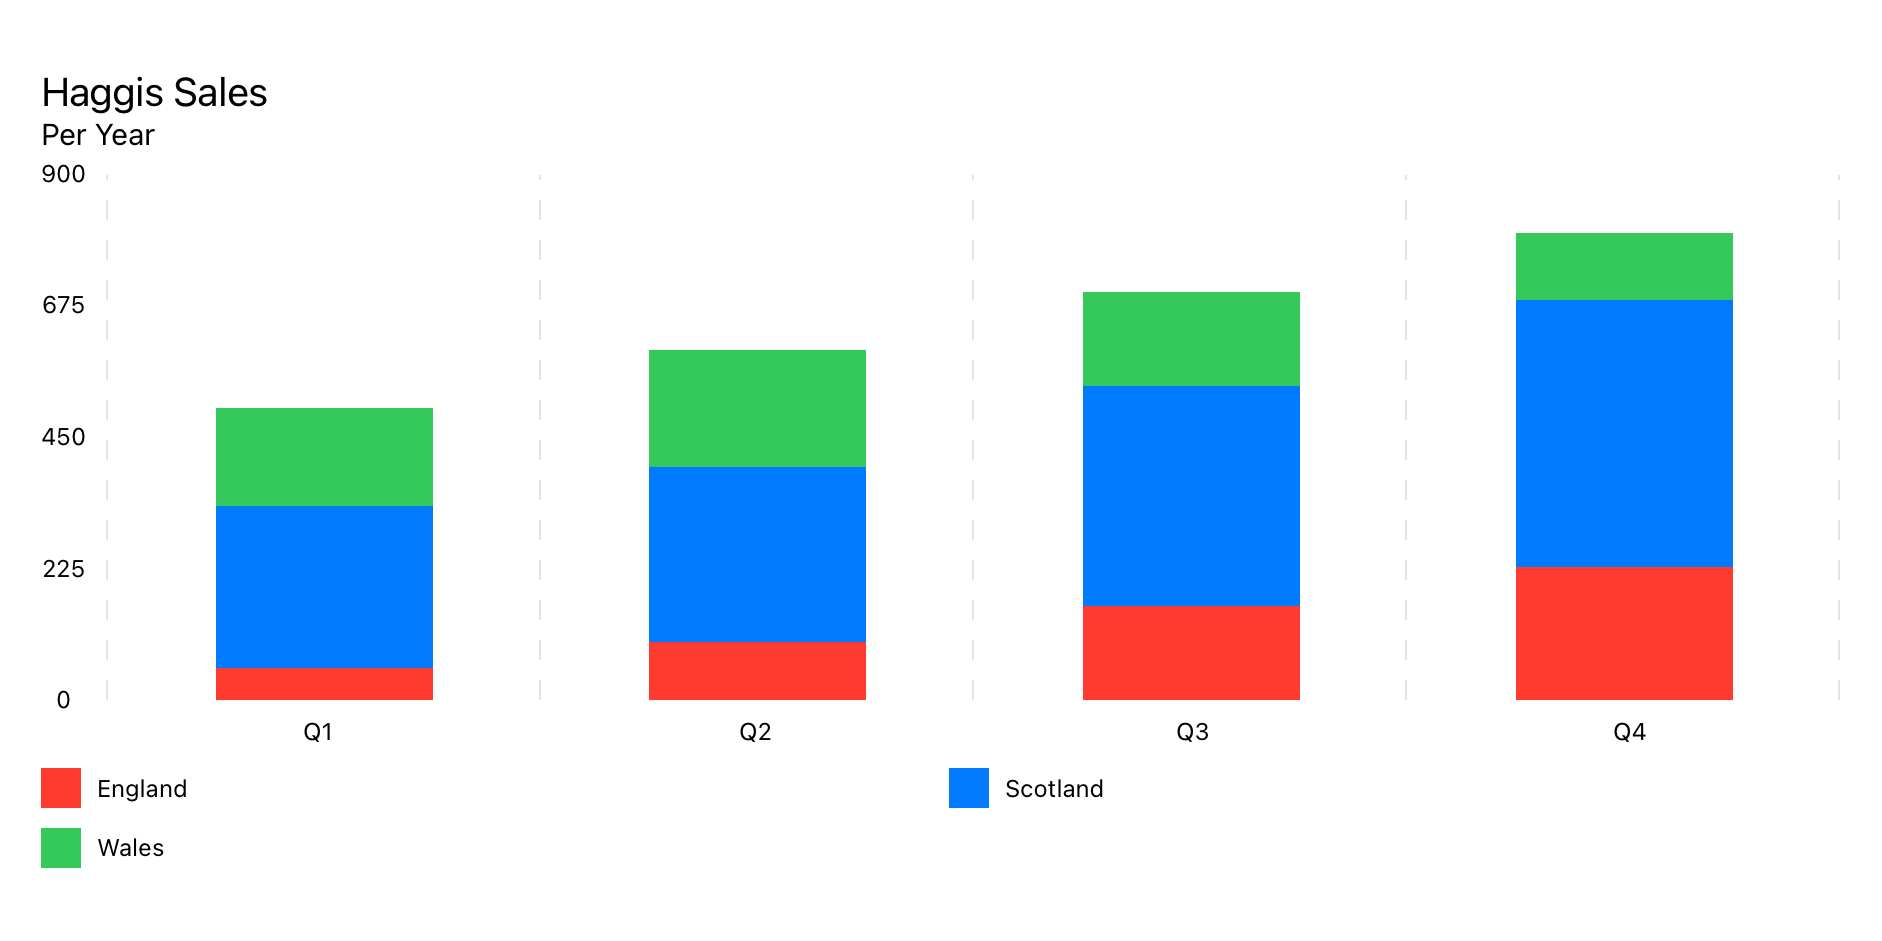
ใช้โมเดลข้อมูล StackedBarChartData
StackedBarChart ( chartData : StackedBarChartData )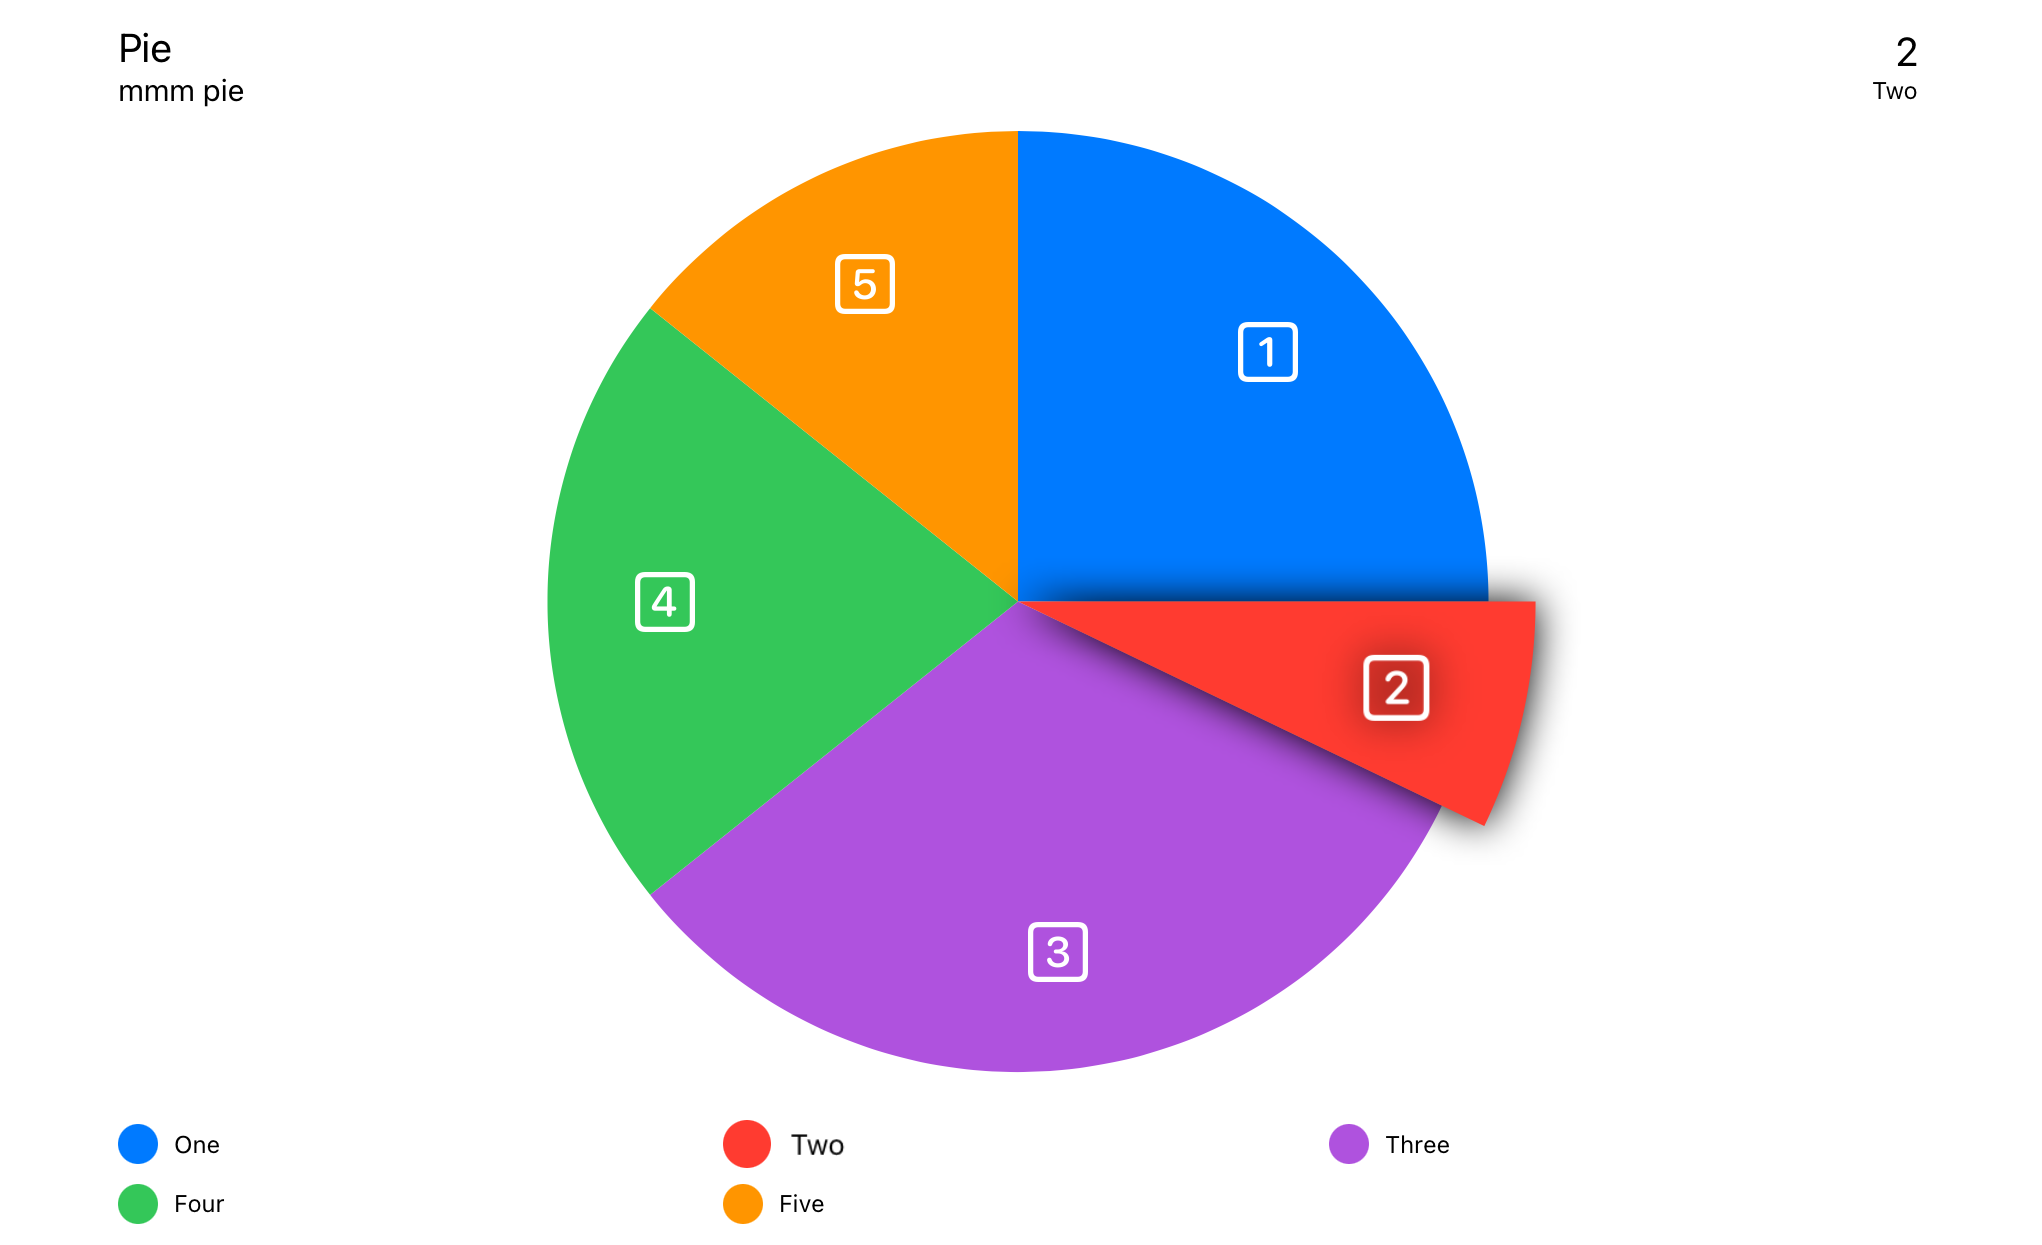
ใช้โมเดลข้อมูล PieChartData
PieChart ( chartData : PieChartData ) 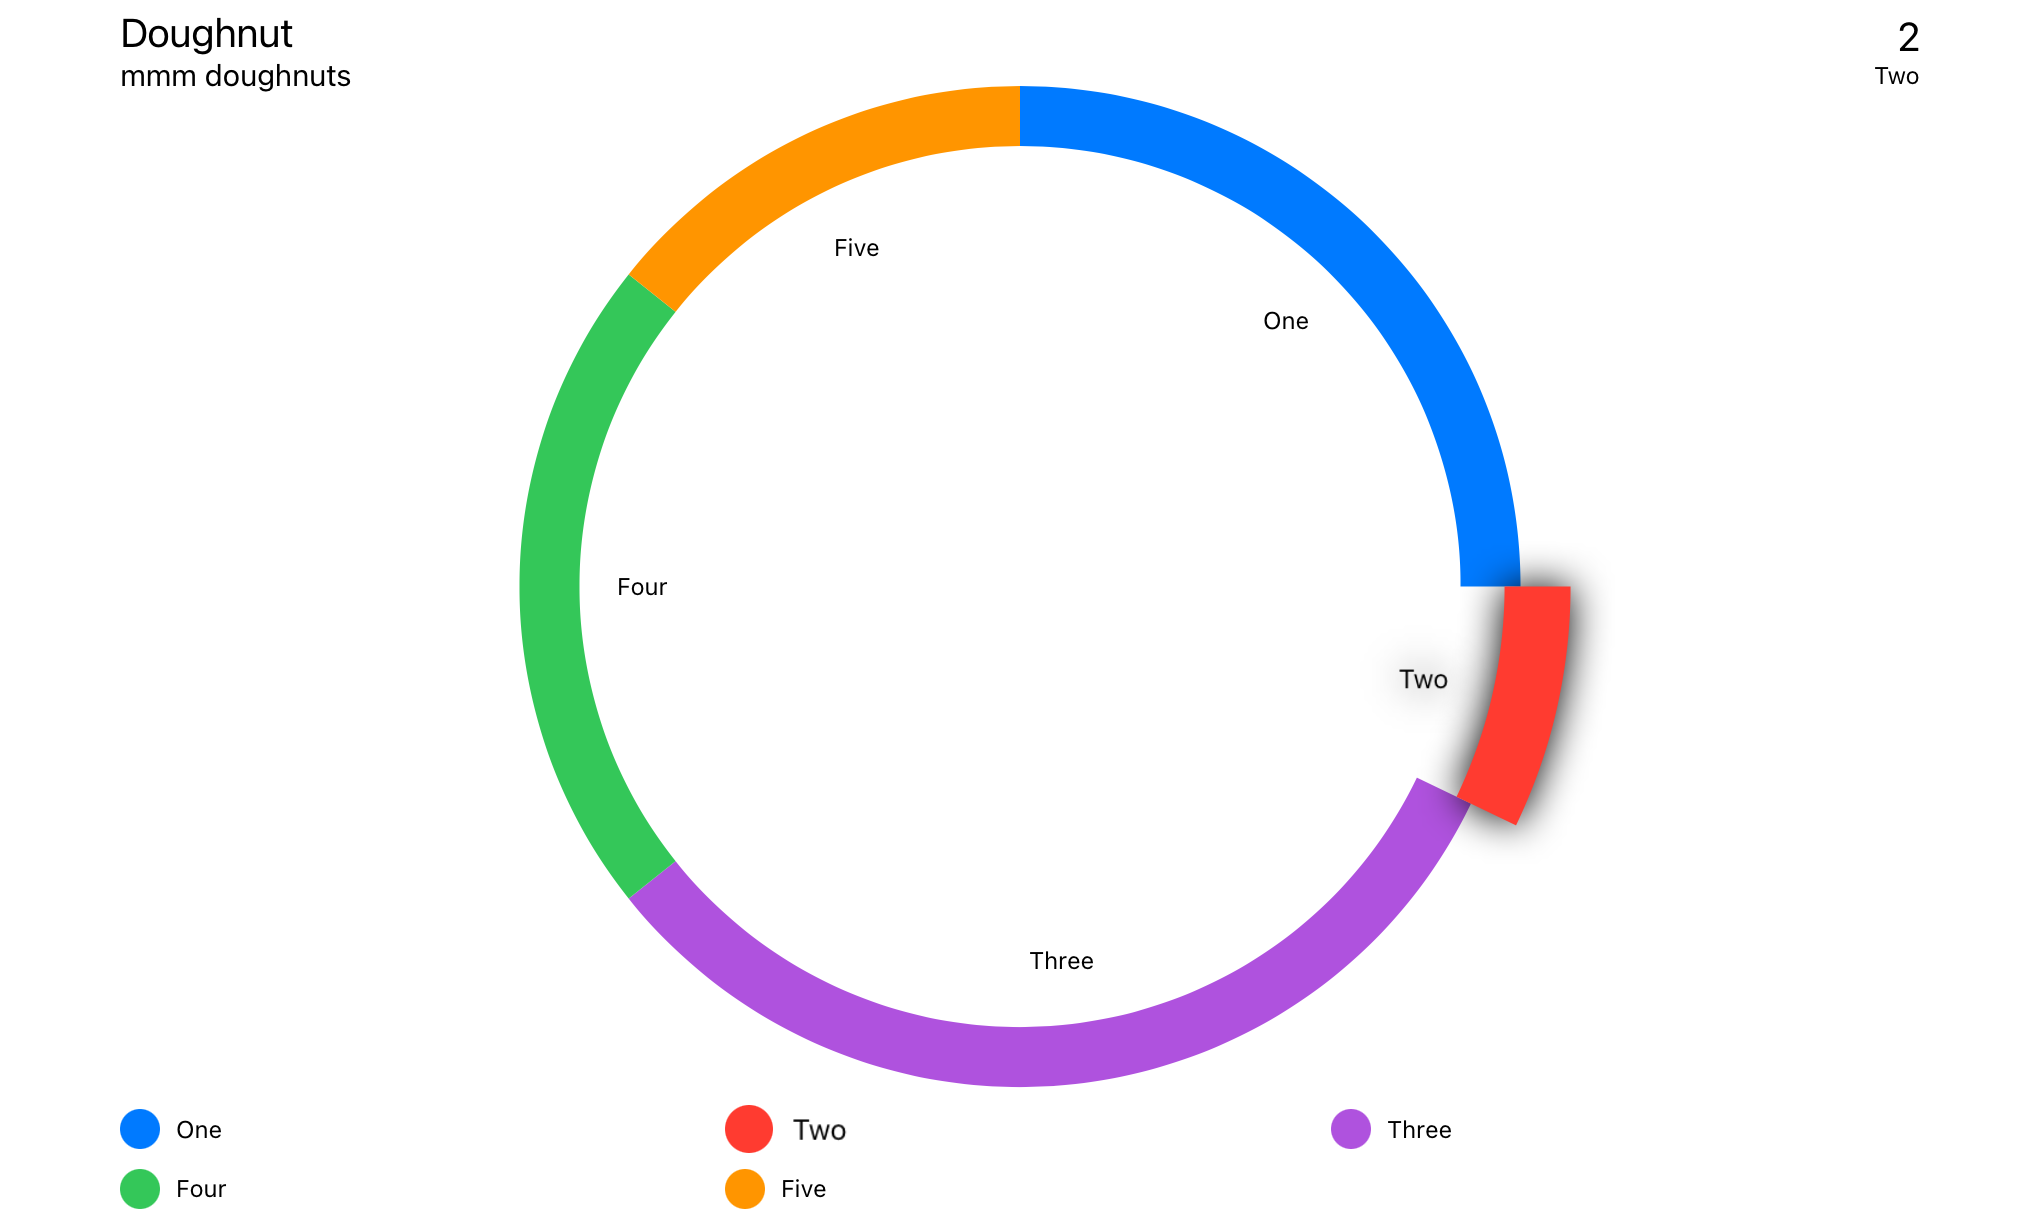
ใช้โมเดลข้อมูล DoughnutChartData
DoughnutChart ( chartData : DoughnutChartData ) Swift Package Manager
File > Swift Packages > Add Package Dependency...
import SwiftUICharts หากคุณมีปัญหากับมุมมองที่ไม่ได้อัปเดตอย่างถูกต้องให้เพิ่ม .id() ในมุมมองของคุณ
 LineChart ( chartData : LineChartData )
. id ( LineChartData . id ) สัมผัสซ้อนทับ
กล่องข้อมูล
กล่องข้อมูลลอยน้ำ
กล่องส่วนหัว
ตำนาน
เส้นเฉลี่ย
จุดดอกเบี้ยแกน y
กริดแกน x
y แกน y
ฉลากแกน x
ฉลากแกน y
เส้นแนวโน้มเชิงเส้น
เครื่องหมายจุด
ลำดับของตัวดัดแปลงมุมมองเป็นสิ่งที่สำคัญเช่นเดียวกับตัวดัดแปลงเป็นสแต็คประเภทต่าง ๆ ที่พันรอบมุมมองก่อนหน้า
ตรวจจับอินพุตจากการสัมผัสของตัวชี้ ค้นหาจุดข้อมูลที่ใกล้ที่สุดและแสดงข้อมูลที่เกี่ยวข้องตามที่ระบุไว้
ตำแหน่งของกล่องข้อมูลถูกตั้งค่าใน ChartStyle -> infoBoxPlacement
. touchOverlay ( chartData : CTChartData , specifier : String , unit : TouchUnit )การตั้งค่าภายในข้อมูลแผนภูมิ -> สไตล์แผนภูมิ
แสดงข้อมูลจากการซ้อนทับแบบสัมผัสหากตั้งค่า InfoBoxPlacement เป็น .infoBox
ตำแหน่งของกล่องข้อมูลถูกตั้งค่าใน ChartStyle -> infoBoxPlacement
. infoBox ( chartData : CTChartData ) แสดงข้อมูลจากการซ้อนทับแบบสัมผัสหากตั้งค่า InfoBoxPlacement เป็น .floating floating
ตำแหน่งของกล่องข้อมูลถูกตั้งค่าใน ChartStyle -> infoBoxPlacement
. floatingInfoBox ( chartData : CTChartData ) แสดงข้อมูลเมตาเกี่ยวกับแผนภูมิที่ตั้งอยู่ใน Chart Data -> ChartMetadata
แสดงข้อมูลจากการซ้อนทับแบบสัมผัสหากตั้งค่า InfoBoxPlacement เป็น .header
ตำแหน่งของกล่องข้อมูลถูกตั้งค่าใน ChartStyle -> infoBoxPlacement
. headerBox ( chartData : CTChartData ) แสดงตำนาน
. legends ( )วางเครื่องหมายเหนือแต่ละจุดข้อมูล
แสดงบรรทัดเครื่องหมายที่ค่าเฉลี่ยของจุดข้อมูลทั้งหมด
 . averageLine ( chartData : CTLineBarChartDataProtocol ,
             markerName : " Average " ,
             labelPosition : . yAxis ( specifier : " %.0f " ) ,
             lineColour : . primary ,
strokeStyle : StrokeStyle ( lineWidth : 3 , dash : [ 5 , 10 ] ) )จุดที่น่าสนใจที่กำหนดค่าได้
 . yAxisPOI ( chartData : CTLineBarChartDataProtocol ,
          markerName : " Marker " ,
          markerValue : 123 ,
          labelPosition : . center ( specifier : " %.0f " ) ,
          labelColour : Color . black ,
          labelBackground : Color . orange ,
          lineColour : Color . orange ,
strokeStyle : StrokeStyle ( lineWidth : 3 , dash : [ 5 , 10 ] ) )เพิ่มเส้นแนวตั้งตามแกน x
. xAxisGrid ( chartData : CTLineBarChartDataProtocol ) การตั้งค่าภายใน ChartData -> ChartStyle
เพิ่มเส้นแนวนอนตามแกน y
. yAxisGrid ( chartData : CTLineBarChartDataProtocol ) การตั้งค่าภายใน ChartData -> ChartStyle
ป้ายกำกับสำหรับแกน x
. xAxisLabels ( chartData : CTLineBarChartDataProtocol ) การตั้งค่าภายใน ChartData -> ChartStyle
ฉลากที่สร้างขึ้นโดยอัตโนมัติสำหรับแกน y
. yAxisLabels ( chartData : CTLineBarChartDataProtocol , specifier : " %.0f " ) การตั้งค่าภายใน ChartData -> ChartStyle
yaxislabeltype:
case numeric // Auto generated, numeric labels.
case custom // Custom labels array
กำหนดเองถูกตั้งค่าจาก ChartData -> yAxisLabels
บรรทัดข้ามแผนภูมิเพื่อแสดงแนวโน้มในข้อมูล
 . linearTrendLine ( chartData : CTLineBarChartDataProtocol ,
                 firstValue : Double ,
                 lastValue : Double ,
                 lineColour : ColourStyle ,
strokeStyle : StrokeStyle )วางเครื่องหมายเหนือแต่ละจุดข้อมูล
. pointMarkers ( chartData : CTLineChartDataProtocol ) การตั้งค่าภายใน Data Set -> PointStyle
เพิ่มสายอิสระที่ด้านบนของ FullLineChart
 . filledTopLine ( chartData : LineChartData ,
               lineColour : ColourStyle ,
               strokeStyle : StrokeStyle )
อนุญาตให้มีสายแข็งเหนือจุดข้อมูลด้วยการเติมกึ่งทึบแสงกึ่งทึบแสง
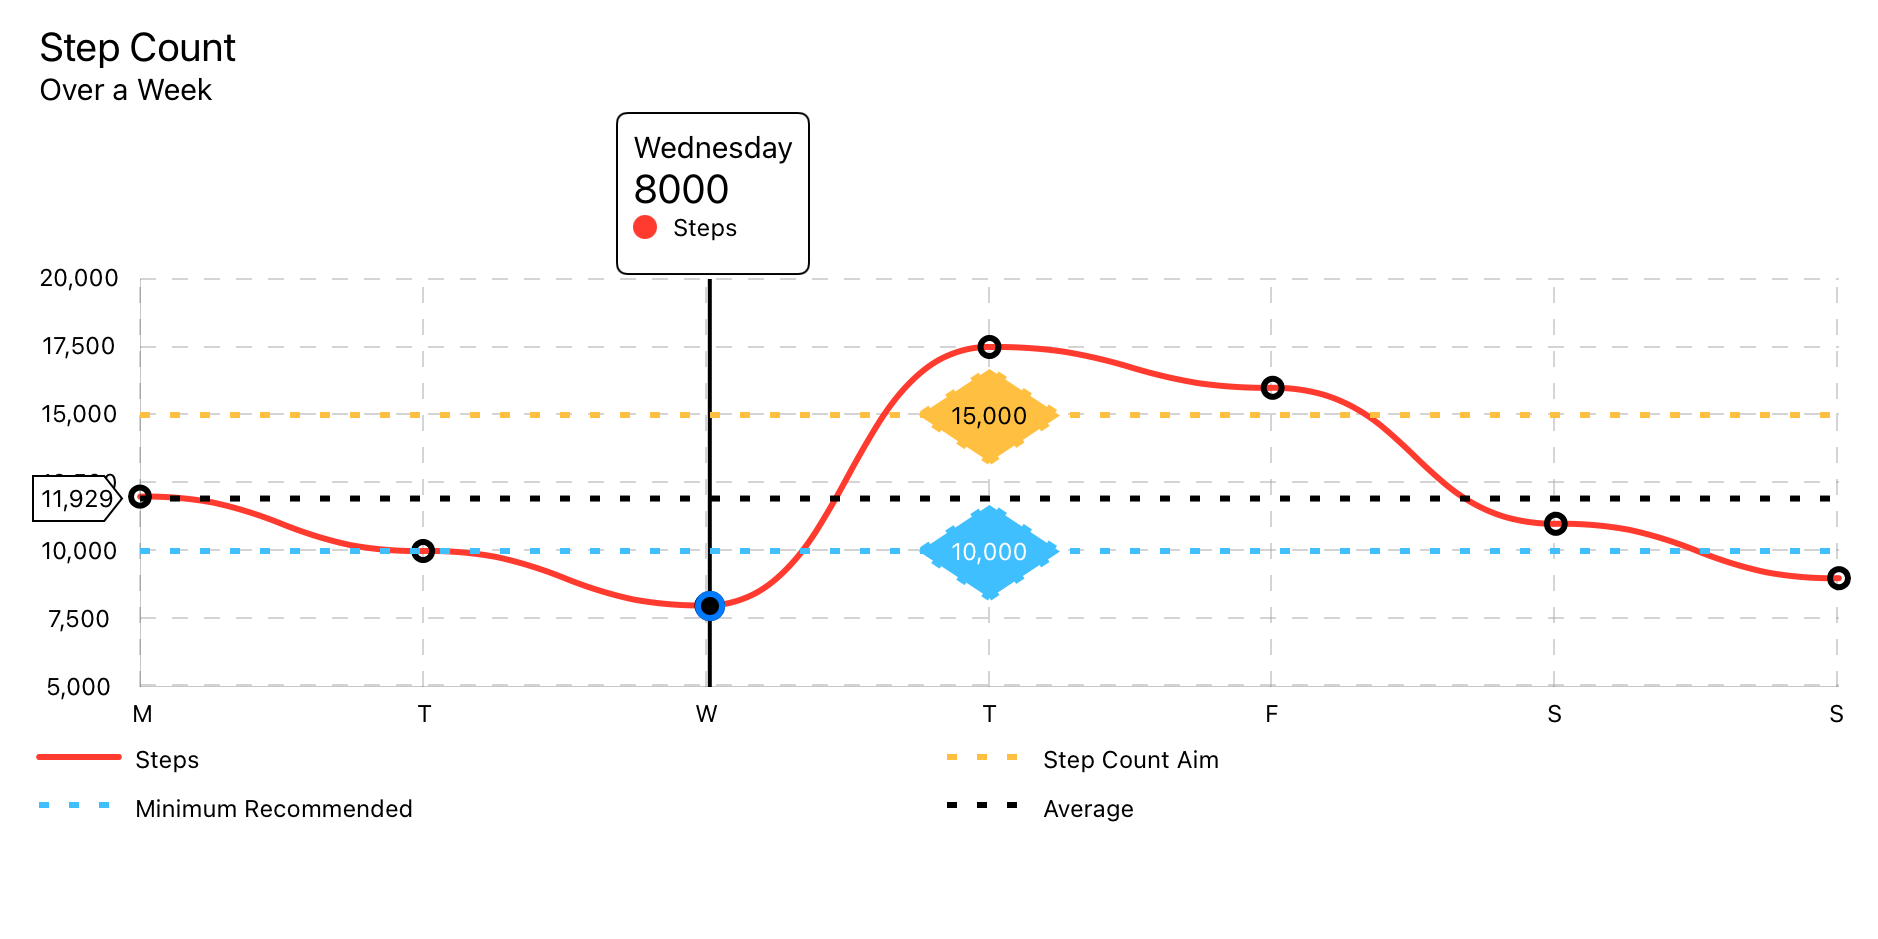
 struct LineChartDemoView : View {

    let data : LineChartData = weekOfData ( )

    var body : some View {
        VStack {
            LineChart ( chartData : data )
                . pointMarkers ( chartData : data )
                . touchOverlay ( chartData : data , specifier : " %.0f " )
                . yAxisPOI ( chartData : data ,
                          markerName : " Step Count Aim " ,
                          markerValue : 15_000 ,
                          labelPosition : . center ( specifier : " %.0f " ) ,
                          labelColour : Color . black ,
                          labelBackground : Color ( red : 1.0 , green : 0.75 , blue : 0.25 ) ,
                          lineColour : Color ( red : 1.0 , green : 0.75 , blue : 0.25 ) ,
                          strokeStyle : StrokeStyle ( lineWidth : 3 , dash : [ 5 , 10 ] ) )
                . yAxisPOI ( chartData : data ,
                          markerName : " Minimum Recommended " ,
                          markerValue : 10_000 ,
                          labelPosition : . center ( specifier : " %.0f " ) ,
                          labelColour : Color . white ,
                          labelBackground : Color ( red : 0.25 , green : 0.75 , blue : 1.0 ) ,
                          lineColour : Color ( red : 0.25 , green : 0.75 , blue : 1.0 ) ,
                          strokeStyle : StrokeStyle ( lineWidth : 3 , dash : [ 5 , 10 ] ) )
                . averageLine ( chartData : data ,
                             strokeStyle : StrokeStyle ( lineWidth : 3 , dash : [ 5 , 10 ] ) )
                . xAxisGrid ( chartData : data )
                . yAxisGrid ( chartData : data )
                . xAxisLabels ( chartData : data )
                . yAxisLabels ( chartData : data )
                . infoBox ( chartData : data )
                . headerBox ( chartData : data )
                . legends ( chartData : data , columns : [ GridItem ( . flexible ( ) ) , GridItem ( . flexible ( ) ) ] )
                . id ( data . id )
                . frame ( minWidth : 150 , maxWidth : 900 , minHeight : 150 , idealHeight : 250 , maxHeight : 400 , alignment : . center )
        }
        . navigationTitle ( " Week of Data " )
    }

    static func weekOfData ( ) -> LineChartData {
        let data = LineDataSet ( dataPoints : [
            LineChartDataPoint ( value : 12000 , xAxisLabel : " M " , description : " Monday " ) ,
            LineChartDataPoint ( value : 10000 , xAxisLabel : " T " , description : " Tuesday " ) ,
            LineChartDataPoint ( value : 8000 ,  xAxisLabel : " W " , description : " Wednesday " ) ,
            LineChartDataPoint ( value : 17500 , xAxisLabel : " T " , description : " Thursday " ) ,
            LineChartDataPoint ( value : 16000 , xAxisLabel : " F " , description : " Friday " ) ,
            LineChartDataPoint ( value : 11000 , xAxisLabel : " S " , description : " Saturday " ) ,
            LineChartDataPoint ( value : 9000 ,  xAxisLabel : " S " , description : " Sunday " )
        ] ,
        legendTitle : " Steps " ,
        pointStyle : PointStyle ( ) ,
        style : LineStyle ( lineColour : ColourStyle ( colour : . red ) , lineType : . curvedLine ) )

        let metadata   = ChartMetadata ( title : " Step Count " , subtitle : " Over a Week " )

        let gridStyle  = GridStyle ( numberOfLines : 7 ,
                                   lineColour   : Color ( . lightGray ) . opacity ( 0.5 ) ,
                                   lineWidth    : 1 ,
                                   dash         : [ 8 ] ,
                                   dashPhase    : 0 )

        let chartStyle = LineChartStyle ( infoBoxPlacement    : . infoBox ( isStatic : false ) ,
                                        infoBoxBorderColour : Color . primary ,
                                        infoBoxBorderStyle  : StrokeStyle ( lineWidth : 1 ) ,

                                        markerType          : . vertical ( attachment : . line ( dot : . style ( DotStyle ( ) ) ) ) ,

                                        xAxisGridStyle      : gridStyle ,
                                        xAxisLabelPosition  : . bottom ,
                                        xAxisLabelColour    : Color . primary ,
                                        xAxisLabelsFrom     : . dataPoint ( rotation : . degrees ( 0 ) ) ,

                                        yAxisGridStyle      : gridStyle ,
                                        yAxisLabelPosition  : . leading ,
                                        yAxisLabelColour    : Color . primary ,
                                        yAxisNumberOfLabels : 7 ,

                                        baseline            : . minimumWithMaximum ( of : 5000 ) ,
                                        topLine             : . maximum ( of : 20000 ) ,

                                        globalAnimation     : . easeOut ( duration : 1 ) )

        return LineChartData ( dataSets       : data ,
                             metadata       : metadata ,
                             chartStyle     : chartStyle )

    }
}ภายในองค์ประกอบบางอย่างเป็นแท็กเพิ่มเติมเพื่อช่วยอธิบายแผนภูมิสำหรับการพากย์เสียง
ดูการแปลภาษาท้องถิ่นของการเข้าถึง
ป้ายกำกับทั้งหมดสนับสนุนการแปล อย่างไรก็ตามมีฉลากซ่อนเร้นบางตัวที่อยู่ที่นั่นเพื่อสนับสนุนการพากย์เสียง ดูการแปลภาษาท้องถิ่นของการเข้าถึง
ดูการสาธิตการแปลในโครงการสาธิต
เสียงคำอธิบายของ datapoint เมื่อผู้ใช้สัมผัสพื้นที่ใกล้กับจุดข้อมูลมากที่สุด เสียงพากย์จะบอกว่า <chart title>, <data point value>, <data point description>
" %@ <local_description_of_a_data_point> " = " %@, <Description of a data point> " ; อ่านก่อน poiMarker เสียงพากย์จะบอกว่า <poi marker>, <marker legend title>, <marker value>
 " P-O-I-Marker " = " P O I Marker " ;
" Average " = " Average " ;
เสียงคำอธิบายของ poiMarker เสียงพากย์จะบอกว่า <POI-Marker>, <marker legend title>, <marker value>
" <local_marker_legend_title> %@ " = " local_marker_legend_title, %@ " ; อ่านก่อน axisLabel เสียงพากย์จะบอกว่า <axisLabel>, <marker value>
 "X-Axis-Label" = "X Axis Label";
"Y-Axis-Label" = "Y Axis Label";
อ่านก่อน legend เสียงพากย์จะบอกว่า <chart type legend>, <legend title>
 " Line-Chart-Legend " = " Line Chart Legend " ;
" P-O-I-Marker-Legend " = " P O I Marker Legend " ;
" Bar-Chart-Legend " = " Bar Chart Legend " ;
" P-O-I-Marker-Legend " = " P O I Marker Legend " ;
" Pie-Chart-Legend " = " Pie Chart Legend " ;
" P-O-I-Marker-Legend " = " P O I Marker Legend " ;

