SwiftUICharts
v2.10.3
A Diagramme / Ploting -Bibliothek für Swiftui. Arbeitet auf MacOS, iOS, Watchos und TVOS und verfügt über integrierte Funktionen für Zugangs- und Lokalisierungsfunktionen.
Demo -Projekt
Dokumentation
Arbeiten an einer Version 3 mit einem Swiftui -Gefühl für die API.
Zeilendiagramm
Ausgefüllte Zeilendiagramm
Multi -Line -Diagramm
Fernleitungsdiagramm
Balkendiagramm
Kabine
Gruppierter Balkendiagramm
Stapelte Balkendiagramm
Kreisdiagramm
Donut -Diagramm
Verwendet das LineChartData -Datenmodell.
LineChart ( chartData : LineChartData ) 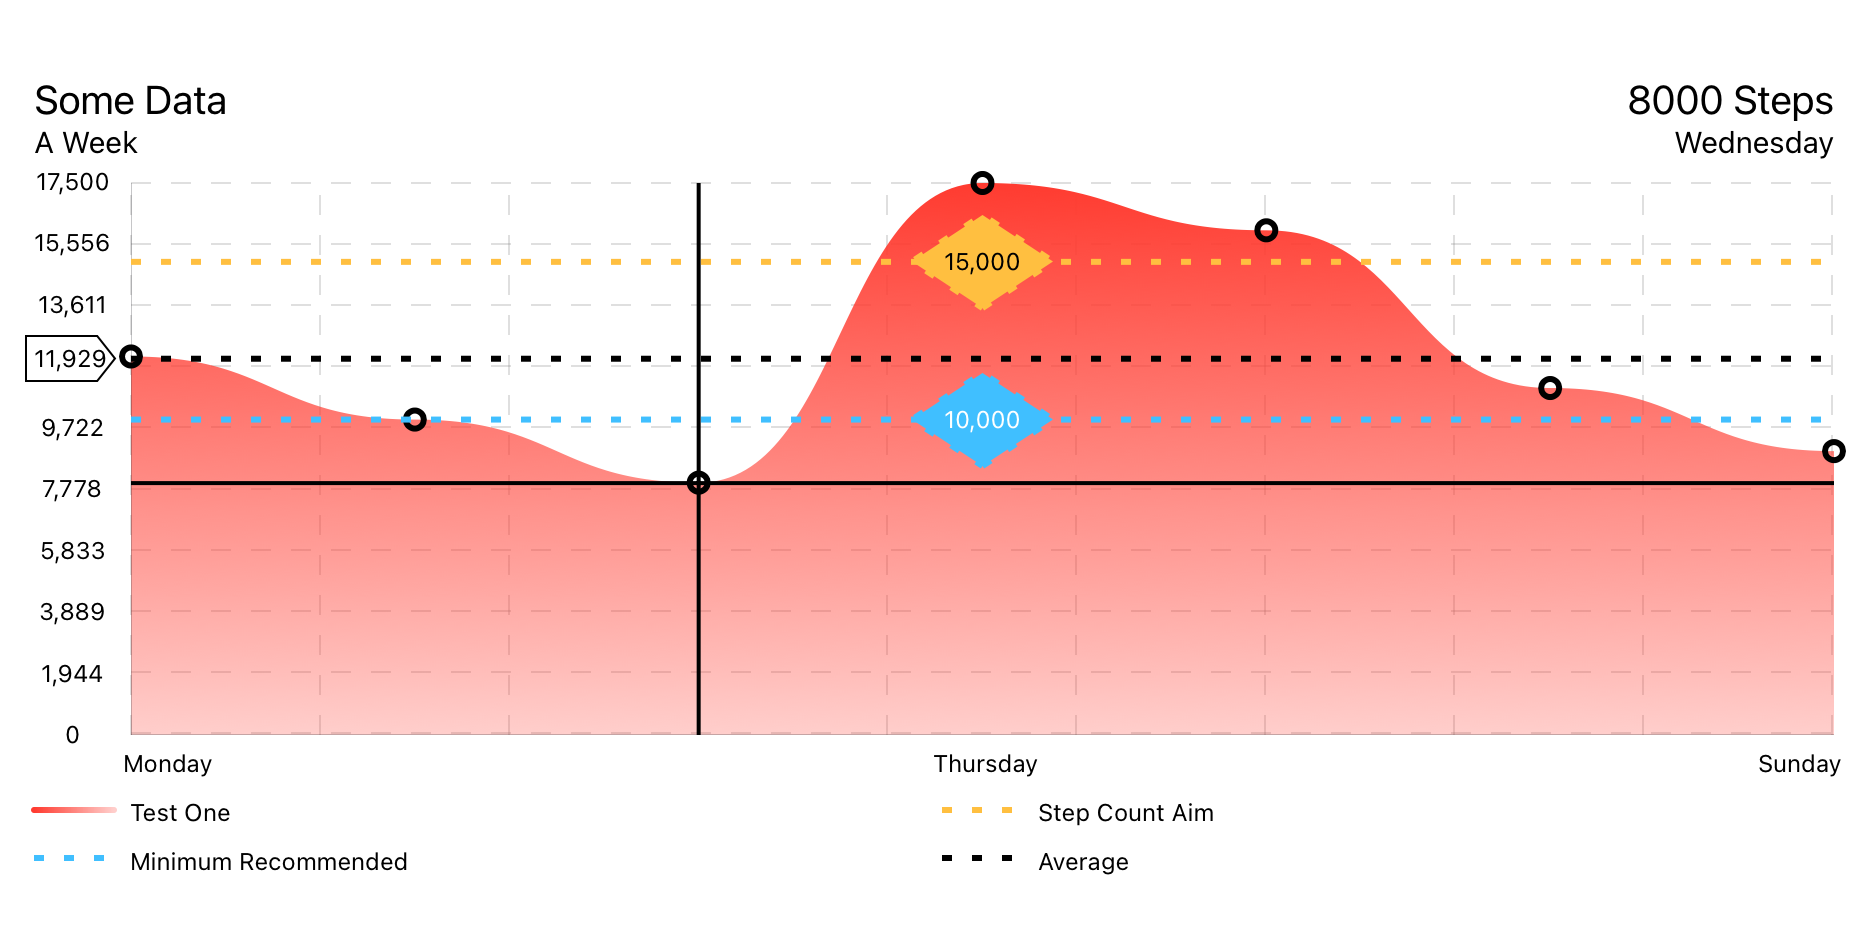
Verwendet das LineChartData -Datenmodell.
FilledLineChart ( chartData : LineChartData ) 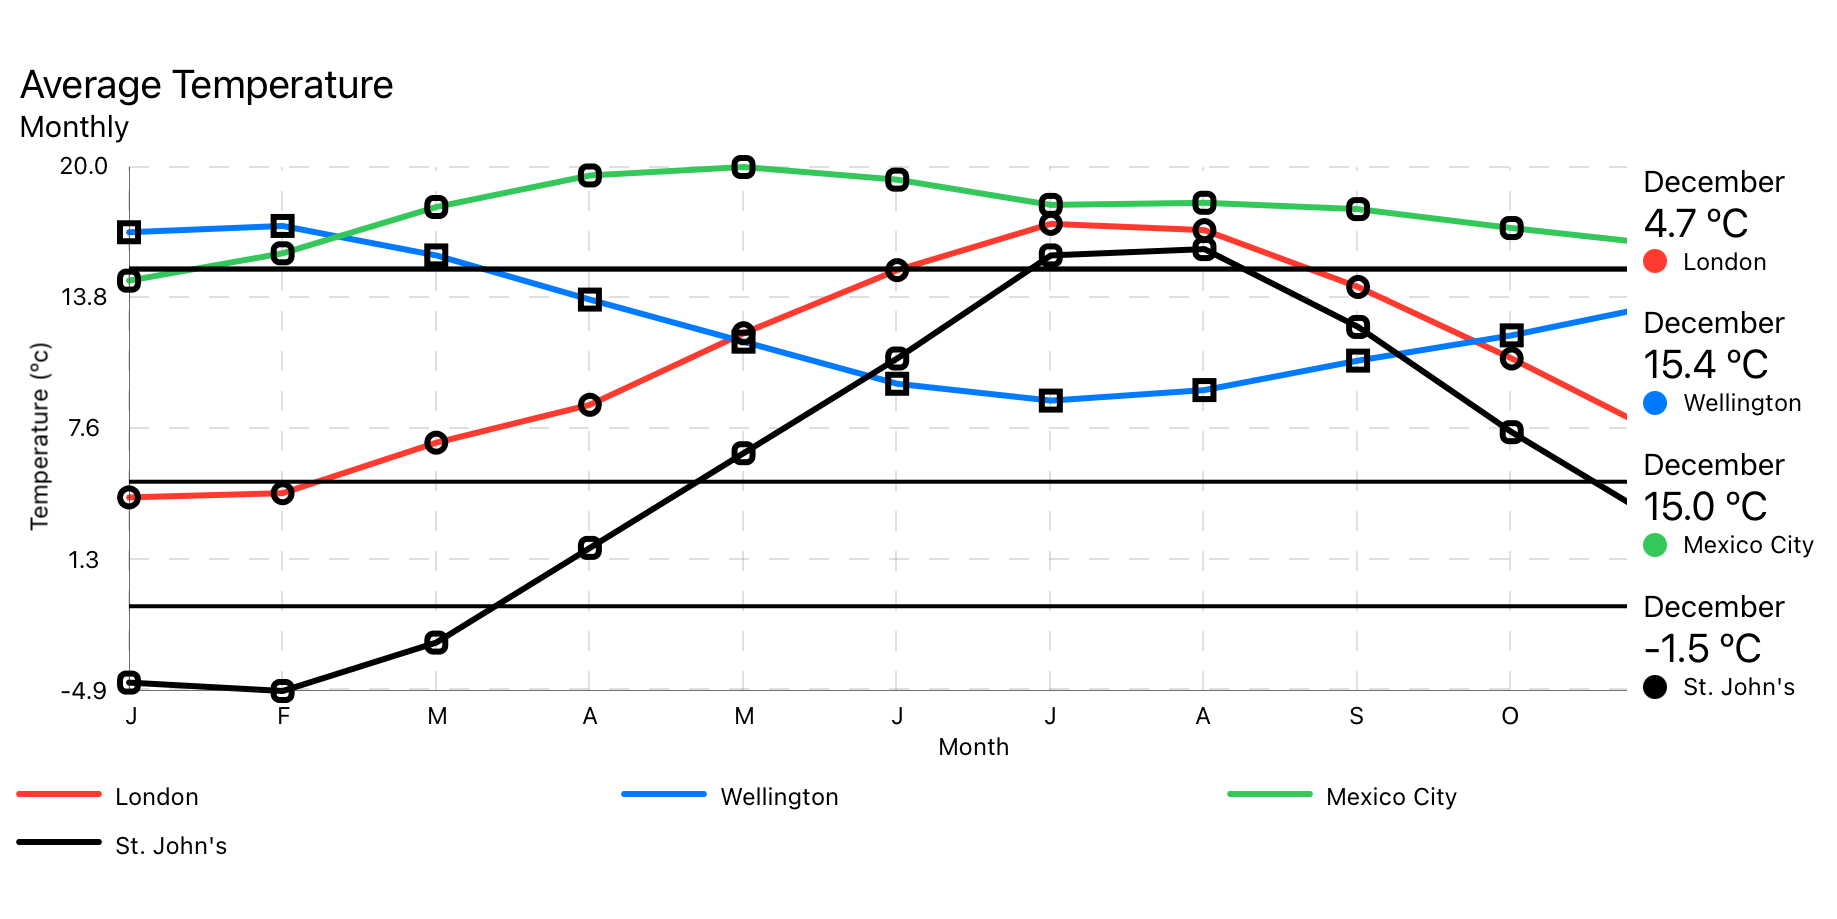
Verwendet ein MultiLineChartData -Datenmodell.
MultiLineChart ( chartData : MultiLineChartData ) 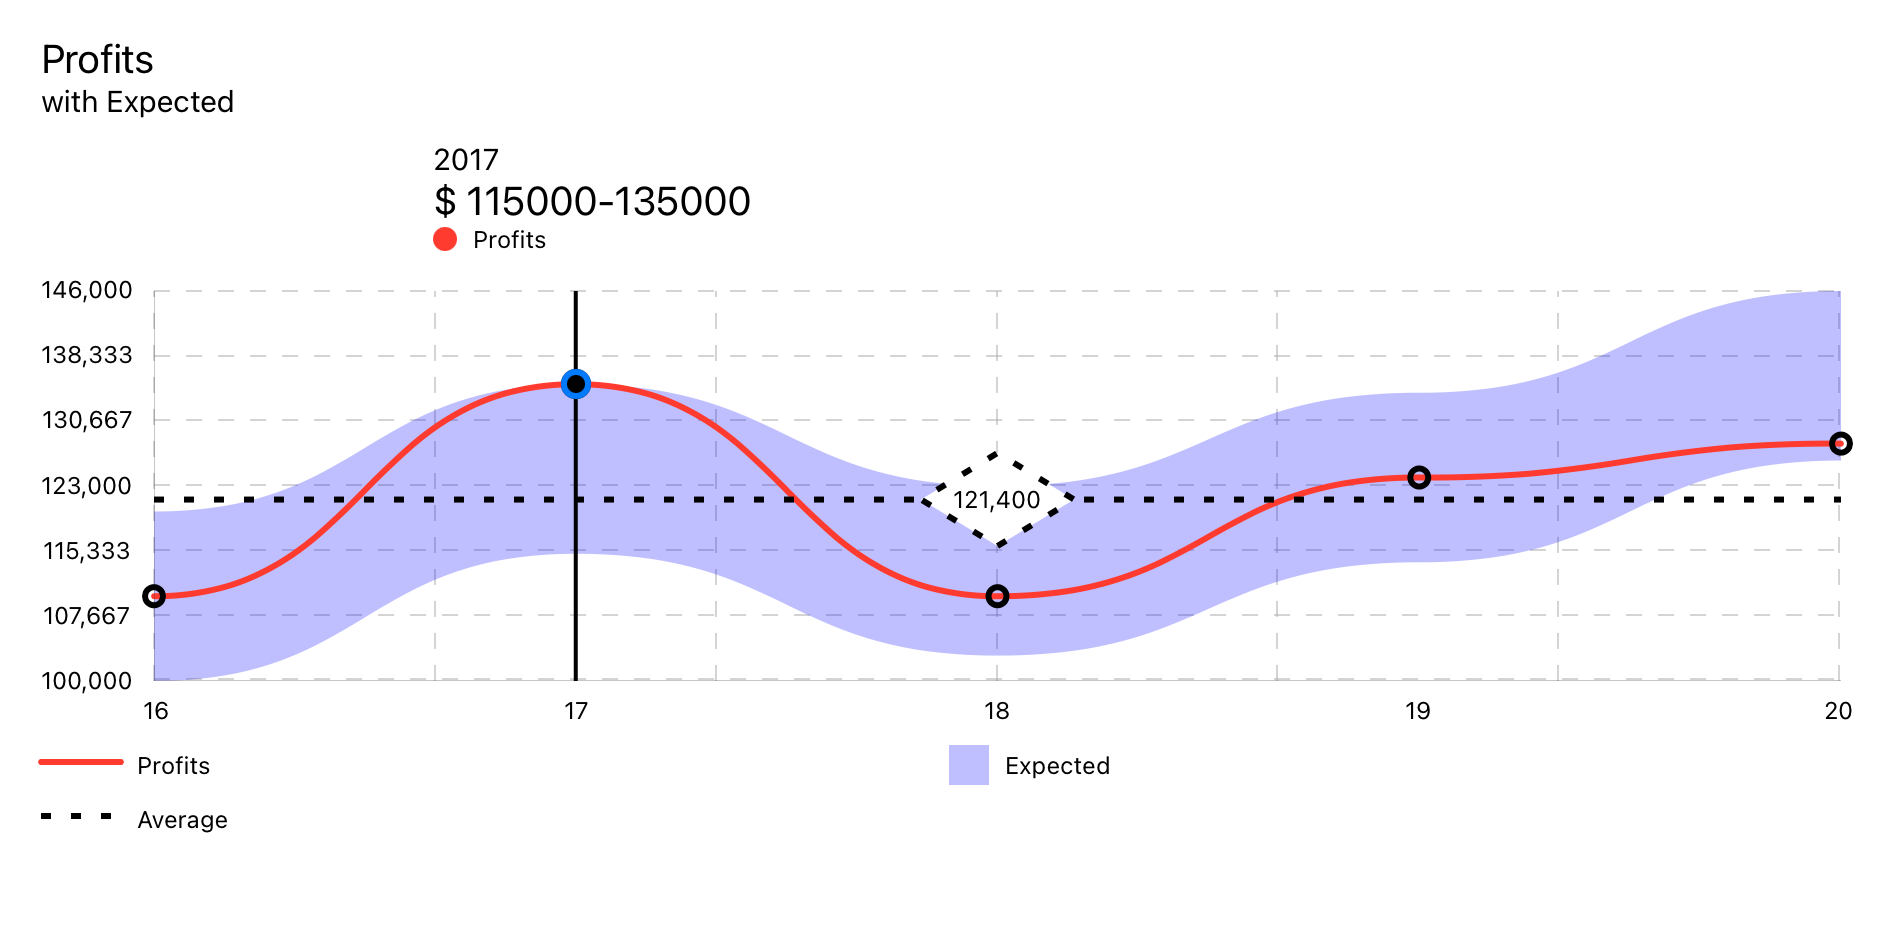
Verwendet RangedLineChart -Datenmodell.
RangedLineChart ( chartData : RangedLineChartData )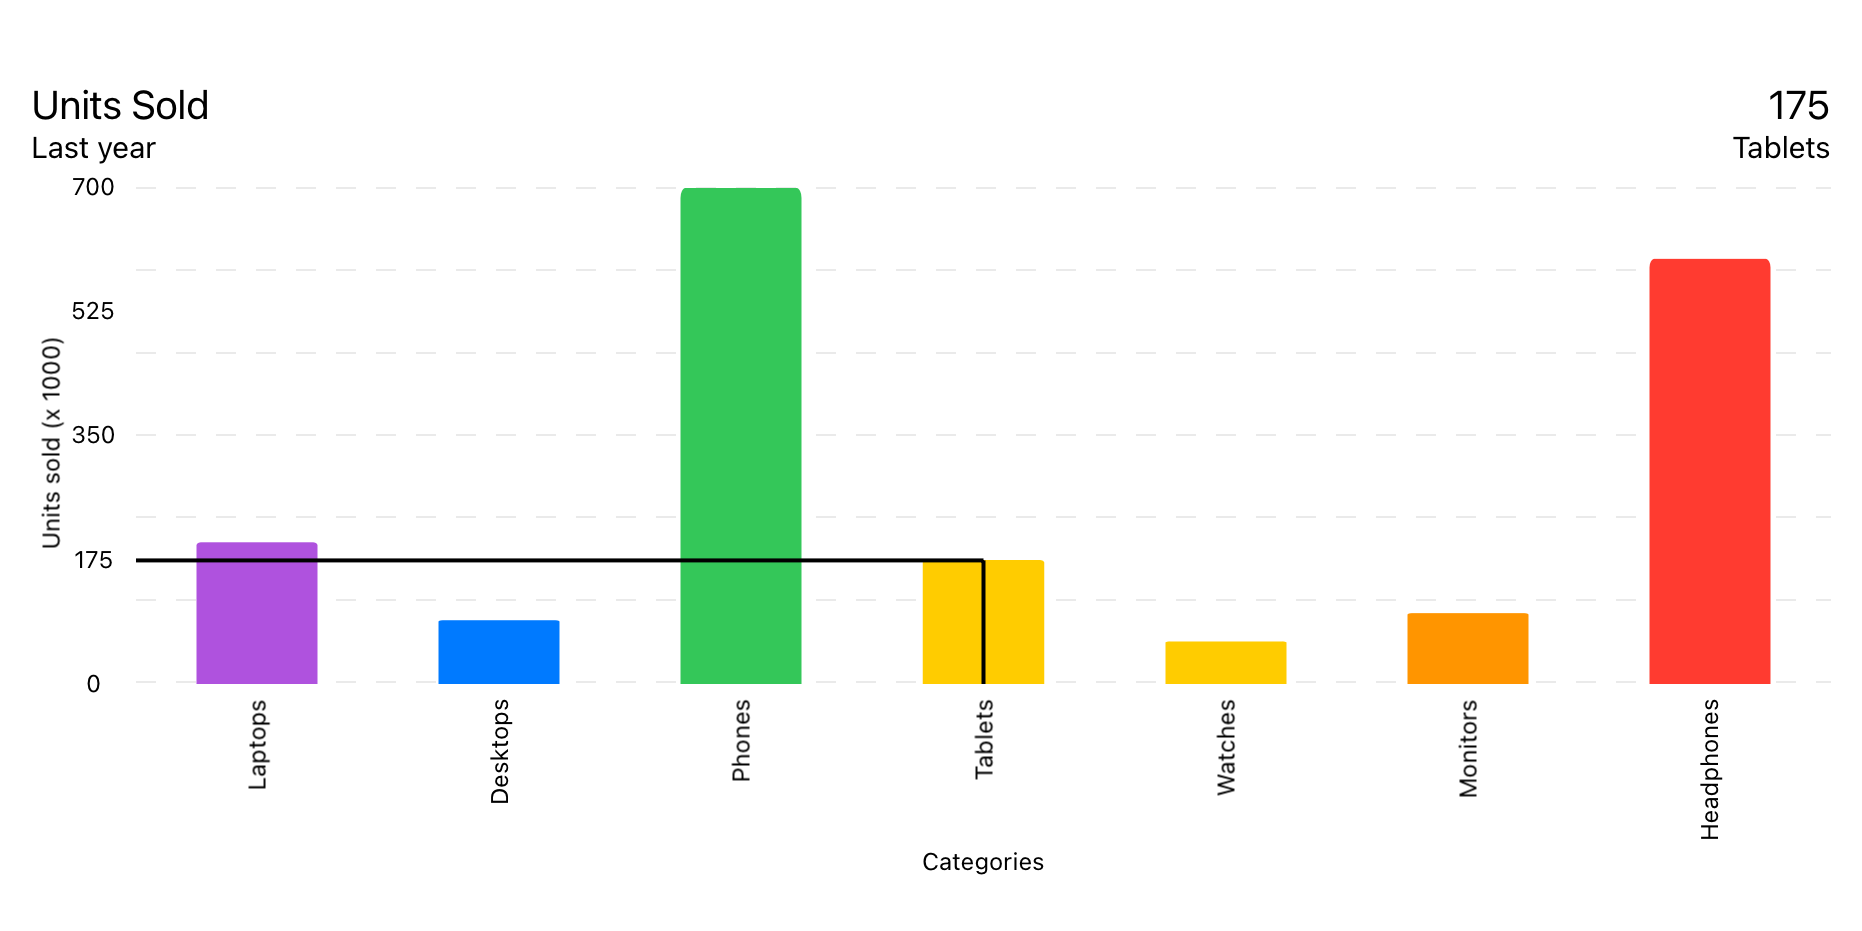
Verwendet das BarChartData -Datenmodell.
BarChart ( chartData : BarChartData ) 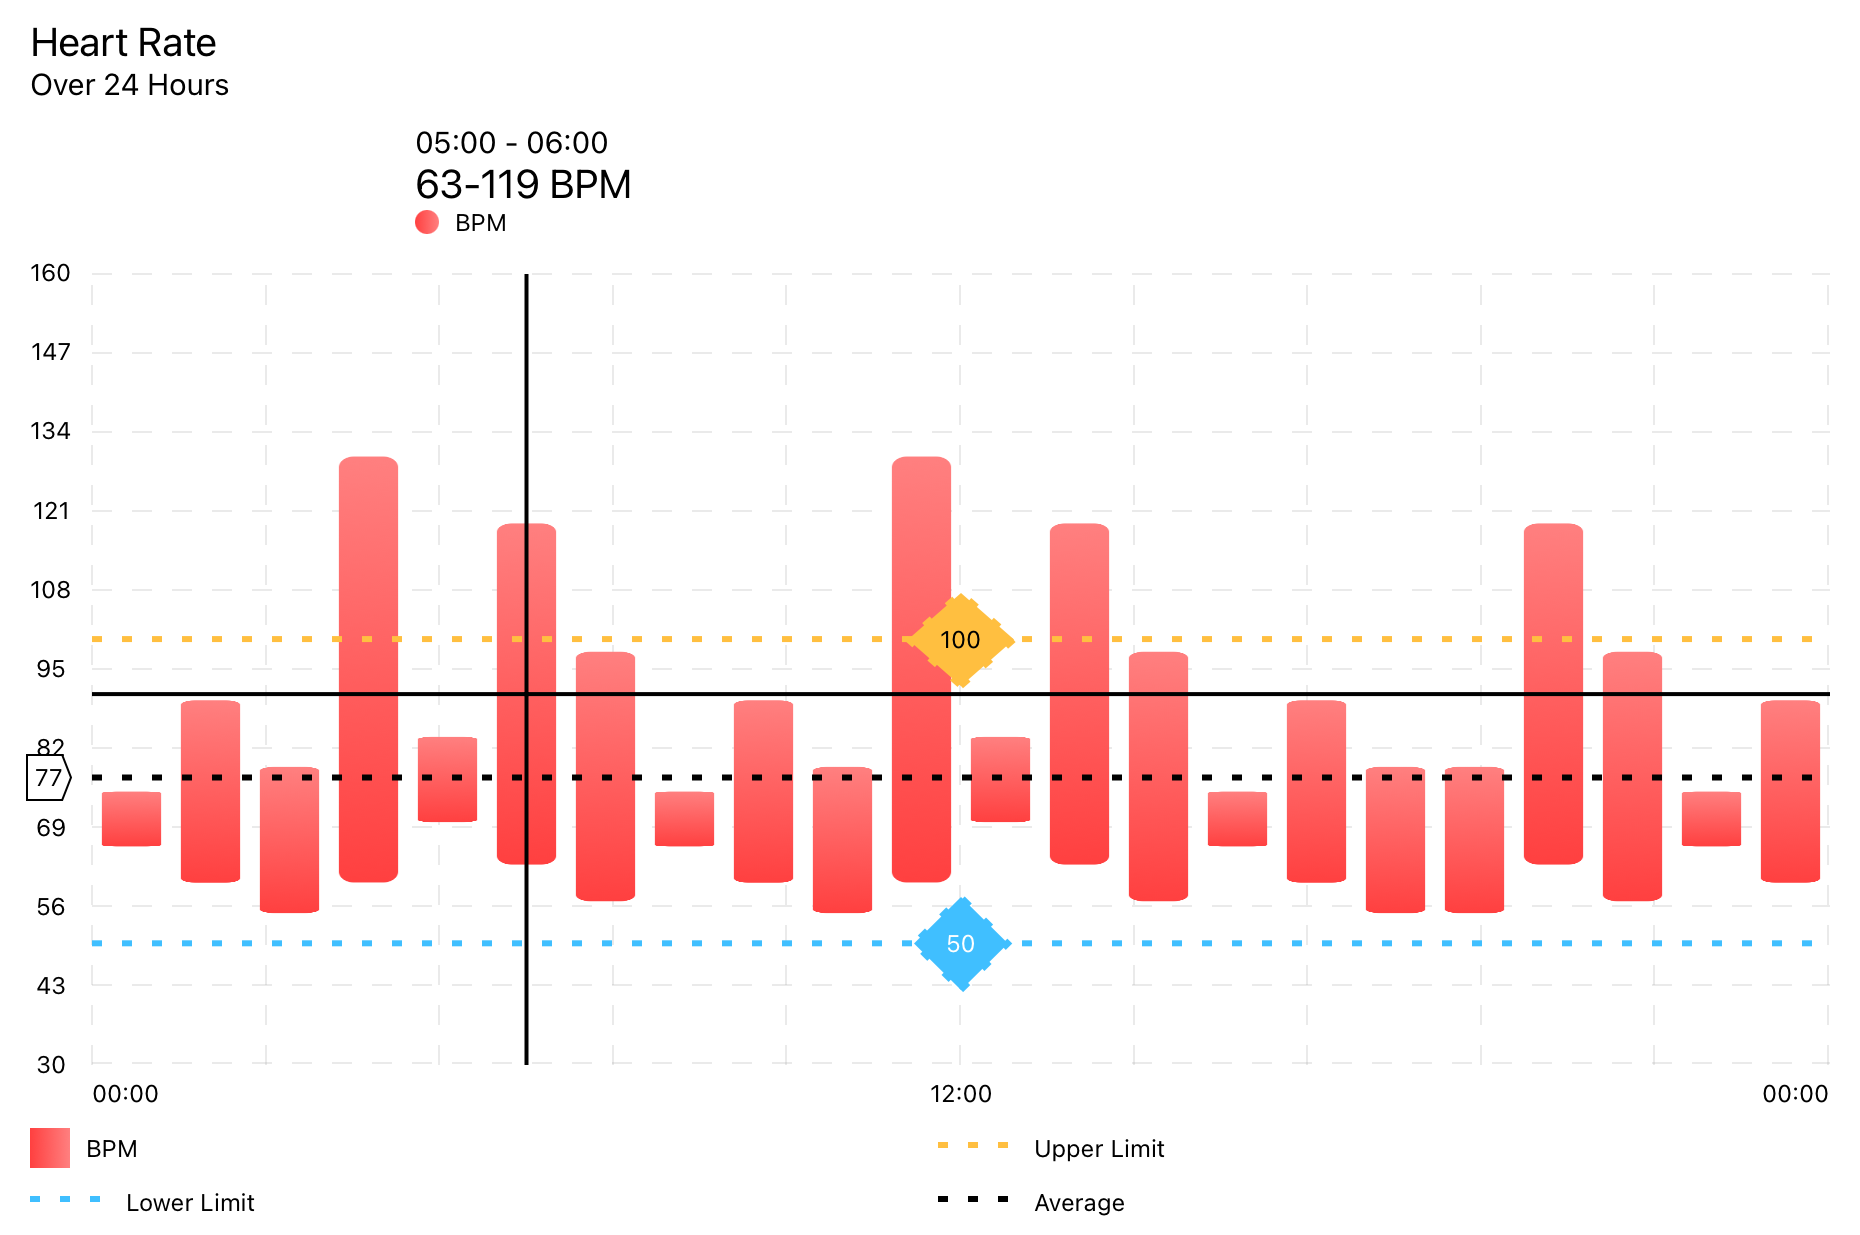
Verwendet RangedBarChartData -Datenmodell.
RangedBarChart ( chartData : RangedBarChartData ) 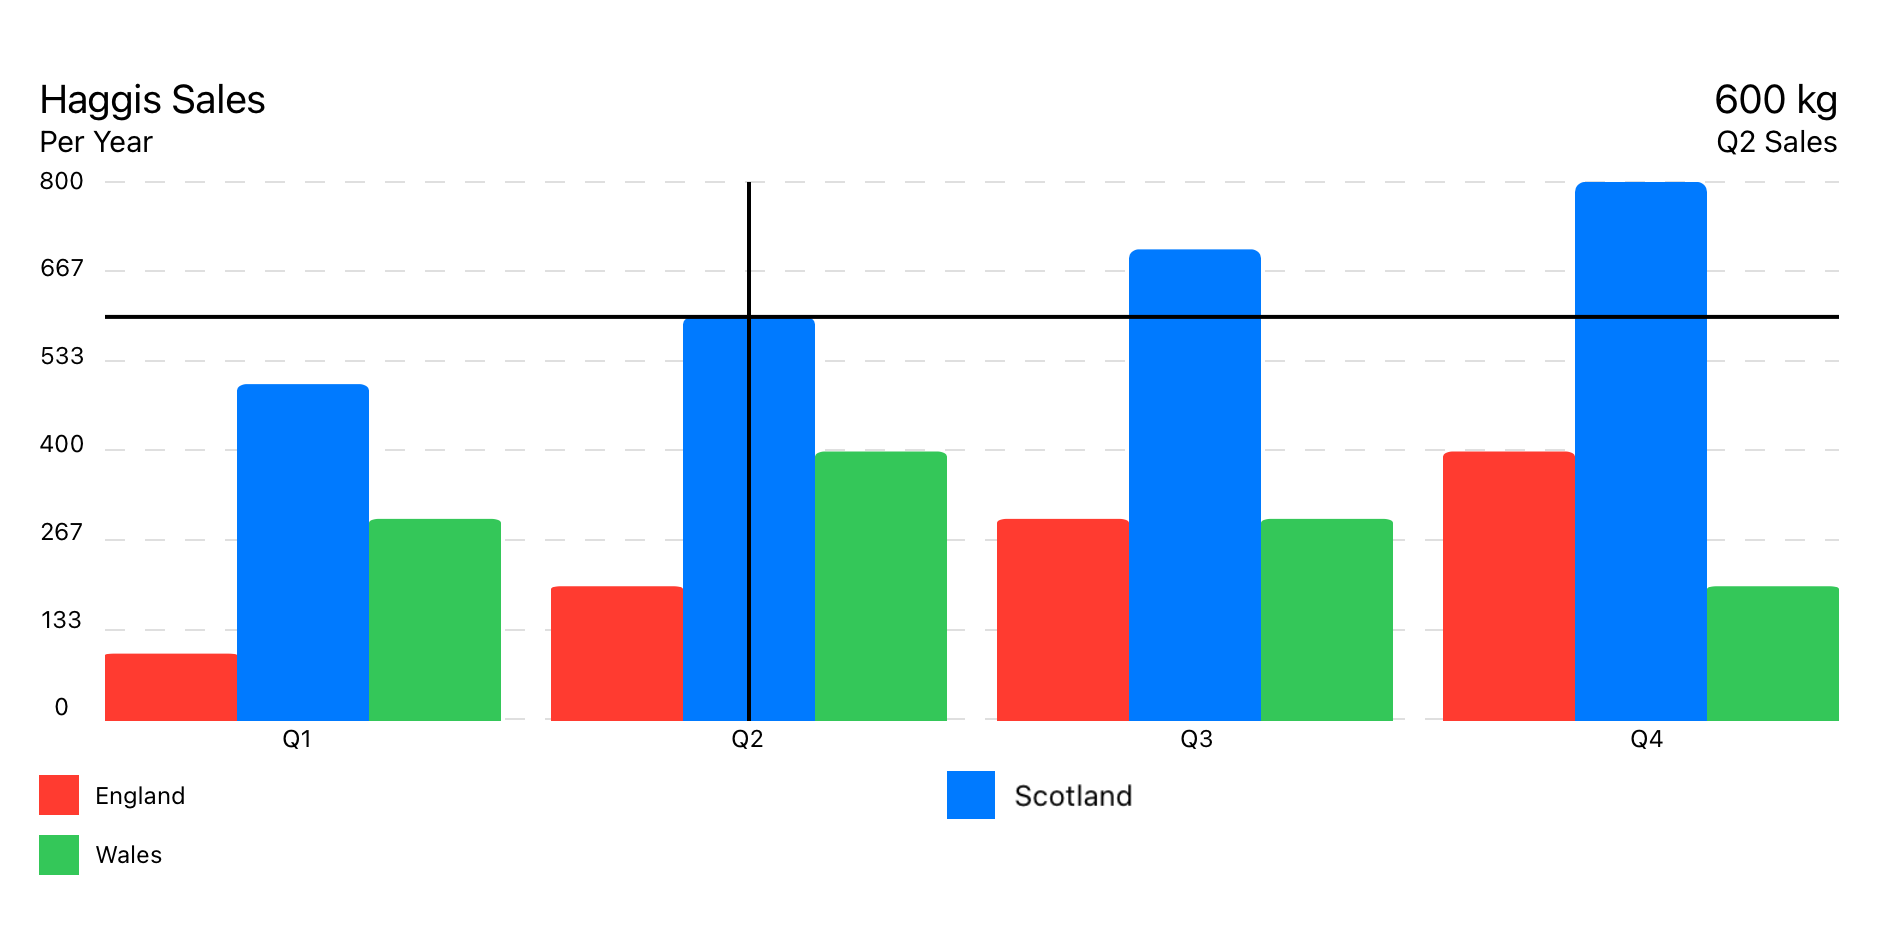
Verwendet GroupedBarChartData -Datenmodell.
GroupedBarChart ( chartData : GroupedBarChartData ) 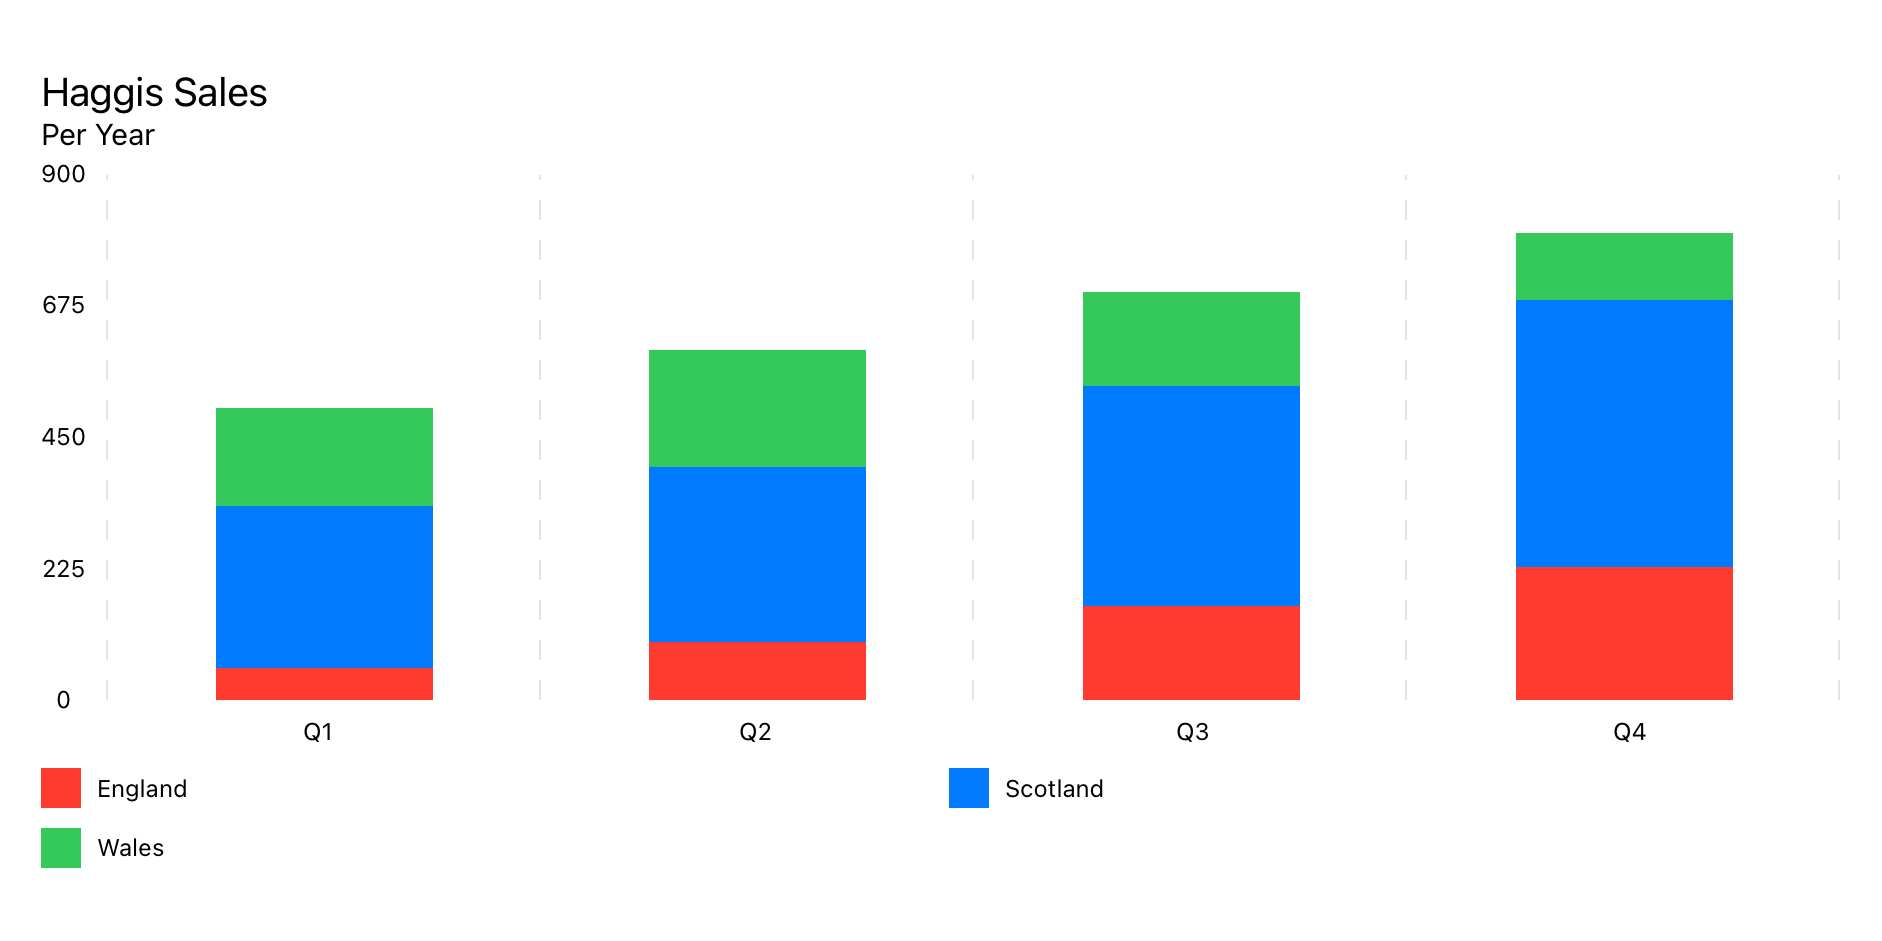
Verwendet das Datenmodell StackedBarChartData .
StackedBarChart ( chartData : StackedBarChartData )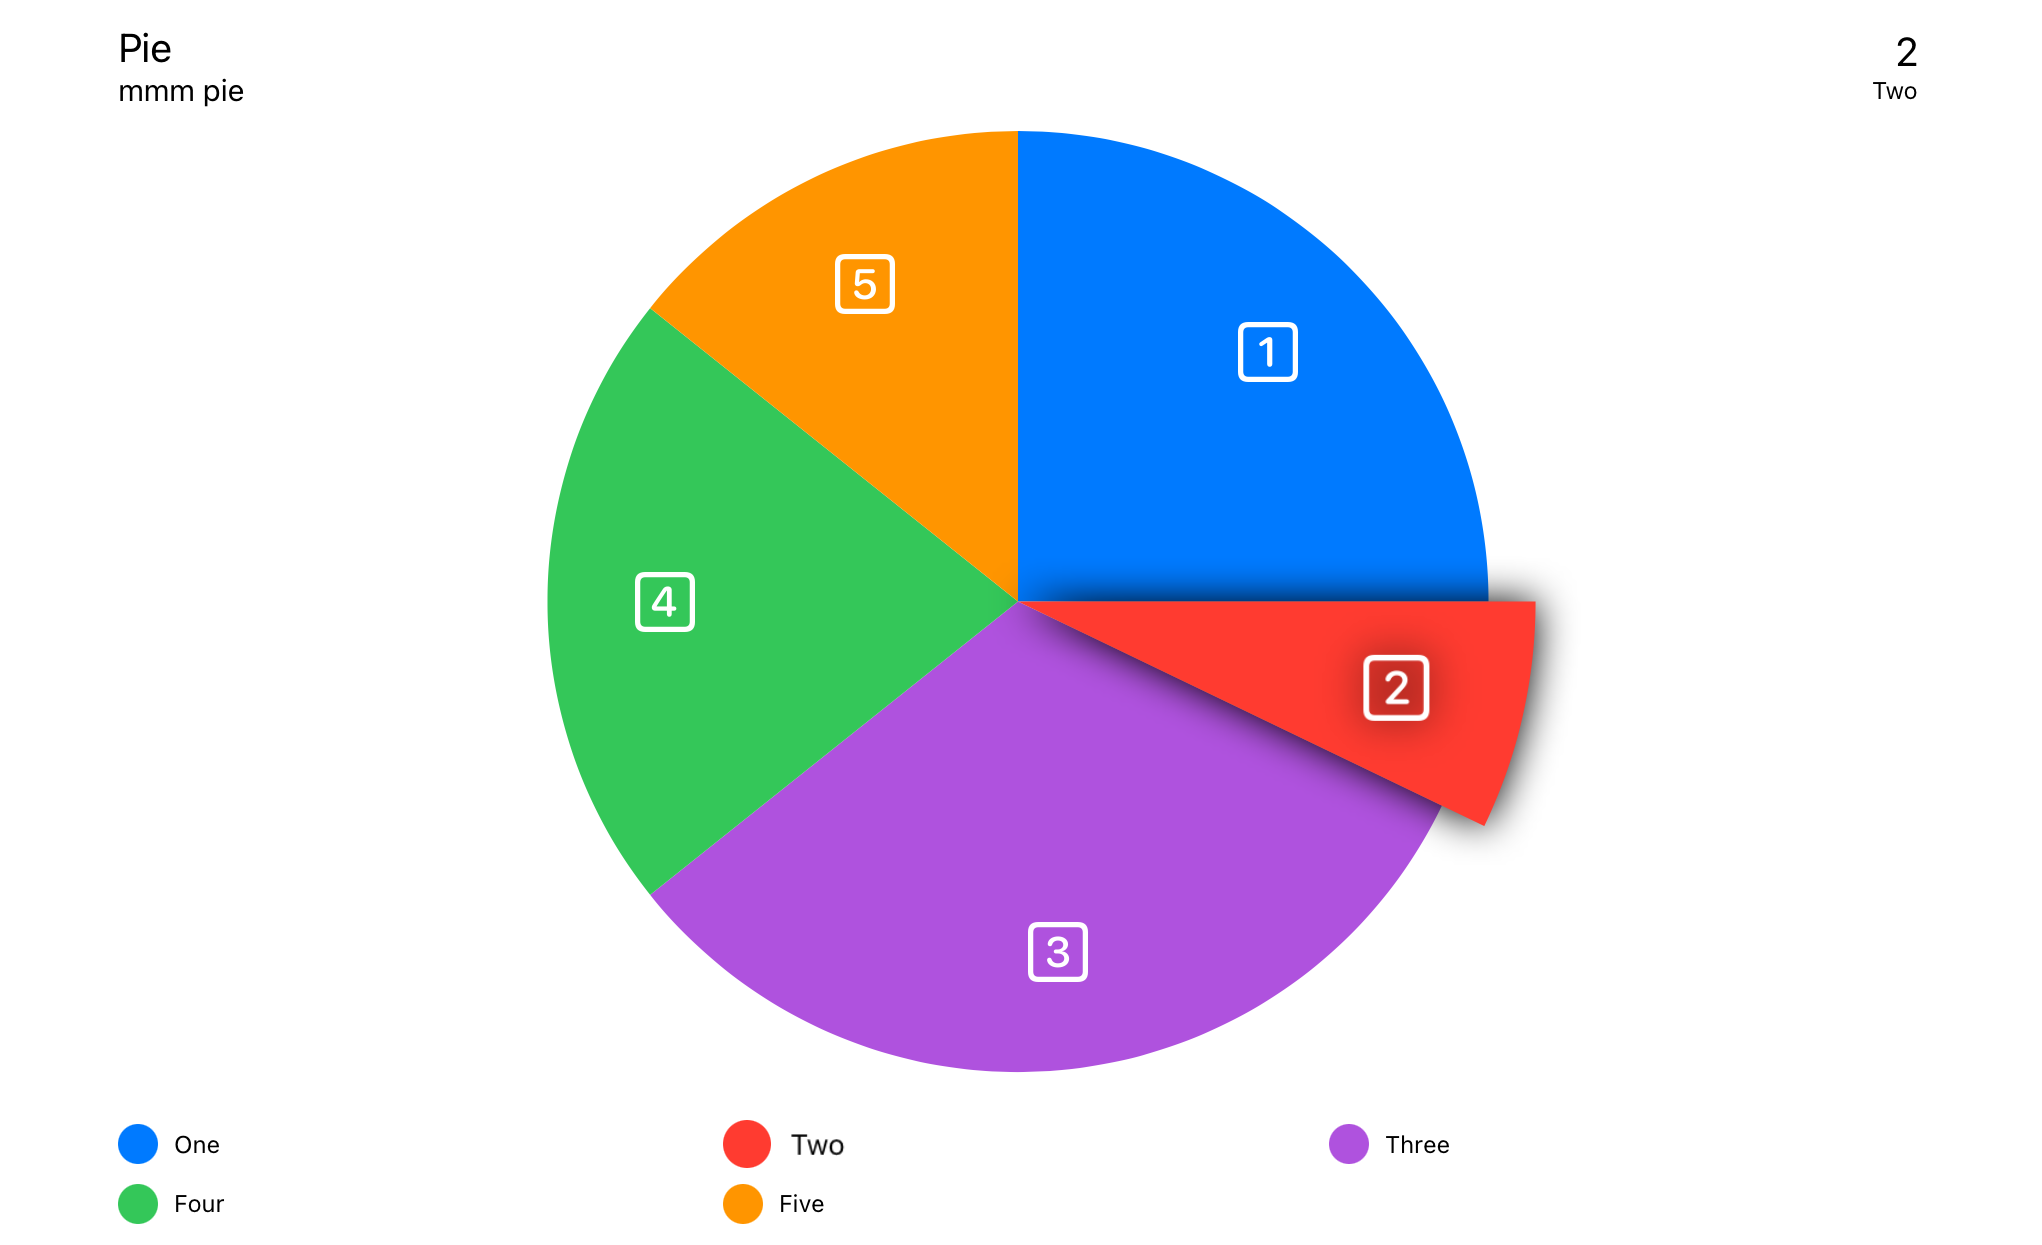
Verwendet PieChartData -Datenmodell.
PieChart ( chartData : PieChartData ) 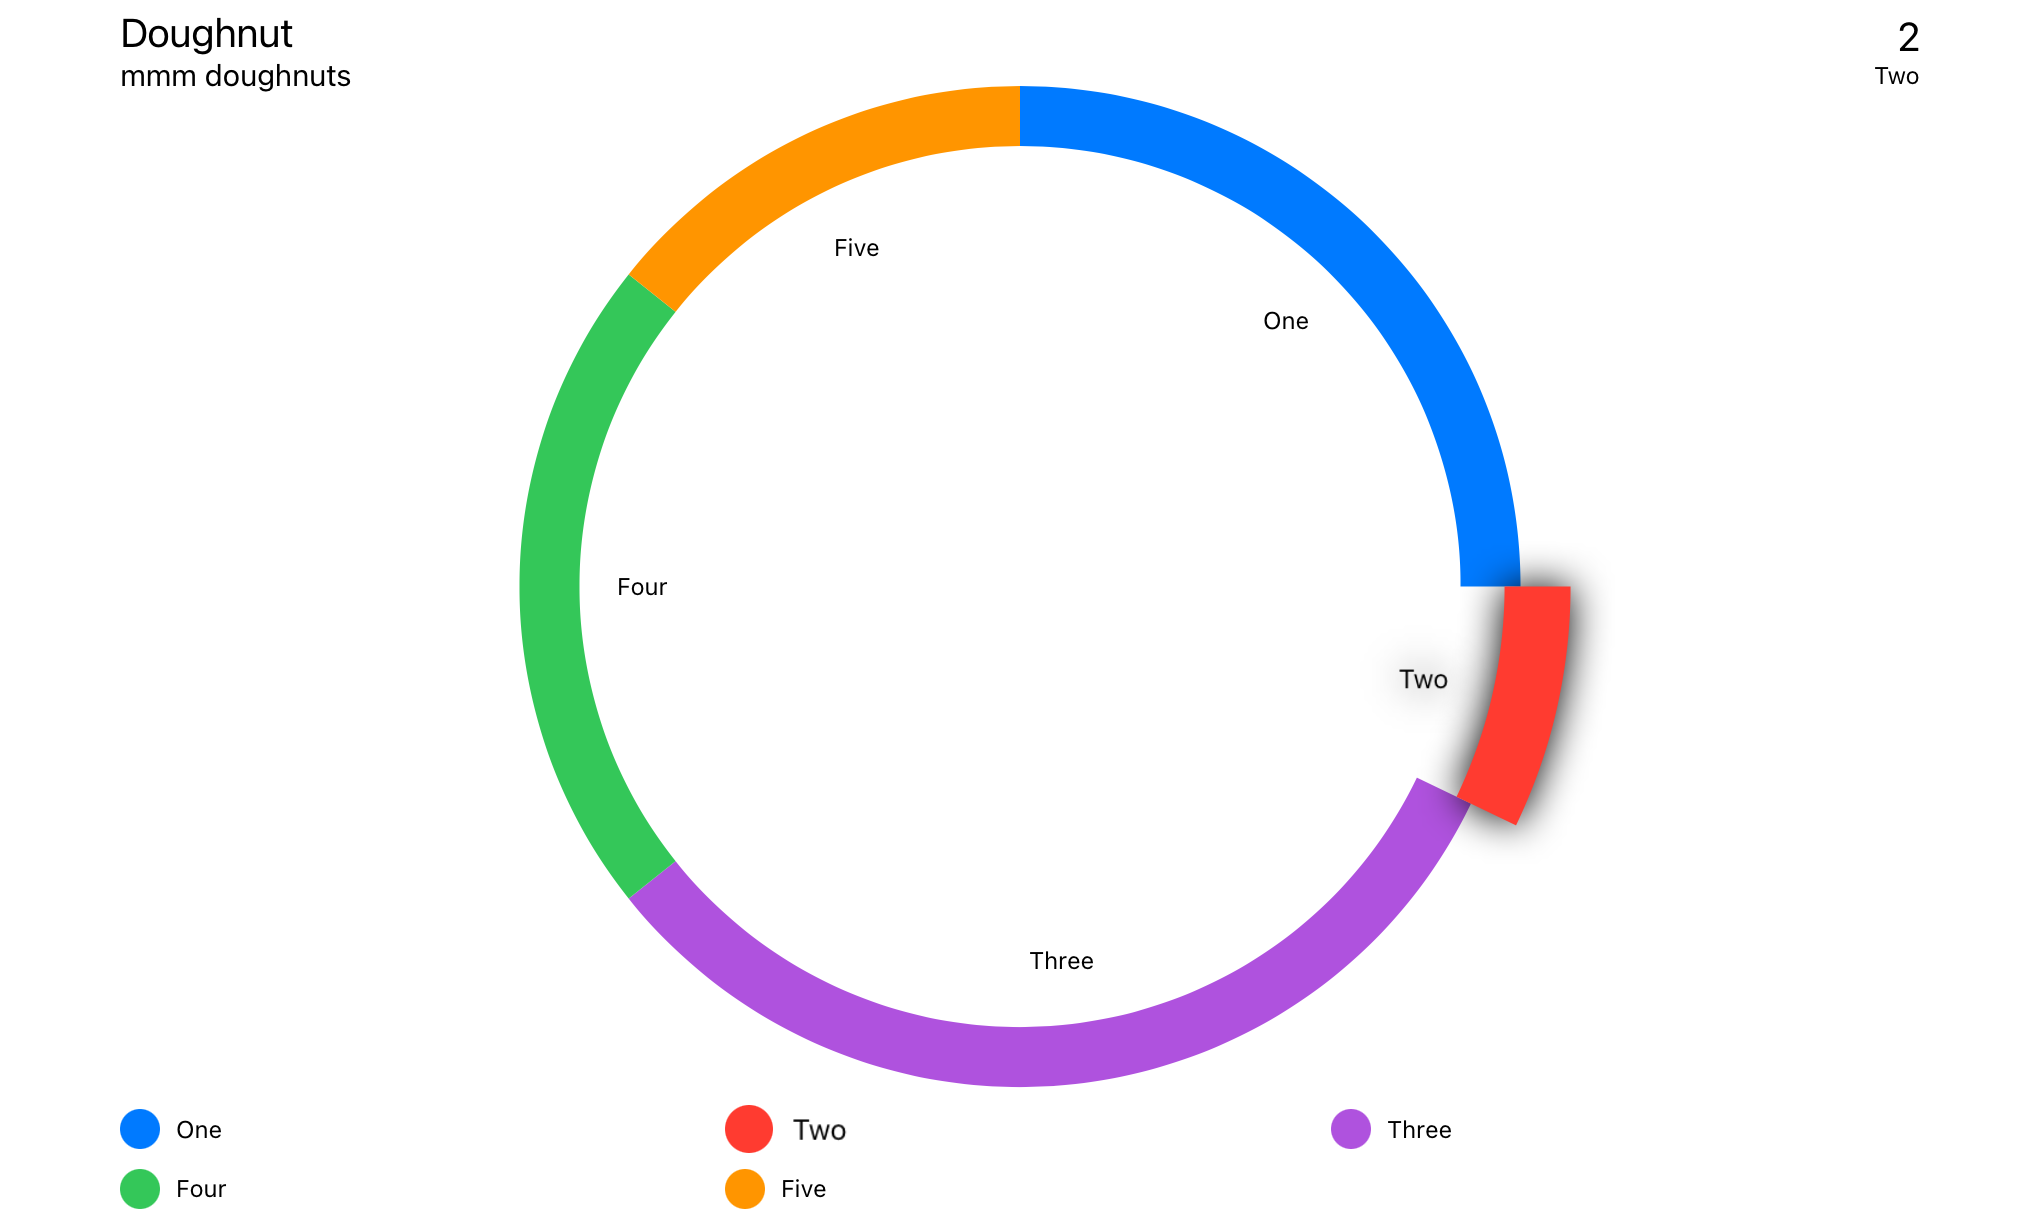
Verwendet das DoughnutChartData -Datenmodell.
DoughnutChart ( chartData : DoughnutChartData ) Swift Package Manager
File > Swift Packages > Add Package Dependency...
import SwiftUICharts Wenn Sie Probleme mit Ansichten haben, die nicht korrekt aktualisiert werden, fügen Sie .id() zu Ihrer Ansicht hinzu.
 LineChart ( chartData : LineChartData )
. id ( LineChartData . id ) Berühren Sie Overlay
Info -Box
Schwimmende Info -Box
Headerbox
Legenden
Durchschnittliche Linie
Y Achsenspitze von Interesse
X -Achsenraster
Y Achsenraster
X -Achse -Beschriftungen
Y Achsenbezeichnungen
Lineare Trendlinie
Punktmarkierungen
Die Reihenfolge der Ansichtsmodifikatoren sind einige wichtig, da die Modifikatoren verschiedene Arten von Stapeln sind, die sich um die vorherigen Ansichten wickeln.
Erkennt die Eingabe entweder vom Berührung des Zeigers. Findet den nächstgelegenen Datenpunkt und zeigt die relevanten Informationen an, wo angegeben.
Die Position des Info -Felds ist in ChartStyle -> infoBoxPlacement festgelegt.
. touchOverlay ( chartData : CTChartData , specifier : String , unit : TouchUnit )Einrichten in Diagrammdaten -> Diagrammstil
Zeigt die Informationen von Touch Overlay an, wenn InfoBoxPlacement auf .infoBox eingestellt ist.
Die Position des Info -Felds ist in ChartStyle -> infoBoxPlacement festgelegt.
. infoBox ( chartData : CTChartData ) Zeigt die Informationen von Touch Overlay an, wenn InfoBoxPlacement auf .floating eingestellt ist.
Die Position des Info -Felds ist in ChartStyle -> infoBoxPlacement festgelegt.
. floatingInfoBox ( chartData : CTChartData ) Zeigt die Metadaten über das Diagramm an, die in Chart Data -> ChartMetadata
Zeigt die Informationen von Touch Overlay an, wenn InfoBoxPlacement auf .header eingestellt ist.
Die Position des Info -Felds ist in ChartStyle -> infoBoxPlacement festgelegt.
. headerBox ( chartData : CTChartData ) Zeigt Legenden an.
. legends ( )Legt Marker über jeden Datenpunkt aus.
Zeigt eine Markierungslinie mit dem Durchschnitt aller Datenpunkte an.
 . averageLine ( chartData : CTLineBarChartDataProtocol ,
             markerName : " Average " ,
             labelPosition : . yAxis ( specifier : " %.0f " ) ,
             lineColour : . primary ,
strokeStyle : StrokeStyle ( lineWidth : 3 , dash : [ 5 , 10 ] ) )Konfigurierbarer Punkt von Interesse
 . yAxisPOI ( chartData : CTLineBarChartDataProtocol ,
          markerName : " Marker " ,
          markerValue : 123 ,
          labelPosition : . center ( specifier : " %.0f " ) ,
          labelColour : Color . black ,
          labelBackground : Color . orange ,
          lineColour : Color . orange ,
strokeStyle : StrokeStyle ( lineWidth : 3 , dash : [ 5 , 10 ] ) )Fügt vertikale Linien entlang der x -Achse hinzu.
. xAxisGrid ( chartData : CTLineBarChartDataProtocol ) Setup in ChartData -> ChartStyle .
Fügt horizontale Linien entlang der Y -Achse hinzu.
. yAxisGrid ( chartData : CTLineBarChartDataProtocol ) Setup in ChartData -> ChartStyle .
Etiketten für die x -Achse.
. xAxisLabels ( chartData : CTLineBarChartDataProtocol ) Setup in ChartData -> ChartStyle .
Automatisch erzeugte Etiketten für die Y -Achse
. yAxisLabels ( chartData : CTLineBarChartDataProtocol , specifier : " %.0f " ) Setup in ChartData -> ChartStyle .
yaxislabelType:
case numeric // Auto generated, numeric labels.
case custom // Custom labels array
Custom wird aus ChartData -> yAxisLabels festgelegt
Eine Zeile über das Diagramm, um den Trend in den Daten anzuzeigen.
 . linearTrendLine ( chartData : CTLineBarChartDataProtocol ,
                 firstValue : Double ,
                 lastValue : Double ,
                 lineColour : ColourStyle ,
strokeStyle : StrokeStyle )Legt Marker über jeden Datenpunkt aus.
. pointMarkers ( chartData : CTLineChartDataProtocol ) Einrichten innerhalb von Data Set -> PointStyle .
Fügt eine unabhängige Linie über Filllinechart hinzu.
 . filledTopLine ( chartData : LineChartData ,
               lineColour : ColourStyle ,
               strokeStyle : StrokeStyle )
Ermöglicht eine harte Linie über dem Datenpunkt mit einer halb undurchsichtigen Füllung.
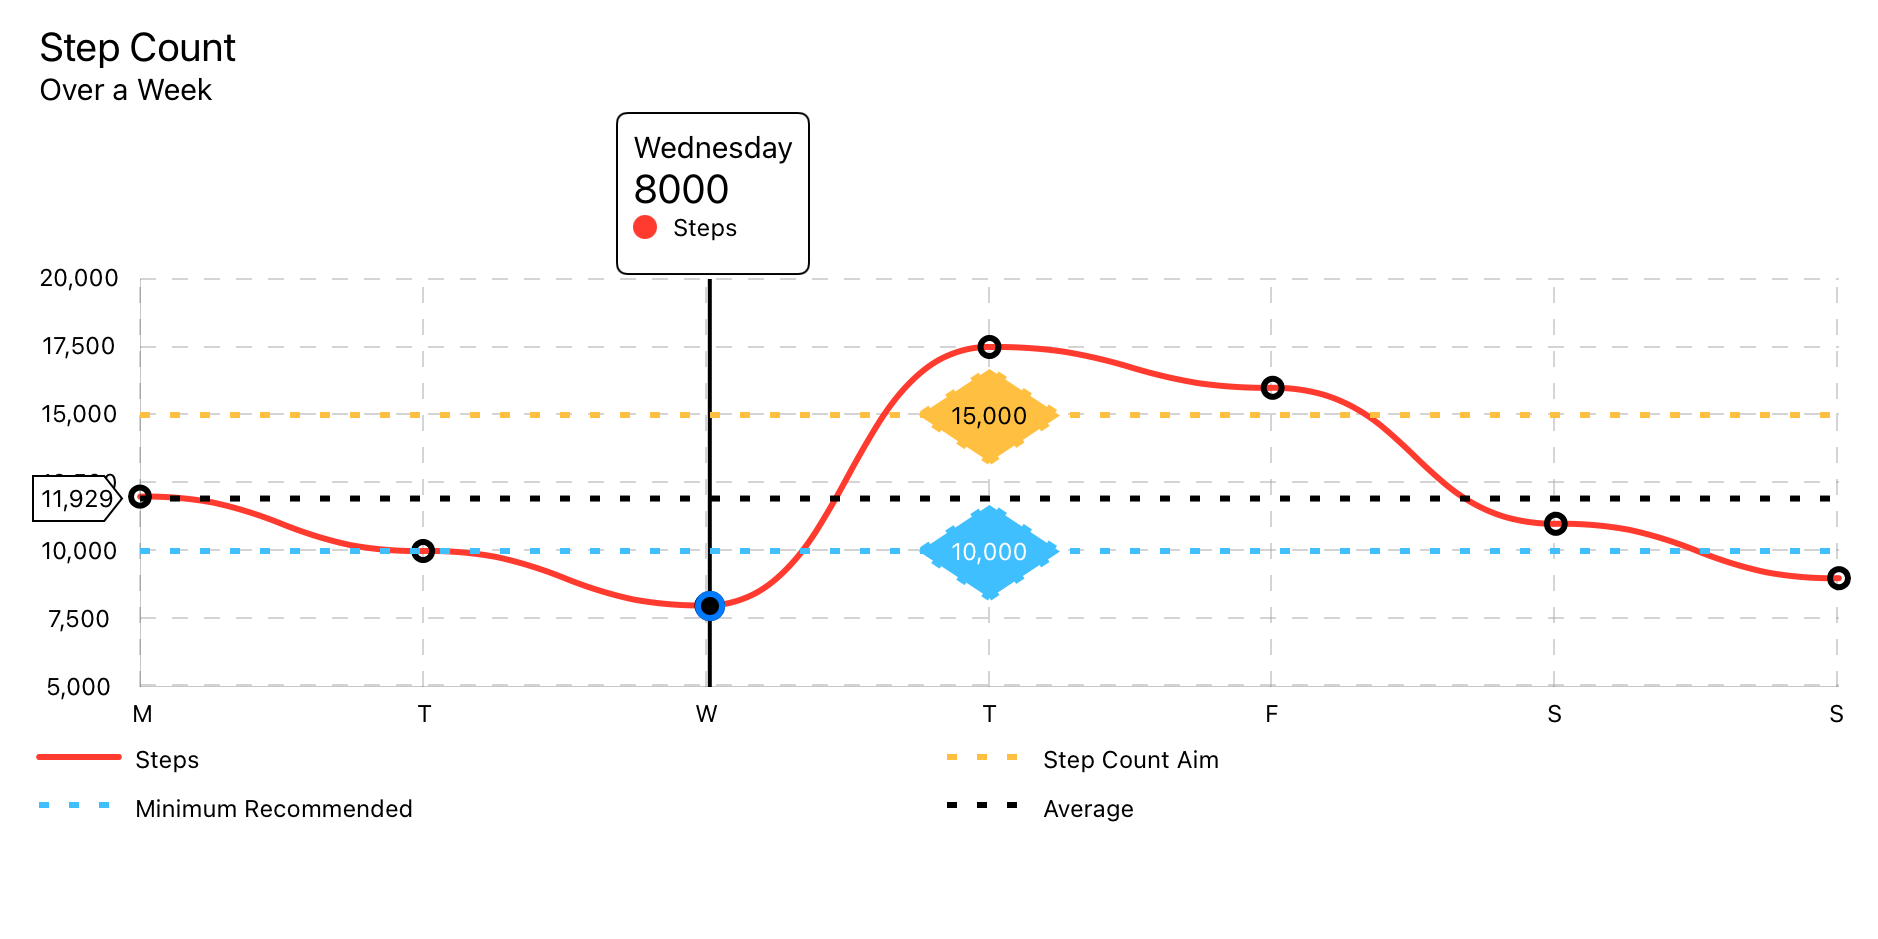
 struct LineChartDemoView : View {

    let data : LineChartData = weekOfData ( )

    var body : some View {
        VStack {
            LineChart ( chartData : data )
                . pointMarkers ( chartData : data )
                . touchOverlay ( chartData : data , specifier : " %.0f " )
                . yAxisPOI ( chartData : data ,
                          markerName : " Step Count Aim " ,
                          markerValue : 15_000 ,
                          labelPosition : . center ( specifier : " %.0f " ) ,
                          labelColour : Color . black ,
                          labelBackground : Color ( red : 1.0 , green : 0.75 , blue : 0.25 ) ,
                          lineColour : Color ( red : 1.0 , green : 0.75 , blue : 0.25 ) ,
                          strokeStyle : StrokeStyle ( lineWidth : 3 , dash : [ 5 , 10 ] ) )
                . yAxisPOI ( chartData : data ,
                          markerName : " Minimum Recommended " ,
                          markerValue : 10_000 ,
                          labelPosition : . center ( specifier : " %.0f " ) ,
                          labelColour : Color . white ,
                          labelBackground : Color ( red : 0.25 , green : 0.75 , blue : 1.0 ) ,
                          lineColour : Color ( red : 0.25 , green : 0.75 , blue : 1.0 ) ,
                          strokeStyle : StrokeStyle ( lineWidth : 3 , dash : [ 5 , 10 ] ) )
                . averageLine ( chartData : data ,
                             strokeStyle : StrokeStyle ( lineWidth : 3 , dash : [ 5 , 10 ] ) )
                . xAxisGrid ( chartData : data )
                . yAxisGrid ( chartData : data )
                . xAxisLabels ( chartData : data )
                . yAxisLabels ( chartData : data )
                . infoBox ( chartData : data )
                . headerBox ( chartData : data )
                . legends ( chartData : data , columns : [ GridItem ( . flexible ( ) ) , GridItem ( . flexible ( ) ) ] )
                . id ( data . id )
                . frame ( minWidth : 150 , maxWidth : 900 , minHeight : 150 , idealHeight : 250 , maxHeight : 400 , alignment : . center )
        }
        . navigationTitle ( " Week of Data " )
    }

    static func weekOfData ( ) -> LineChartData {
        let data = LineDataSet ( dataPoints : [
            LineChartDataPoint ( value : 12000 , xAxisLabel : " M " , description : " Monday " ) ,
            LineChartDataPoint ( value : 10000 , xAxisLabel : " T " , description : " Tuesday " ) ,
            LineChartDataPoint ( value : 8000 ,  xAxisLabel : " W " , description : " Wednesday " ) ,
            LineChartDataPoint ( value : 17500 , xAxisLabel : " T " , description : " Thursday " ) ,
            LineChartDataPoint ( value : 16000 , xAxisLabel : " F " , description : " Friday " ) ,
            LineChartDataPoint ( value : 11000 , xAxisLabel : " S " , description : " Saturday " ) ,
            LineChartDataPoint ( value : 9000 ,  xAxisLabel : " S " , description : " Sunday " )
        ] ,
        legendTitle : " Steps " ,
        pointStyle : PointStyle ( ) ,
        style : LineStyle ( lineColour : ColourStyle ( colour : . red ) , lineType : . curvedLine ) )

        let metadata   = ChartMetadata ( title : " Step Count " , subtitle : " Over a Week " )

        let gridStyle  = GridStyle ( numberOfLines : 7 ,
                                   lineColour   : Color ( . lightGray ) . opacity ( 0.5 ) ,
                                   lineWidth    : 1 ,
                                   dash         : [ 8 ] ,
                                   dashPhase    : 0 )

        let chartStyle = LineChartStyle ( infoBoxPlacement    : . infoBox ( isStatic : false ) ,
                                        infoBoxBorderColour : Color . primary ,
                                        infoBoxBorderStyle  : StrokeStyle ( lineWidth : 1 ) ,

                                        markerType          : . vertical ( attachment : . line ( dot : . style ( DotStyle ( ) ) ) ) ,

                                        xAxisGridStyle      : gridStyle ,
                                        xAxisLabelPosition  : . bottom ,
                                        xAxisLabelColour    : Color . primary ,
                                        xAxisLabelsFrom     : . dataPoint ( rotation : . degrees ( 0 ) ) ,

                                        yAxisGridStyle      : gridStyle ,
                                        yAxisLabelPosition  : . leading ,
                                        yAxisLabelColour    : Color . primary ,
                                        yAxisNumberOfLabels : 7 ,

                                        baseline            : . minimumWithMaximum ( of : 5000 ) ,
                                        topLine             : . maximum ( of : 20000 ) ,

                                        globalAnimation     : . easeOut ( duration : 1 ) )

        return LineChartData ( dataSets       : data ,
                             metadata       : metadata ,
                             chartStyle     : chartStyle )

    }
}In bestimmten Elementen befinden sich zusätzliche Tags, um das Diagramm für Voice -Over zu beschreiben.
Siehe Lokalisierung der Zugänglichkeit
Alle Etiketten unterstützen die Lokalisierung. Es gibt jedoch einige versteckte Etiketten, die Voice -Over unterstützen. Siehe Lokalisierung der Zugänglichkeit
Siehe die Lokalisierungsdemo im Demo -Projekt.
Voice -Over -Beschreibung eines Datenpunktes, wenn der Benutzer den Bereich berührt, der dem Datenpunkt am nächsten liegt. Der Voice -Over wird <chart title>, <data point value>, <data point description> besagen.
" %@ <local_description_of_a_data_point> " = " %@, <Description of a data point> " ; Lesen Sie vor einem poiMarker vor. Der Voice -Over wird <poi marker>, <marker legend title>, <marker value> sagen.
 " P-O-I-Marker " = " P O I Marker " ;
" Average " = " Average " ;
Stimme über Beschreibung eines poiMarker . Der Voice-Over wird <POI-Marker>, <marker legend title>, <marker value> sagen.
" <local_marker_legend_title> %@ " = " local_marker_legend_title, %@ " ; Lesen Sie vor einem axisLabel vor. Der Voice -Over wird <axisLabel>, <marker value> sagen.
 "X-Axis-Label" = "X Axis Label";
"Y-Axis-Label" = "Y Axis Label";
Lesen Sie vor einer legend vor. Der Voice -Over wird <chart type legend>, <legend title> sagen.
 " Line-Chart-Legend " = " Line Chart Legend " ;
" P-O-I-Marker-Legend " = " P O I Marker Legend " ;
" Bar-Chart-Legend " = " Bar Chart Legend " ;
" P-O-I-Marker-Legend " = " P O I Marker Legend " ;
" Pie-Chart-Legend " = " Pie Chart Legend " ;
" P-O-I-Marker-Legend " = " P O I Marker Legend " ;

