SwiftUICharts
v2.10.3
A charts / plotting library for SwiftUI. Works on macOS, iOS, watchOS, and tvOS and has accessibility and Localization features built in.
Demo Project
Documentation
Working on a Version 3 with a more SwiftUI feel to the API.
Line Chart
Filled Line Chart
Multi Line Chart
Ranged Line Chart
Bar Chart
Ranged Bar Chart
Grouped Bar Chart
Stacked Bar Chart
Pie Chart
Doughnut Chart
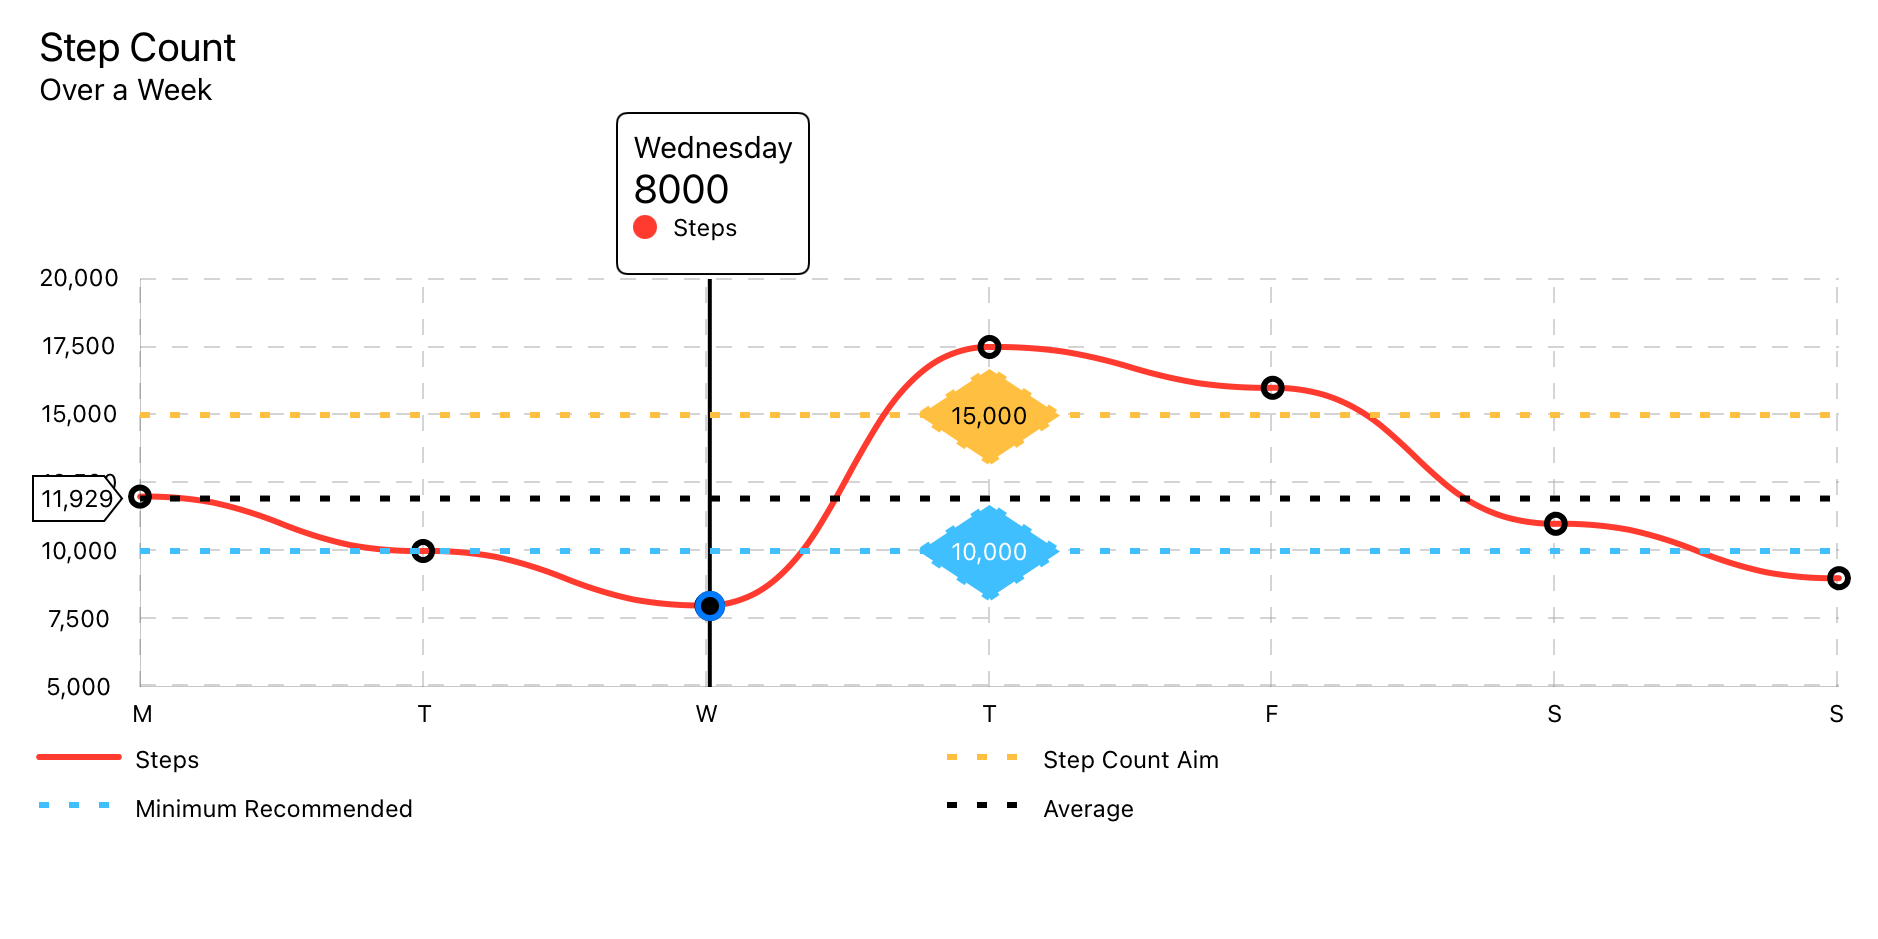
Uses LineChartData data model.
LineChart(chartData: LineChartData)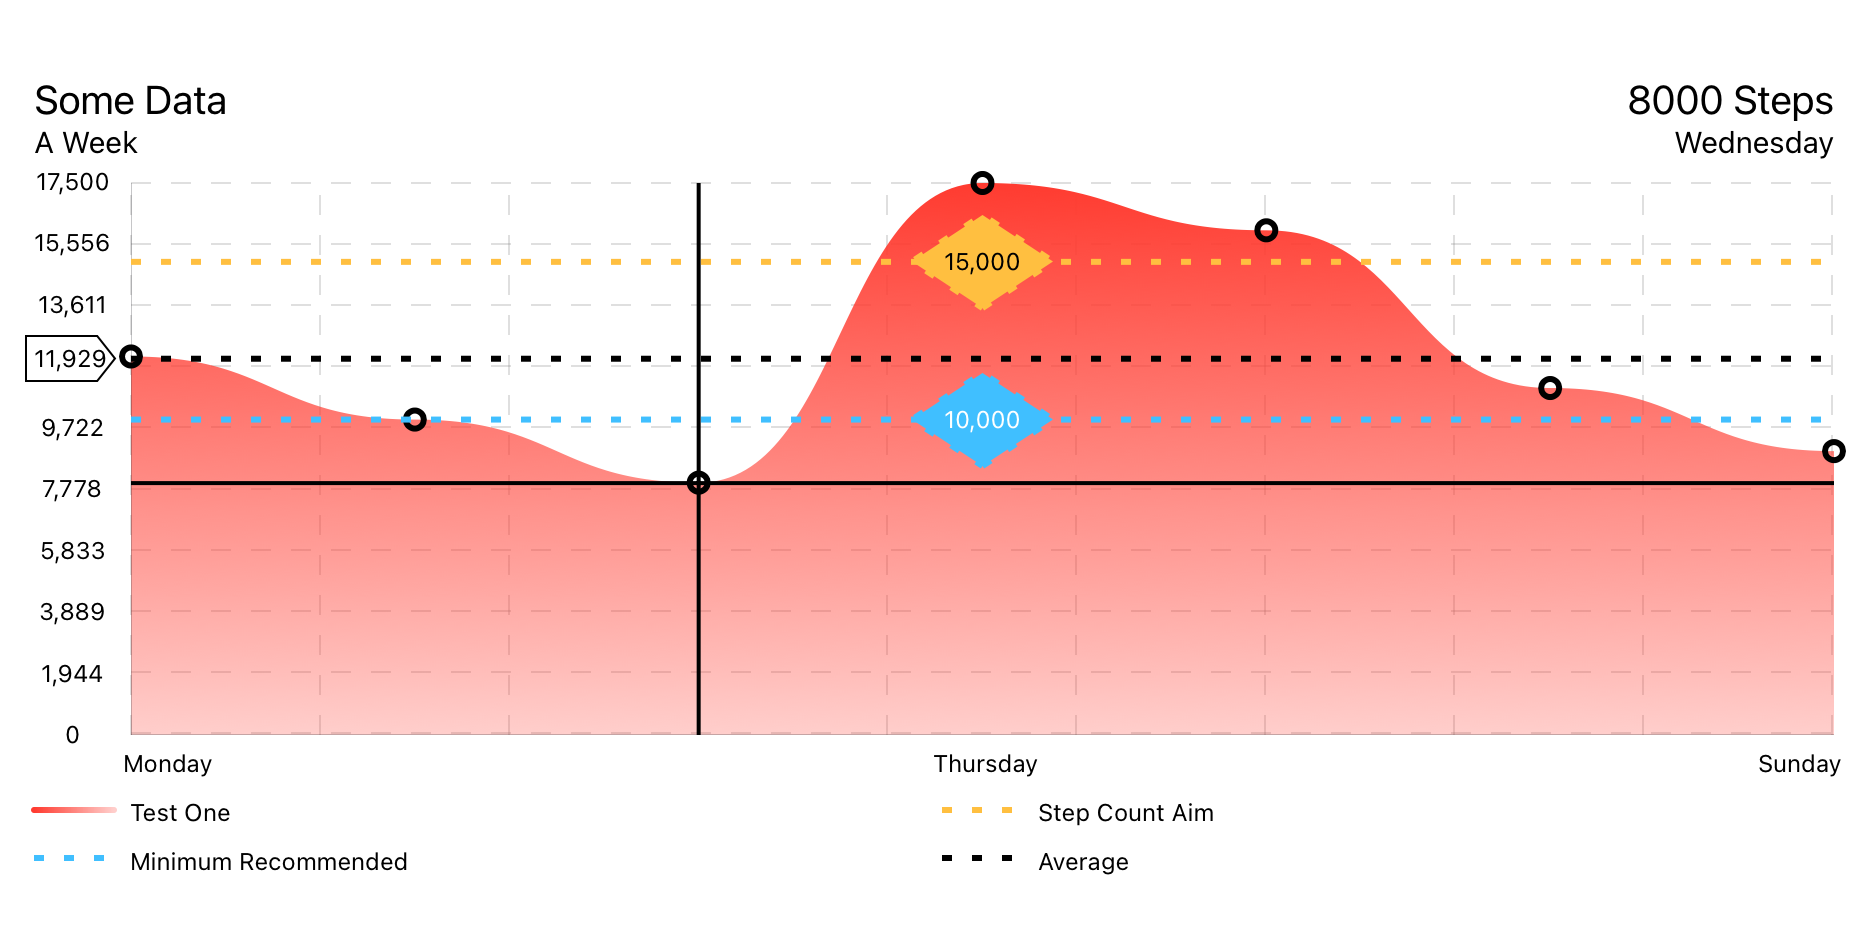
Uses LineChartData data model.
FilledLineChart(chartData: LineChartData)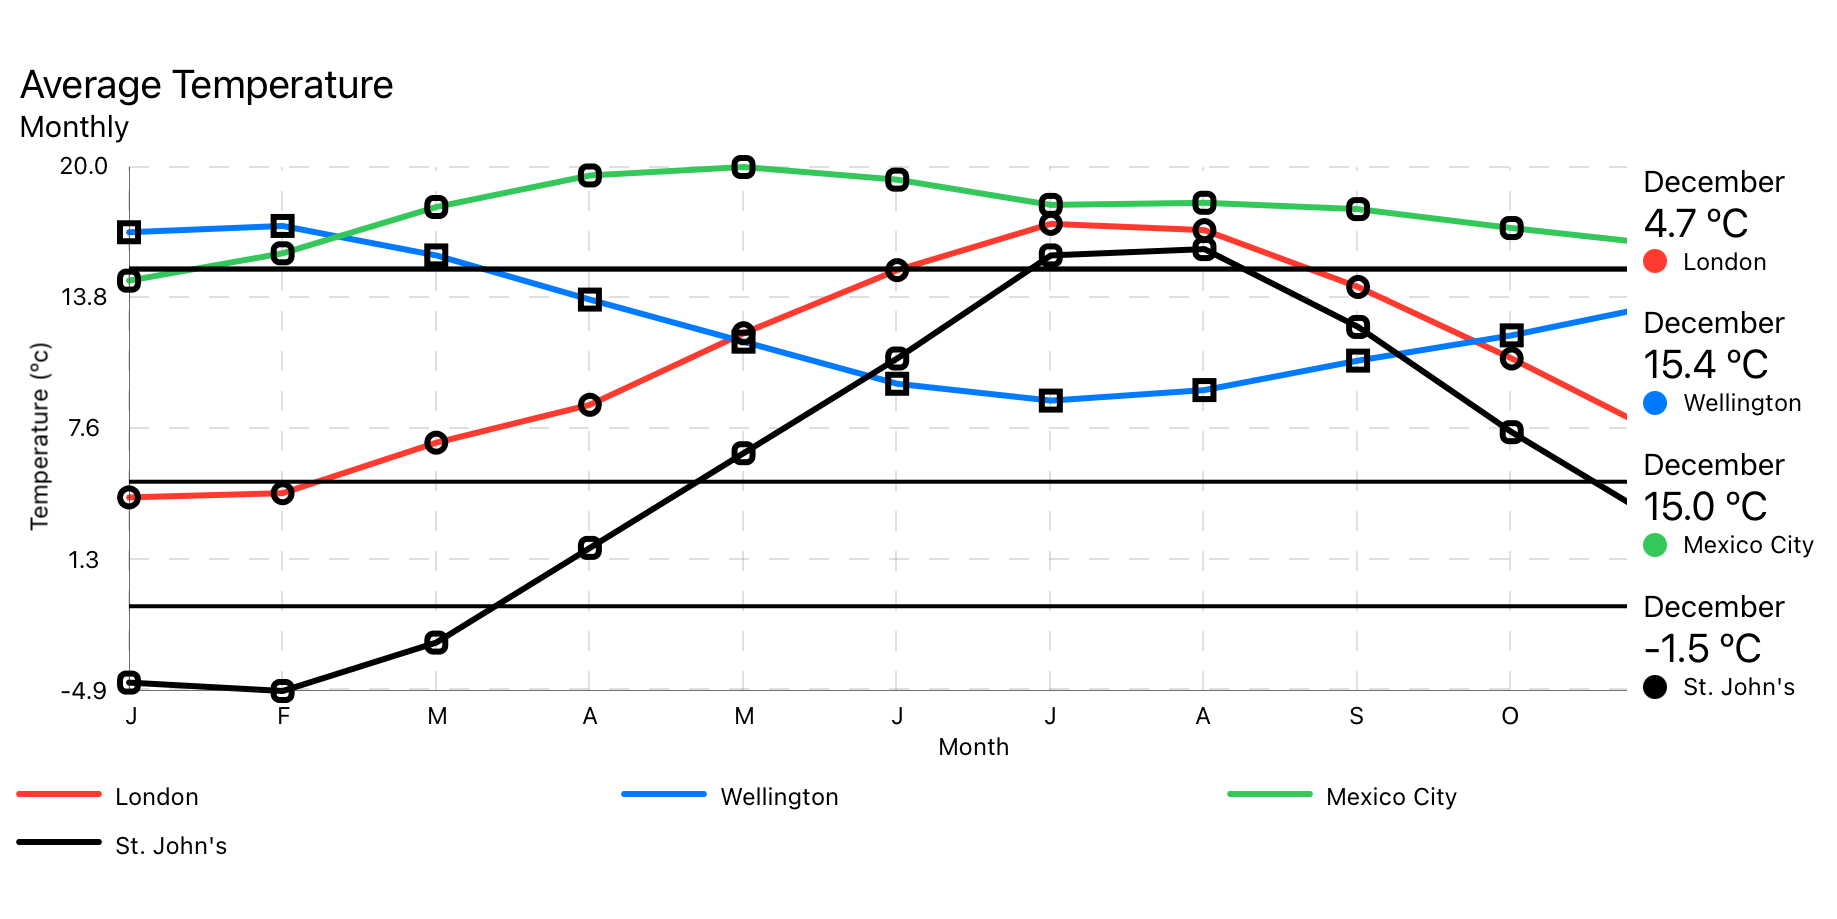
Uses MultiLineChartData data model.
MultiLineChart(chartData: MultiLineChartData)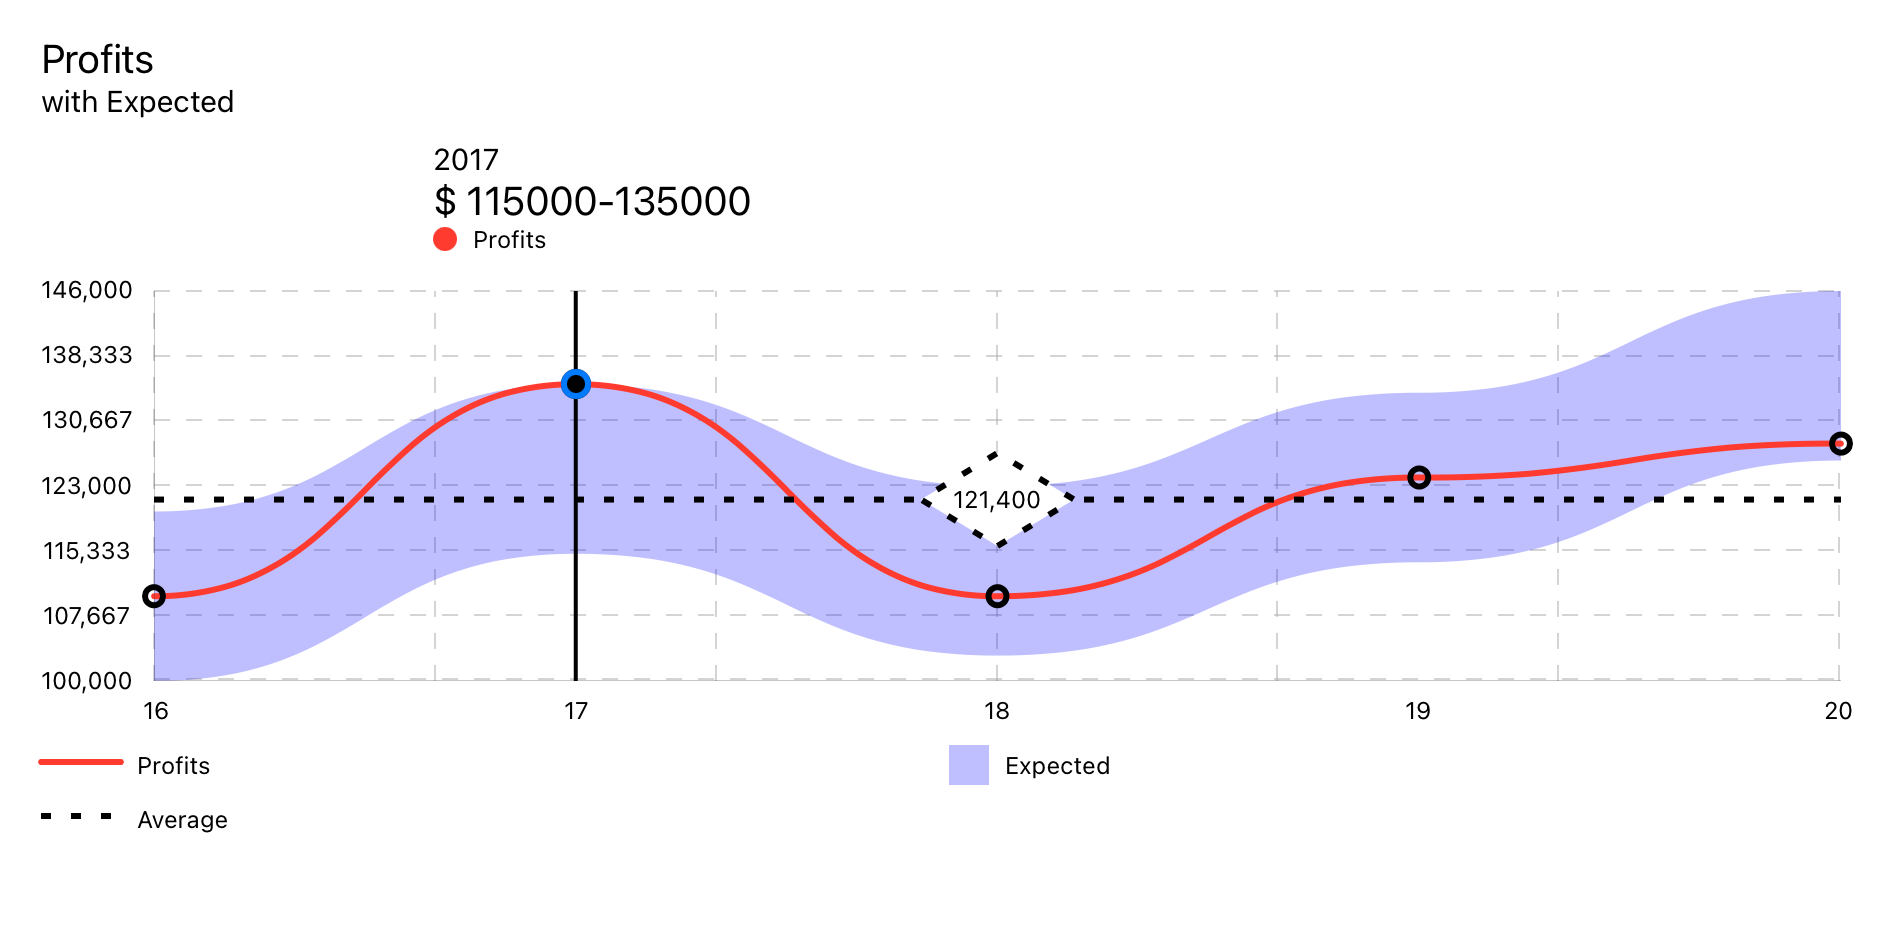
Uses RangedLineChart data model.
RangedLineChart(chartData: RangedLineChartData)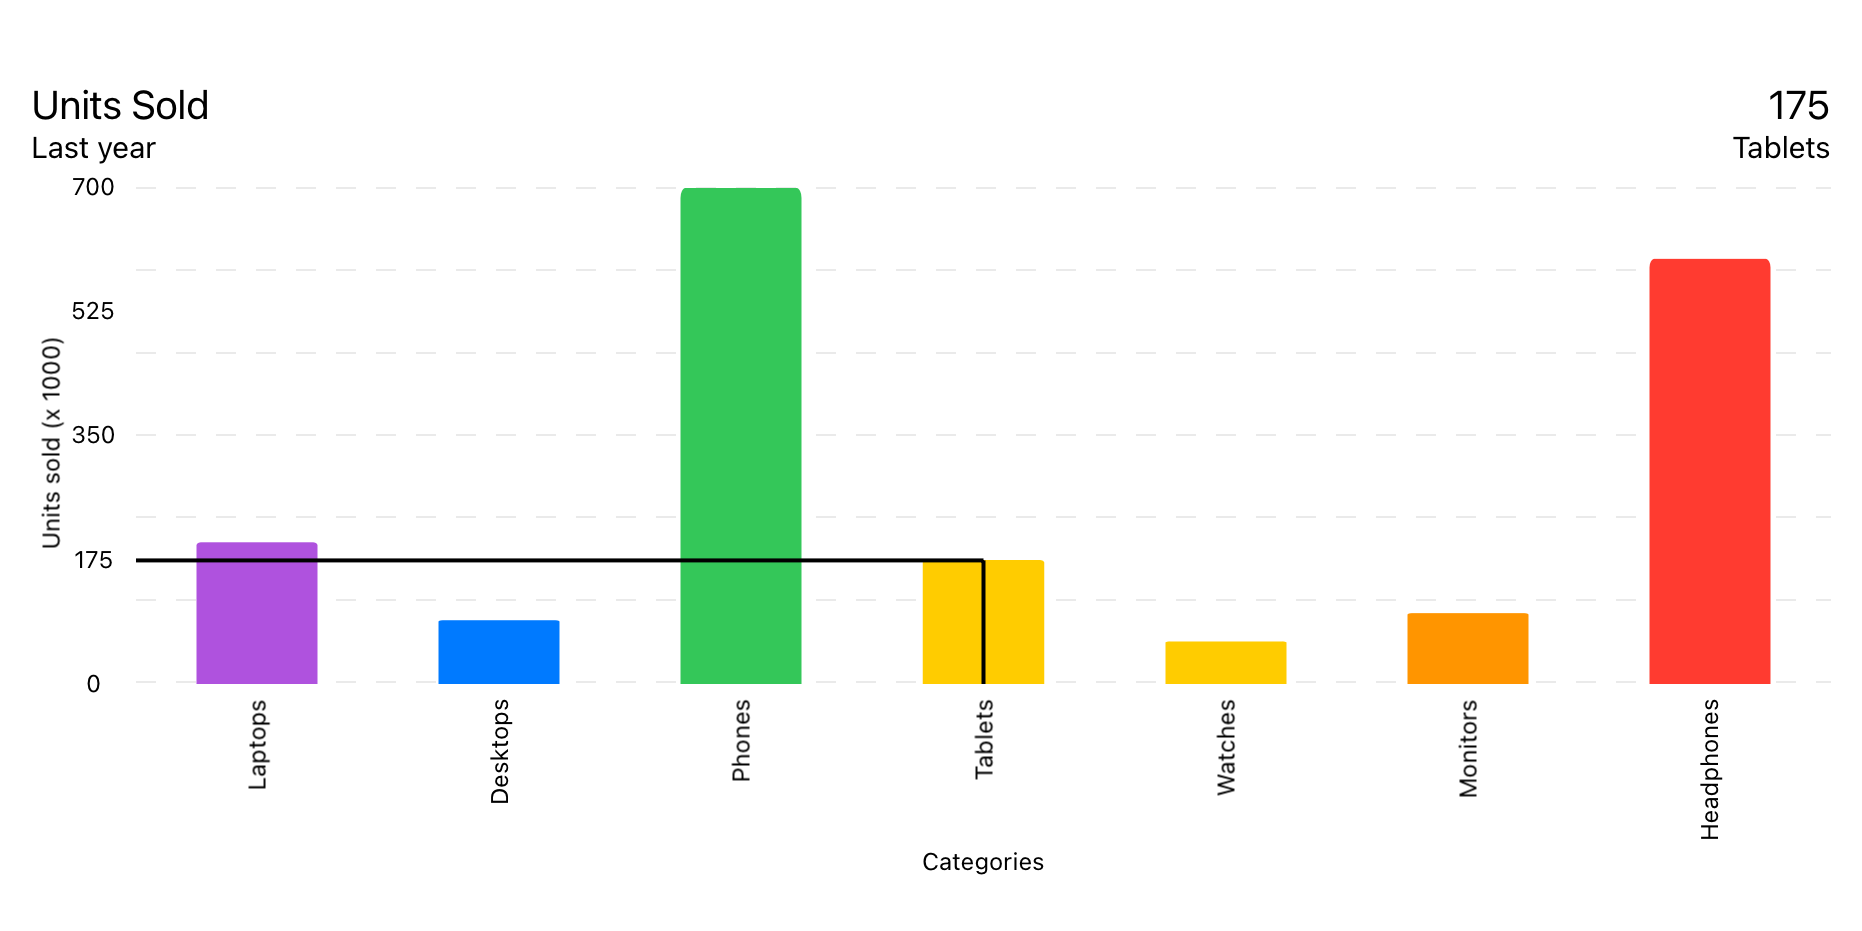
Uses BarChartData data model.
BarChart(chartData: BarChartData)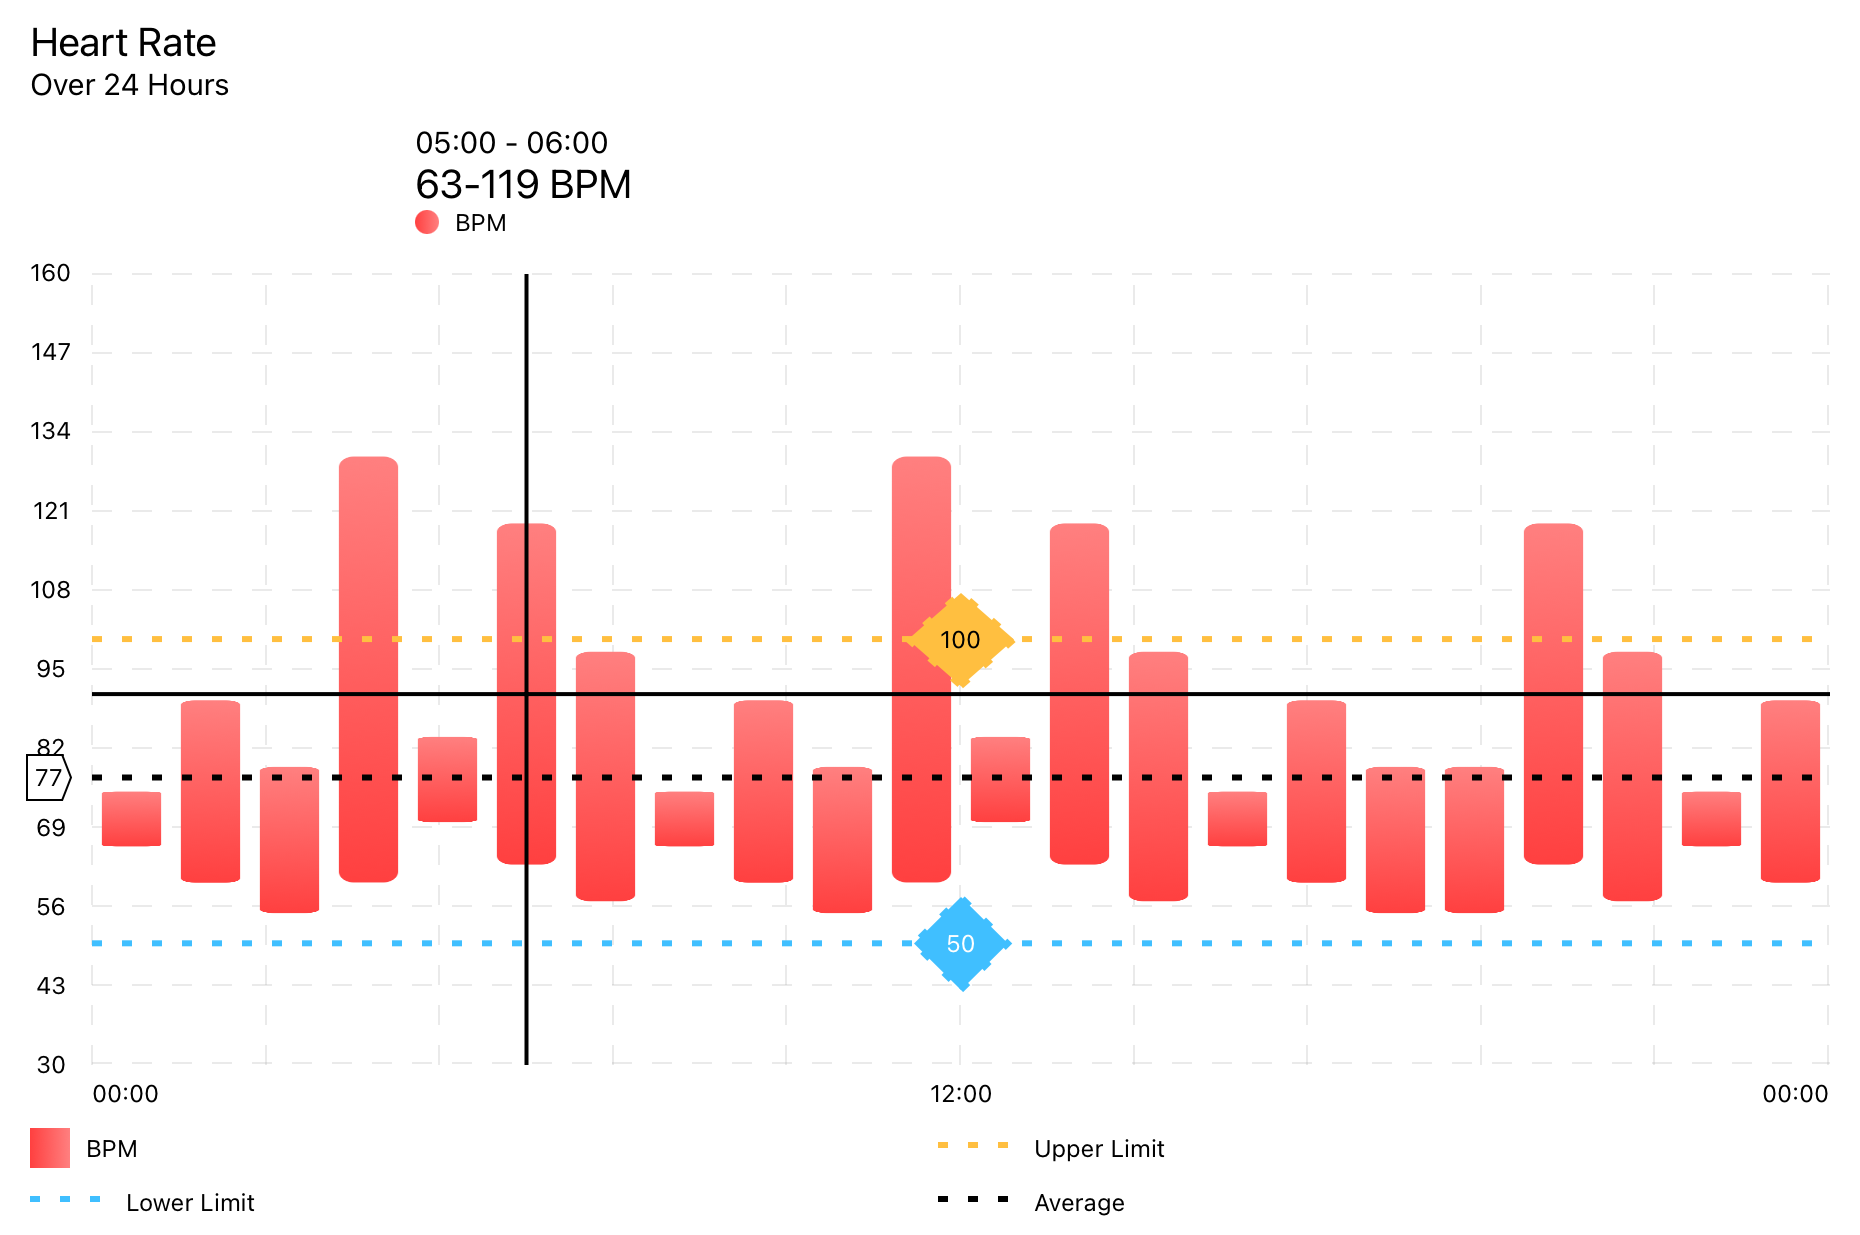
Uses RangedBarChartData data model.
RangedBarChart(chartData: RangedBarChartData)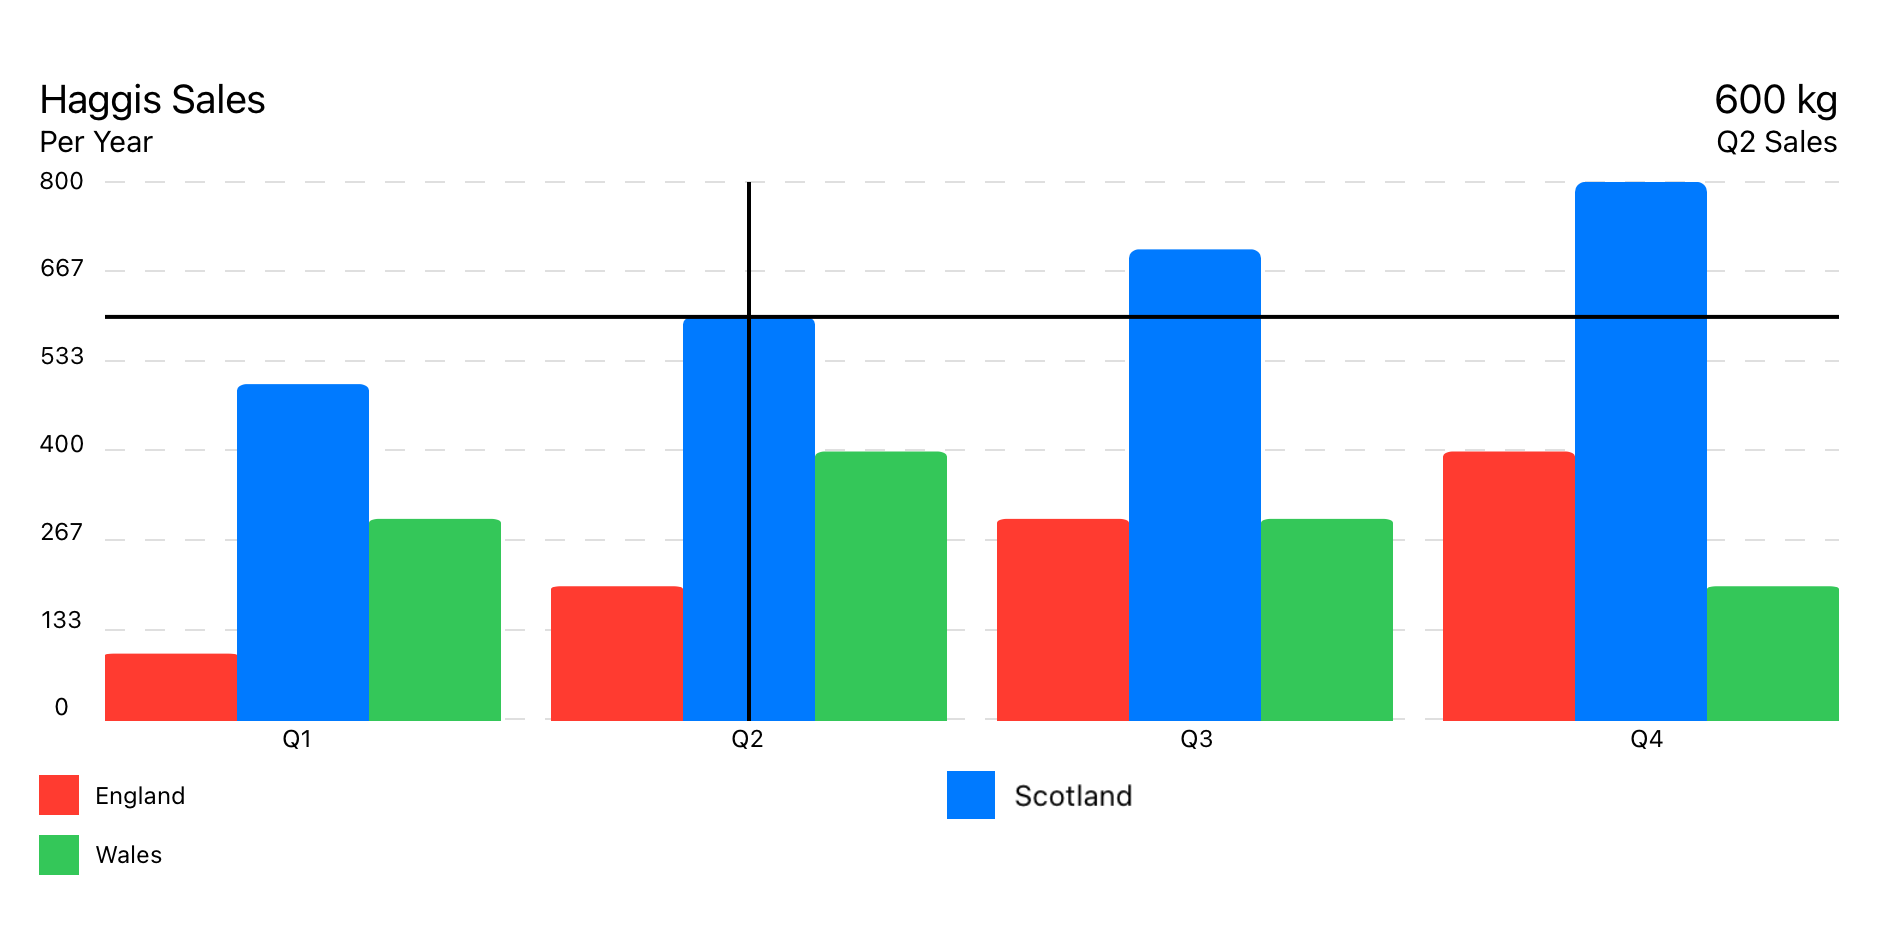
Uses GroupedBarChartData data model.
GroupedBarChart(chartData: GroupedBarChartData)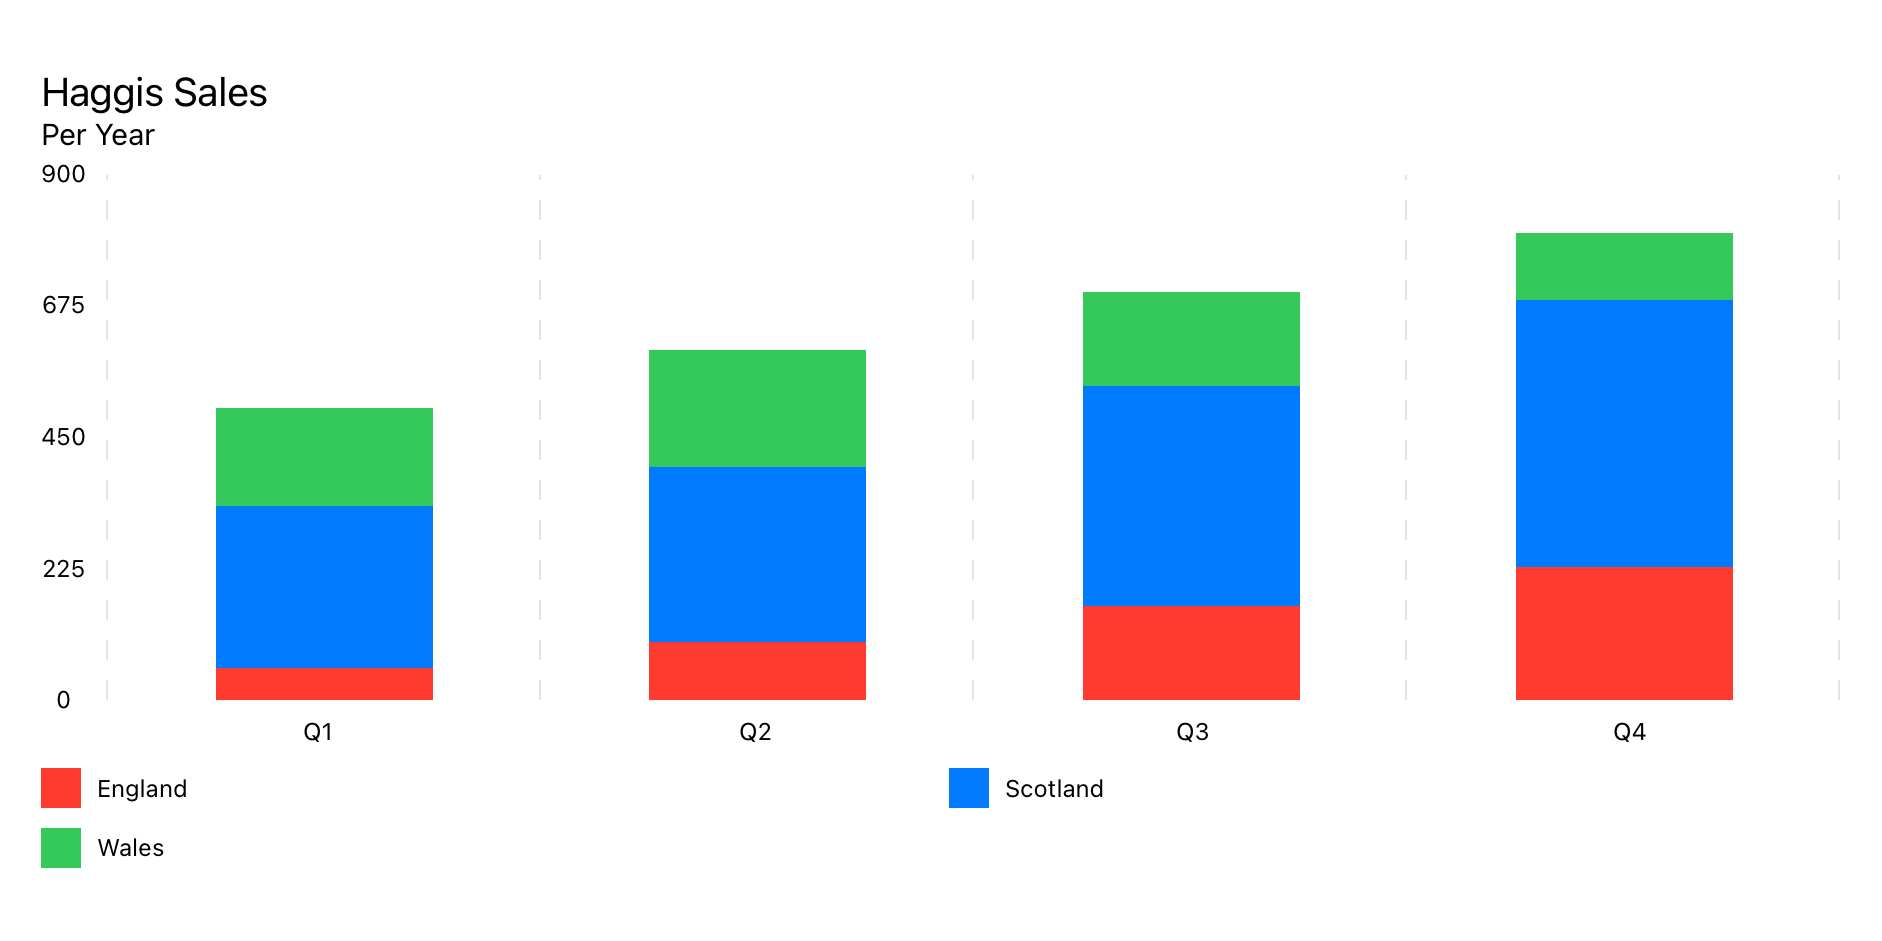
Uses StackedBarChartData data model.
StackedBarChart(chartData: StackedBarChartData)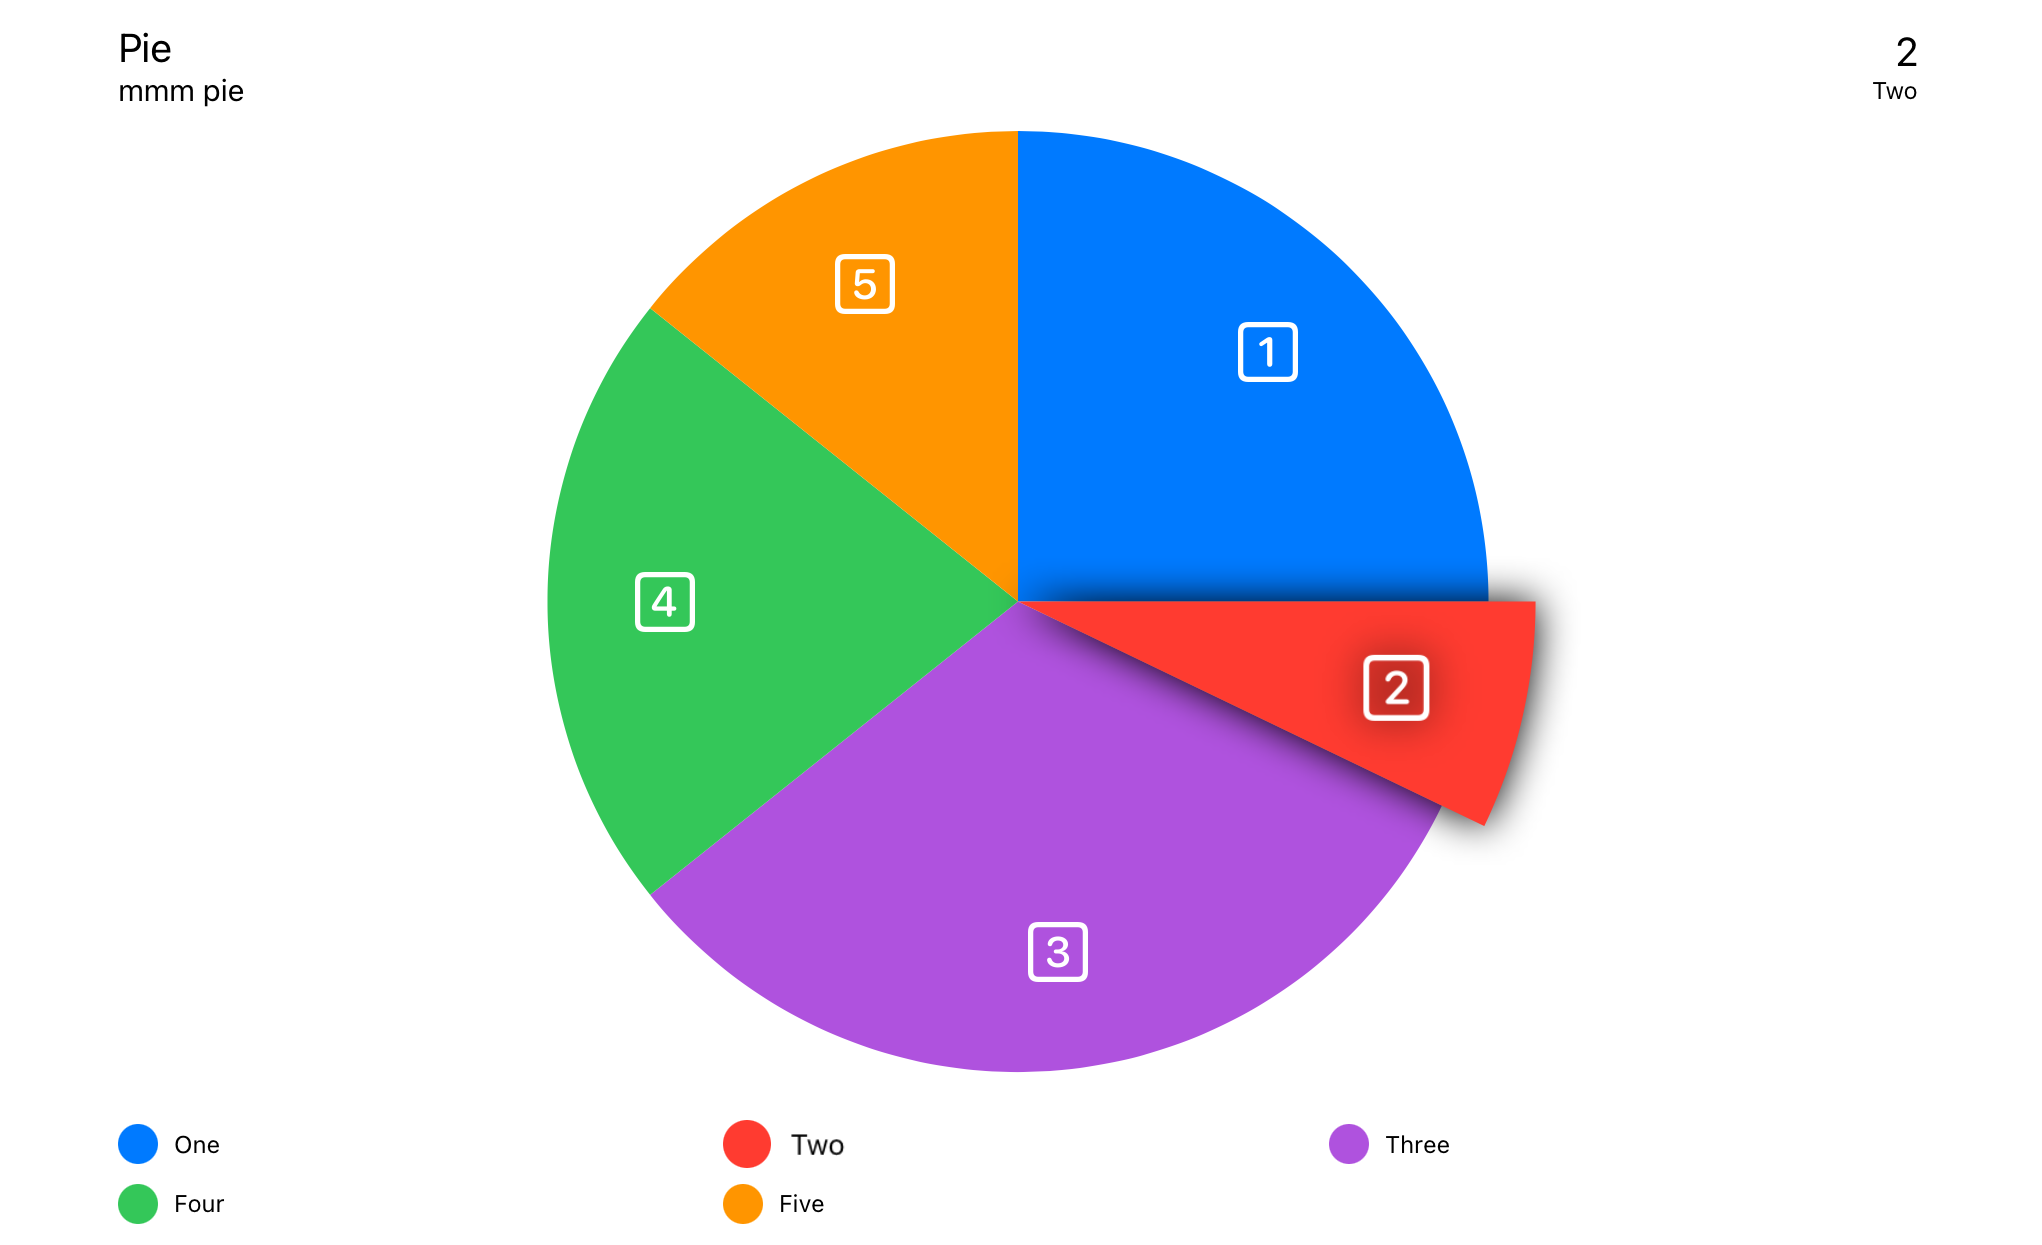
Uses PieChartData data model.
PieChart(chartData: PieChartData)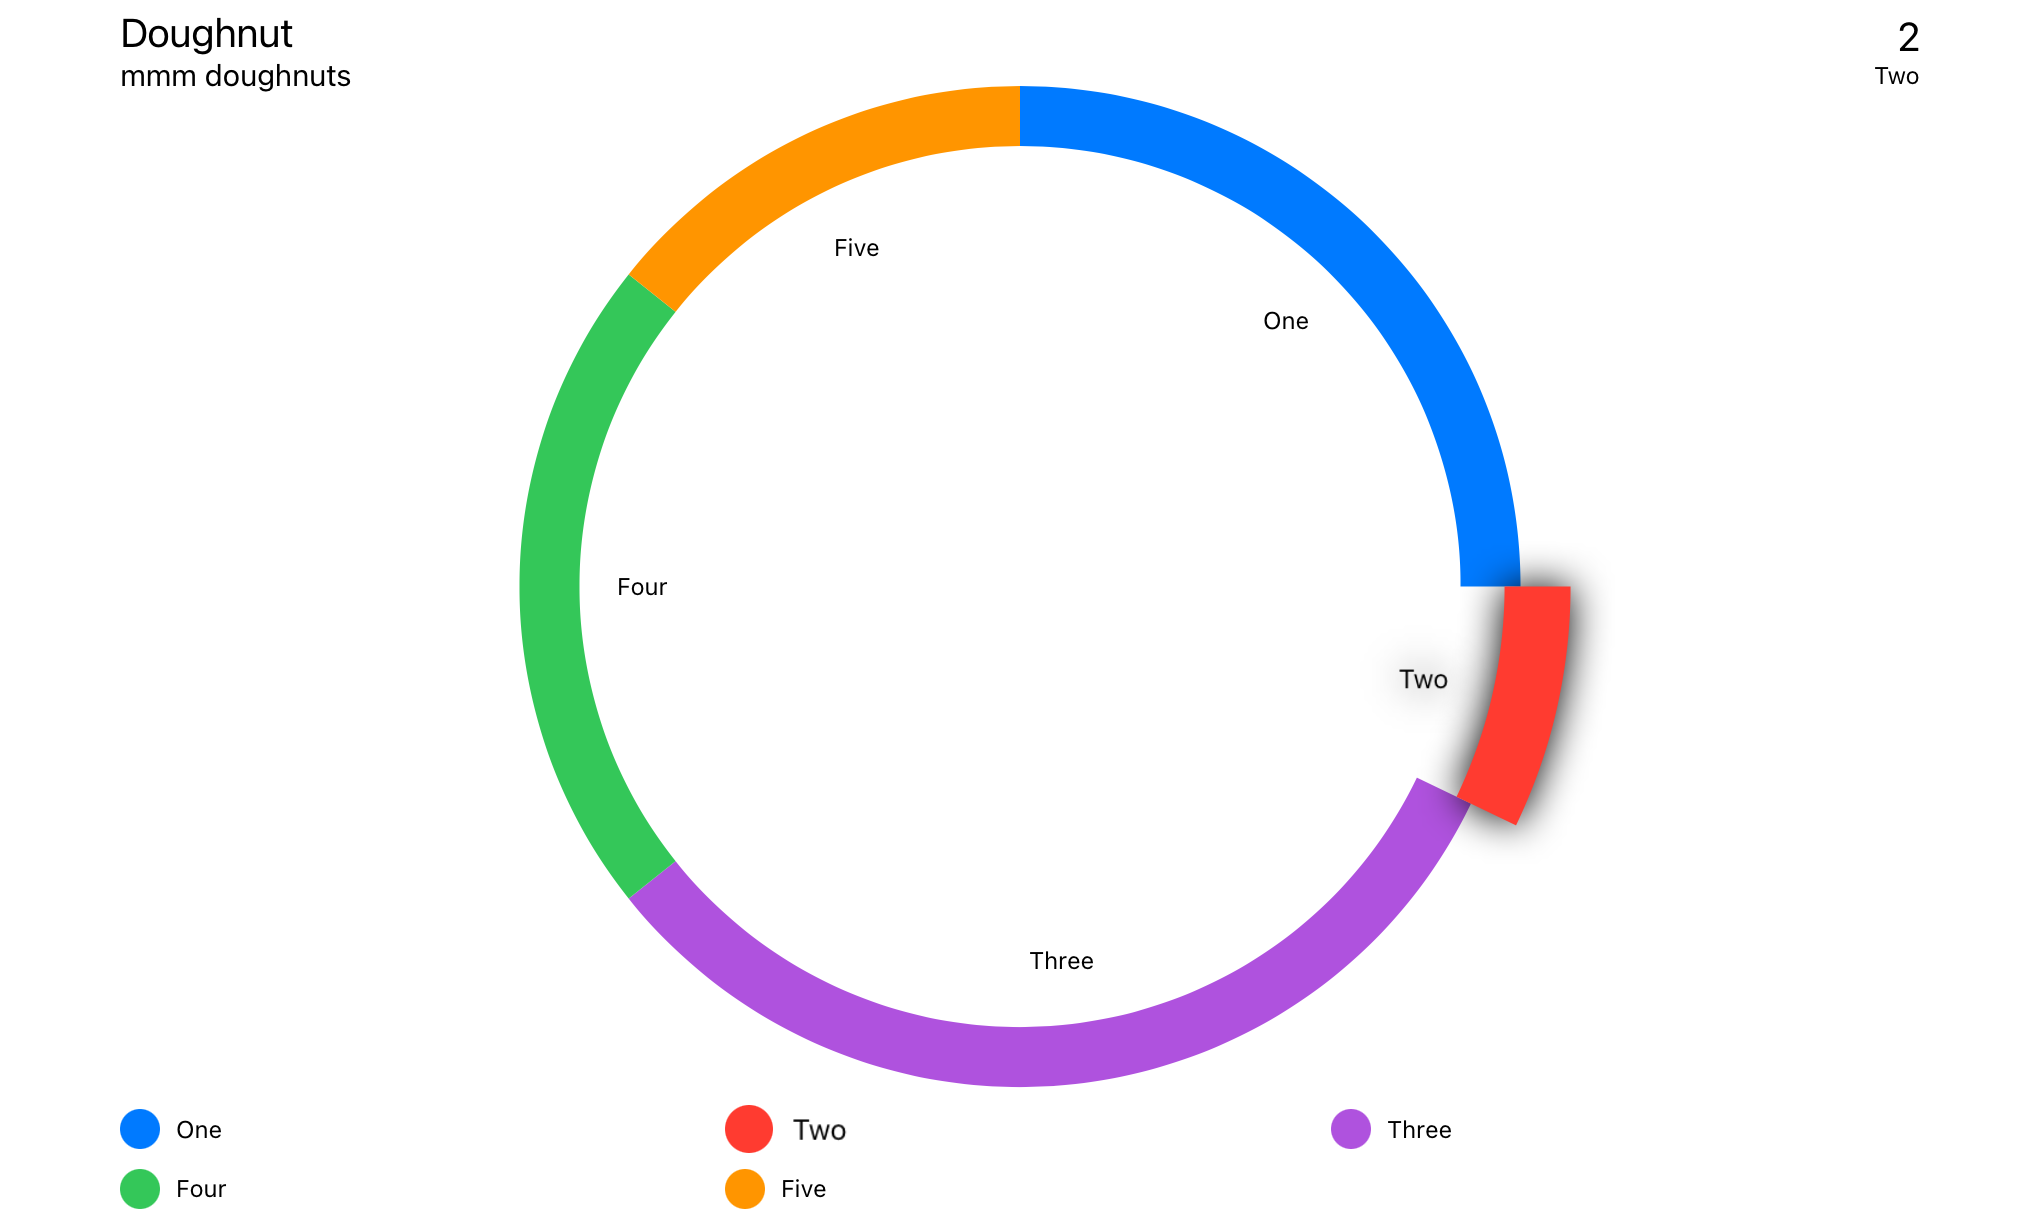
Uses DoughnutChartData data model.
DoughnutChart(chartData: DoughnutChartData)Swift Package Manager
File > Swift Packages > Add Package Dependency...
import SwiftUIChartsIf you have trouble with views not updating correctly, add .id() to your View.
LineChart(chartData: LineChartData)
.id(LineChartData.id)Touch Overlay
Info Box
Floating Info Box
Header Box
Legends
Average Line
Y Axis Point Of Interest
X Axis Grid
Y Axis Grid
X Axis Labels
Y Axis Labels
Linear Trend Line
Point Markers
The order of the view modifiers is some what important as the modifiers are various types of stacks that wrap around the previous views.
Detects input either from touch of pointer. Finds the nearest data point and displays the relevent information where specified.
The location of the info box is set in ChartStyle -> infoBoxPlacement.
.touchOverlay(chartData: CTChartData, specifier: String, unit: TouchUnit)Setup within Chart Data --> Chart Style
Displays the information from Touch Overlay if InfoBoxPlacement is set to .infoBox.
The location of the info box is set in ChartStyle -> infoBoxPlacement.
.infoBox(chartData: CTChartData)Displays the information from Touch Overlay if InfoBoxPlacement is set to .floating.
The location of the info box is set in ChartStyle -> infoBoxPlacement.
.floatingInfoBox(chartData: CTChartData)Displays the metadata about the chart, set in Chart Data -> ChartMetadata
Displays the information from Touch Overlay if InfoBoxPlacement is set to .header.
The location of the info box is set in ChartStyle -> infoBoxPlacement.
.headerBox(chartData: CTChartData)Displays legends.
.legends()Lays out markers over each of the data point.
Shows a marker line at the average of all the data points.
.averageLine(chartData: CTLineBarChartDataProtocol,
             markerName: "Average",
             labelPosition: .yAxis(specifier: "%.0f"),
             lineColour: .primary,
strokeStyle: StrokeStyle(lineWidth: 3, dash: [5,10]))Configurable Point of interest
.yAxisPOI(chartData: CTLineBarChartDataProtocol,
          markerName: "Marker",
          markerValue: 123,
          labelPosition: .center(specifier: "%.0f"),
          labelColour: Color.black,
          labelBackground: Color.orange,
          lineColour: Color.orange,
strokeStyle: StrokeStyle(lineWidth: 3, dash: [5,10]))Adds vertical lines along the X axis.
.xAxisGrid(chartData: CTLineBarChartDataProtocol)Setup within ChartData -> ChartStyle.
Adds horizontal lines along the Y axis.
.yAxisGrid(chartData: CTLineBarChartDataProtocol)Setup within ChartData -> ChartStyle.
Labels for the X axis.
.xAxisLabels(chartData: CTLineBarChartDataProtocol)Setup within ChartData -> ChartStyle.
Automatically generated labels for the Y axis
.yAxisLabels(chartData: CTLineBarChartDataProtocol, specifier: "%.0f")Setup within ChartData -> ChartStyle.
yAxisLabelType:
case numeric // Auto generated, numeric labels.
case custom // Custom labels array
Custom is set from ChartData -> yAxisLabels
A line across the chart to show the trend in the data.
.linearTrendLine(chartData: CTLineBarChartDataProtocol,
                 firstValue: Double,
                 lastValue: Double,
                 lineColour: ColourStyle,
strokeStyle: StrokeStyle)Lays out markers over each of the data point.
.pointMarkers(chartData: CTLineChartDataProtocol)Setup within Data Set -> PointStyle.
Adds an independent line on top of FilledLineChart.
.filledTopLine(chartData: LineChartData,
               lineColour: ColourStyle,
               strokeStyle: StrokeStyle)
Allows for a hard line over the data point with a semi opaque fill.
struct LineChartDemoView: View {

    let data : LineChartData = weekOfData()

    var body: some View {
        VStack {
            LineChart(chartData: data)
                .pointMarkers(chartData: data)
                .touchOverlay(chartData: data, specifier: "%.0f")
                .yAxisPOI(chartData: data,
                          markerName: "Step Count Aim",
                          markerValue: 15_000,
                          labelPosition: .center(specifier: "%.0f"),
                          labelColour: Color.black,
                          labelBackground: Color(red: 1.0, green: 0.75, blue: 0.25),
                          lineColour: Color(red: 1.0, green: 0.75, blue: 0.25),
                          strokeStyle: StrokeStyle(lineWidth: 3, dash: [5,10]))
                .yAxisPOI(chartData: data,
                          markerName: "Minimum Recommended",
                          markerValue: 10_000,
                          labelPosition: .center(specifier: "%.0f"),
                          labelColour: Color.white,
                          labelBackground: Color(red: 0.25, green: 0.75, blue: 1.0),
                          lineColour: Color(red: 0.25, green: 0.75, blue: 1.0),
                          strokeStyle: StrokeStyle(lineWidth: 3, dash: [5,10]))
                .averageLine(chartData: data,
                             strokeStyle: StrokeStyle(lineWidth: 3, dash: [5,10]))
                .xAxisGrid(chartData: data)
                .yAxisGrid(chartData: data)
                .xAxisLabels(chartData: data)
                .yAxisLabels(chartData: data)
                .infoBox(chartData: data)
                .headerBox(chartData: data)
                .legends(chartData: data, columns: [GridItem(.flexible()), GridItem(.flexible())])
                .id(data.id)
                .frame(minWidth: 150, maxWidth: 900, minHeight: 150, idealHeight: 250, maxHeight: 400, alignment: .center)
        }
        .navigationTitle("Week of Data")
    }

    static func weekOfData() -> LineChartData {
        let data = LineDataSet(dataPoints: [
            LineChartDataPoint(value: 12000, xAxisLabel: "M", description: "Monday"),
            LineChartDataPoint(value: 10000, xAxisLabel: "T", description: "Tuesday"),
            LineChartDataPoint(value: 8000,  xAxisLabel: "W", description: "Wednesday"),
            LineChartDataPoint(value: 17500, xAxisLabel: "T", description: "Thursday"),
            LineChartDataPoint(value: 16000, xAxisLabel: "F", description: "Friday"),
            LineChartDataPoint(value: 11000, xAxisLabel: "S", description: "Saturday"),
            LineChartDataPoint(value: 9000,  xAxisLabel: "S", description: "Sunday")
        ],
        legendTitle: "Steps",
        pointStyle: PointStyle(),
        style: LineStyle(lineColour: ColourStyle(colour: .red), lineType: .curvedLine))

        let metadata   = ChartMetadata(title: "Step Count", subtitle: "Over a Week")

        let gridStyle  = GridStyle(numberOfLines: 7,
                                   lineColour   : Color(.lightGray).opacity(0.5),
                                   lineWidth    : 1,
                                   dash         : [8],
                                   dashPhase    : 0)

        let chartStyle = LineChartStyle(infoBoxPlacement    : .infoBox(isStatic: false),
                                        infoBoxBorderColour : Color.primary,
                                        infoBoxBorderStyle  : StrokeStyle(lineWidth: 1),

                                        markerType          : .vertical(attachment: .line(dot: .style(DotStyle()))),

                                        xAxisGridStyle      : gridStyle,
                                        xAxisLabelPosition  : .bottom,
                                        xAxisLabelColour    : Color.primary,
                                        xAxisLabelsFrom     : .dataPoint(rotation: .degrees(0)),

                                        yAxisGridStyle      : gridStyle,
                                        yAxisLabelPosition  : .leading,
                                        yAxisLabelColour    : Color.primary,
                                        yAxisNumberOfLabels : 7,

                                        baseline            : .minimumWithMaximum(of: 5000),
                                        topLine             : .maximum(of: 20000),

                                        globalAnimation     : .easeOut(duration: 1))

        return LineChartData(dataSets       : data,
                             metadata       : metadata,
                             chartStyle     : chartStyle)

    }
}Inside certain elements are additional tags to help describe the chart for VoiceOver.
See Localization of Accessibility
All labels support localization. There are, however, some hidden labels that are there to support VoiceOver. See Localization of Accessibility
See the localization demo in the Demo Project.
Voice over description of a datapoint when the user touches the area closest to the data point.
The VoiceOver will say <chart title>, <data point value>, <data point description>.
"%@ <local_description_of_a_data_point>" = "%@, <Description of a data point>";Read out before a poiMarker.
The VoiceOver will say <p o i marker>, <marker legend title>, <marker value>.
"P-O-I-Marker" = "P O I Marker";
"Average" = "Average";
Voice over description of a poiMarker.
The VoiceOver will say <P-O-I-Marker>, <marker legend title>, <marker value>.
"<local_marker_legend_title> %@" = "local_marker_legend_title, %@";Read out before a axisLabel.
The VoiceOver will say <axisLabel>, <marker value>.
"X-Axis-Label" = "X Axis Label";
"Y-Axis-Label" = "Y Axis Label";
Read out before a legend.
The VoiceOver will say <chart type legend>, <legend title>.
"Line-Chart-Legend" = "Line Chart Legend";
"P-O-I-Marker-Legend" = "P O I Marker Legend";
"Bar-Chart-Legend" = "Bar Chart Legend";
"P-O-I-Marker-Legend" = "P O I Marker Legend";
"Pie-Chart-Legend" = "Pie Chart Legend";
"P-O-I-Marker-Legend" = "P O I Marker Legend";

