nginx module vts
v0.2.2
nginx 가상 호스트 트래픽 상태 모듈
최신 태그 릴리스는 Github 릴리스를 참조하십시오.
이 모듈을 설치 한 후 sudo prove -rt 실행하십시오. 테스트는 Nginx가 포트 80에서 듣기를 요구하기 때문에 sudo 필요합니다.
이전 버전은 테스트되지 않았습니다.
shell> git clone git://github.com/vozlt/nginx-module-vts.git
--add-module=/path/to/nginx-module-vts 추가하여 빌드 구성에 모듈을 추가하십시오.
Nginx 이진을 만듭니다.
Nginx 바이너리를 설치하십시오.
 http {
    vhost_traffic_status_zone;

    ...

    server {

        ...

        location /status {
            vhost_traffic_status_display;
            vhost_traffic_status_display_format html;
        }
    }
}이것은 가상 호스트 상태 정보에 대한 액세스를 제공하는 nginx 모듈입니다. 서버, 업스트림, 캐시와 같은 현재 상태가 포함됩니다. 이것은 Nginx Plus의 라이브 활동 모니터링과 유사합니다. 내장 된 HTML은 이전 버전의 데모 페이지에서 가져옵니다.
우선, 지침 vhost_traffic_status_zone 이 필요하며 지시문 vhost_traffic_status_display 설정되면 다음과 같이 액세스 할 수 있습니다.
/status/format/json 요청하는 경우 라이브 대시 보드 및 타사 모니터링 도구에 사용하기위한 현재 활동 데이터가 포함 된 JSON 문서로 응답합니다./status/format/html 요청하면 내부적으로 /status/format/json 에 요청하는 HTML의 내장 라이브 대시 보드로 응답합니다./status/format/jsonp 요청하는 경우 라이브 대시 보드 및 타사 모니터링 도구에 사용하기위한 현재 활동 데이터가 포함 된 JSONP 콜백 기능으로 응답합니다./status/format/prometheus 요청하는 경우 현재 활동 데이터가 포함 된 Prometheus 문서로 응답합니다./status/control 요청하는 경우 쿼리 문자열을 통해 영역을 재설정하거나 삭제 한 후 JSON 문서로 응답합니다. 제어를 참조하십시오.JSON 문서는 다음과 같이 포함됩니다.
{
    "hostName" : ...,
    "moduleVersion" : ...,
    "nginxVersion" : ...,
    "loadMsec" : ...,
    "nowMsec" : ...,
    "connections" : {
        "active" : ...,
        "reading" : ...,
        "writing" : ...,
        "waiting" : ...,
        "accepted" : ...,
        "handled" : ...,
        "requests" : ...
    },
    "sharedZones" : {
        "name" : ...,
        "maxSize" : ...,
        "usedSize" : ...,
        "usedNode" : ...
    },
    "serverZones" : {
        "..." :{
            "requestCounter" : ...,
            "inBytes" : ...,
            "outBytes" : ...,
            "responses" :{
                "1xx" : ...,
                "2xx" : ...,
                "3xx" : ...,
                "4xx" : ...,
                "5xx" : ...,
                "miss" : ...,
                "bypass" : ...,
                "expired" : ...,
                "stale" : ...,
                "updating" : ...,
                "revalidated" : ...,
                "hit" : ...,
                "scarce" : ...
            },
            "requestMsecCounter" : ...,
            "requestMsec" : ...,
            "requestMsecs" :{
                "times" :[ ... ],
                "msecs" :[ ... ]
            },
            "requestBuckets" :{
                "msecs" :[ ... ],
                "counters" :[ ... ]
            },
        }
        ...
    },
    "filterZones" : {
        "..." :{
            "..." :{
                "requestCounter" : ...,
                "inBytes" : ...,
                "outBytes" : ...,
                "responses" :{
                    "1xx" : ...,
                    "2xx" : ...,
                    "3xx" : ...,
                    "4xx" : ...,
                    "5xx" : ...,
                    "miss" : ...,
                    "bypass" : ...,
                    "expired" : ...,
                    "stale" : ...,
                    "updating" : ...,
                    "revalidated" : ...,
                    "hit" : ...,
                    "scarce" : ...
                },
                "requestMsecCounter" : ...,
                "requestMsec" : ...,
                "requestMsecs" :{
                    "times" :[ ... ],
                    "msecs" :[ ... ]
                },
                "requestBuckets" :{
                    "msecs" :[ ... ],
                    "counters" :[ ... ]
                },
            },
            ...
        },
        ...
    },
    "upstreamZones" : {
        "..." :[
            {
                "server" : ...,
                "requestCounter" : ...,
                "inBytes" : ...,
                "outBytes" : ...,
                "responses" :{
                    "1xx" : ...,
                    "2xx" : ...,
                    "3xx" : ...,
                    "4xx" : ...,
                    "5xx" : ...
                },
                "requestMsecCounter" : ...,
                "requestMsec" : ...,
                "requestMsecs" :{
                    "times" :[ ... ],
                    "msecs" :[ ... ]
                },
                "requestBuckets" :{
                    "msecs" :[ ... ],
                    "counters" :[ ... ]
                },
                "responseMsecCounter" : ...,
                "responseMsec" : ...,
                "responseMsecs" :{
                    "times" :[ ... ],
                    "msecs" :[ ... ]
                },
                "responseBuckets" :{
                    "msecs" :[ ... ],
                    "counters" :[ ... ]
                },
                "weight" : ...,
                "maxFails" : ...,
                "failTimeout" : ...,
                "backup" : ...,
                "down" : ...
            }
            ...
        ],
        ...
    }
    "cacheZones" : {
        "..." :{
            "maxSize" : ...,
            "usedSize" : ...,
            "inBytes" : ...,
            "outBytes" : ...,
            "responses" :{
                "miss" : ...,
                "bypass" : ...,
                "expired" : ...,
                "stale" : ...,
                "updating" : ...,
                "revalidated" : ...,
                "hit" : ...,
                "scarce" : ...
            }
        },
        ...
    }
}* 및 적중률vhost_traffic_status_filter_by_set_key DIGRIVE를 통해 필터링 된 각 서버 영역 당 트래픽 (인/out) 및 요청 및 응답 계열 및 캐시 적중률* ) 및 vhost_traffic_status_filter_by_set_key 지시문을 통해 필터링 된 히트 비율 JSON 문서의 overCounts 객체는 주로 32 비트 시스템 용이며 값이 오버플로되면 1 증가합니다. 지침 vhost_traffic_status_display_format JSON, JSONP, HTML, PROMETHEUS 중 하나 인 기본 OUPUT 형식을 설정합니다. (기본값 : JSON)
다음과 같이 트래픽 계산 :
모든 계산은 Nginx의 로그 처리 단계에서 작동합니다. 내부 리디렉션 (X-Accel-Redirect 또는 Error_Page)은 업스트림 존에서 계산되지 않습니다.
Caveats: 이 모듈은 Nginx 로깅 시스템 (NGX_HTTP_LOG_PHASE : NGINX HTTP의 마지막 단계)에 의존하므로 트래픽은 실제 대역폭 트래픽과 다를 수 있습니다. WebSocket, 취소 된 다운로드는 부정확 한 원인 일 수 있습니다. 모듈의 작동은 Access_Log 지시문 "ON"또는 "OFF"여부에 관계없이 전혀 중요하지 않습니다. 이 모듈은 "Access_Log Off"에서 잘 작동합니다. 여러 도메인을 사용하면 Server_name 지시문의 첫 번째 도메인 (왼쪽)으로 설정됩니다. 원하지 않으면 vhost_traffic_status_filter_by_host, vhost_traffic_status_filter_by_set_key directive를 참조하십시오.
stream 트래픽 통계에 대한 다음 모듈을 참조하십시오.
모든 평균은 현재 지난 64 값에 비해 AMM (산술 평균)으로 계산됩니다.
쿼리 문자열을 통해 트래픽 영역을 재설정하거나 삭제할 수 있습니다. 요청은 JSON 문서로 응답합니다.
{status_uri} / control? cmd = {command} & group = {group} & Zone = {name} http {
geoip_country /usr/share/GeoIP/GeoIP.dat;
vhost_traffic_status_zone;
vhost_traffic_status_filter_by_set_key $geoip_country_code country::*;
...
server {
server_name example.org;
...
vhost_traffic_status_filter_by_set_key $geoip_country_code country:: $server_name ;
location /status {
vhost_traffic_status_display;
vhost_traffic_status_display_format html;
}
}
} 위와 같이 설정되면 Control URI는 example.org/status/control 과 같습니다.
사용 가능한 요청 인수는 다음과 같습니다.
status | reset | delete >status/format/json 같은 JSON 형식으로 반환합니다.server | filter | upstream@alone | upstream@group | cache | * > 이것은 각 영역을 얻을 수 있다는 점을 제외하고는 status/format/json 과 유사합니다.
status/format/json 과 정확히 동일합니다. Mainzones 값은 hostName , moduleVersion , nginxVersion , loadMsec , nowMsec , connections 포함한 기본 상태 값입니다.
namefilter_group @ nameupstream_group @ namenamename지정된 영역의 값을 0으로 재설정합니다.
namefilter_group @ nameupstream_group @ namenamename공유 메모리에서 지정된 영역을 삭제합니다.
namefilter_group @ nameupstream_group @ namenamename vhost_traffic_status_set_by_filter 지시문을 사용하여 nginx 구성의 상태 값을 별도로 얻을 수 있습니다. 거의 모든 상태 값을 획득 할 수 있으며 획득 된 값은 사용자 정의 변수에 저장되어 첫 번째 인수입니다.
 http {

    geoip_country /usr/share/GeoIP/GeoIP.dat;

    vhost_traffic_status_zone;
    vhost_traffic_status_filter_by_set_key $geoip_country_code country::*;

    ...
    upstream backend {
        10.10.10.11:80;
        10.10.10.12:80;
    }

    server {

        server_name example.org;

        ...

        vhost_traffic_status_filter_by_set_key $geoip_country_code country:: $server_name ;

        vhost_traffic_status_set_by_filter $requestCounter server/example.org/requestCounter;
        vhost_traffic_status_set_by_filter $requestCounterKR filter/country::example.org@KR/requestCounter;

        location /backend {
            vhost_traffic_status_set_by_filter $requestCounterB1 upstream@group/[email protected]:80/requestCounter;
            proxy_pass http://backend;
        }
    }
}
위의 설정은 다음과 같습니다.
자세한 사용에 대해서는 vhost_traffic_status_by_by_filter 지시문을 참조하십시오.
다음 상태 정보는 JSON 형식으로 제공됩니다.
/ {status_uri} /format /json
/ {status_uri} / control? cmd = status & ...
{version}(|.dev.{commit}) 형식의 모듈 버전.vhost_traffic_status )vhost_traffic_status_histogram_buckets 지시문에 의해 설정된 히스토그램의 버킷 값.serverZones 과 동일한 필드를 제공합니다.vhost_traffic_status_histogram_buckets 지시문에 의해 설정된 히스토그램의 버킷 값.vhost_traffic_status_histogram_buckets 지시문에 의해 설정된 히스토그램의 버킷 값.weight 설정.max_fails 서버 설정.fail_timeout 설정.backup 설정.down 설정. 기본적으로 이것은 실제 Upstream 서버 상태가 아닌 NGX_HTTP_UPSTREAM_MODULE의 서버 다운 (예 : server backend3.example.com down )입니다. 업스트림 구역 지침을 활성화하면 실제 상태로 변경됩니다.proxy_cache_path 지시문에서 max_size 지정되지 않은 경우 시스템 종속 값 NGX_MAX_OFF_T_VALUE 기본적으로 할당됩니다. 다시 말해,이 값은 내가 지정한 것이 아니라 nginx에서 나온 것입니다.maxSize 값과 마찬가지로 Nginx에서 가져옵니다. / {status_uri} / control? cmd = Reset & ...
/ {status_uri} / control? cmd = 삭제 & ...
다음과 같은 임베디드 변수가 제공됩니다.
지침 vhost_traffic_status_limit_traffic 사용하여 각 호스트 당 총 트래픽을 제한 할 수 있습니다. 또한 지침 vhost_traffic_status_limit_traffic_by_set_key 사용하여 모든 트래픽을 제한 할 수 있습니다. 제한이 초과되면 서버는 요청에 대한 응답으로 503 (서비스를 일시적으로 사용할 수 없음) 오류를 반환합니다. 반환 코드를 변경할 수 있습니다.
 http {

    vhost_traffic_status_zone;

    ...

    server {

        server_name *.example.org;

        vhost_traffic_status_limit_traffic in:64G;
        vhost_traffic_status_limit_traffic out:1024G;

        ...
    }
}
*.example.org 의 총 트래픽을 각각 64g 및 1024g로 제한합니다. vhost_traffic_status_filter_by_host 지시문이 활성화 된 경우 각 도메인마다 개별적으로 작동합니다. http {
geoip_country /usr/share/GeoIP/GeoIP.dat;
vhost_traffic_status_zone;
...
server {
server_name example.org;
vhost_traffic_status_filter_by_set_key $geoip_country_code country:: $server_name ;
vhost_traffic_status_limit_traffic_by_set_key FG@country:: $server_name @US out:1024G;
vhost_traffic_status_limit_traffic_by_set_key FG@country:: $server_name @CN out:2048G;
...
}
}
example.org 에서 미국과 CN으로가는 총 트래픽을 각각 1024g 및 2048g로 제한하십시오. http {
vhost_traffic_status_zone;
...
upstream backend {
server 10.10.10.17:80;
server 10.10.10.18:80;
}
server {
server_name example.org;
location /backend {
vhost_traffic_status_limit_traffic_by_set_key UG@[email protected]:80 in:512G;
vhost_traffic_status_limit_traffic_by_set_key UG@[email protected]:80 in:1024G;
proxy_pass http://backend;
}
...
}
}
example.org 에서 상류 백엔드로 들어가는 총 트래픽을 각 피어 당 512g 및 1024g로 제한하십시오. Caveats: 트래픽은 대역폭이 아닌 누적 전송 또는 카운터입니다.
지침 vhost_traffic_status_filter_by_set_key 사용하여 사용자 정의 개별 통계를 계산할 수 있습니다.
 http {
    geoip_country /usr/share/GeoIP/GeoIP.dat;

    vhost_traffic_status_zone;
    vhost_traffic_status_filter_by_set_key $geoip_country_code country::*;

    ...

    server {

        ...

        vhost_traffic_status_filter_by_set_key $geoip_country_code country:: $server_name ;

        location /status {
            vhost_traffic_status_display;
            vhost_traffic_status_display_format html;
        }
    }
} 기본적으로 Country Flags 이미지는 HTML에 내장되어 있습니다. Country Flags 이미지는 country String이 그룹 이름에 포함되어있는 경우 vhost_traffic_status_filter_by_set_key 지시문의 두 번째 인수입니다.
 http {
    vhost_traffic_status_zone;

    ...

    server {

        ...

        location ~ ^/storage/(.+)/.*$ {
            set $volume $1 ;
            vhost_traffic_status_filter_by_set_key $volume storage:: $server_name ;
        }

        location /status {
            vhost_traffic_status_display;
            vhost_traffic_status_display_format html;
        }
    }
} http {
vhost_traffic_status_zone;
map $http_user_agent $filter_user_agent {
default 'unknown' ;
~ iPhone ios;
~ Android android;
~ (MSIE|Mozilla) windows;
}
vhost_traffic_status_filter_by_set_key $filter_user_agent agent::*;
...
server {
...
vhost_traffic_status_filter_by_set_key $filter_user_agent agent:: $server_name ;
location /status {
vhost_traffic_status_display;
vhost_traffic_status_display_format html;
}
}
}http_user_agent 의 트래픽을 계산하십시오 http {
vhost_traffic_status_zone;
server {
...
vhost_traffic_status_filter_by_set_key $status $server_name ;
location /status {
vhost_traffic_status_display;
vhost_traffic_status_display_format html;
}
}
}http status code 의 트래픽을 계산하십시오 Caveats: $ 상태 변수는 nginx- (1.3.2, 1.2.2)에서 사용할 수 있습니다.
도메인에 여러 DNS A 레코드가있는 경우 필터 기능을 사용하여 도메인의 개별 IP에 대한 트래픽을 계산하거나 proxy_pass의 변수를 계산할 수 있습니다.
 http {
    vhost_traffic_status_zone;

    upstream backend {
        elb.example.org:80;
    }

    ...

    server {

        ...

        location /backend {
            vhost_traffic_status_filter_by_set_key $upstream_addr upstream::backend;
            proxy_pass backend;
        }
    }
}elb.example.org 의 개별 IP 트래픽을 계산하십시오. elb.example.org 에 여러 DNS A 레코드가 있으면 filterZones 에 모든 IP가 표시됩니다. 위의 설정에서 Nginx가 시작되거나 구성을 다시로드함에 따라 DNS 서버를 쿼리하여 도메인을 해결하고 DNS가 메모리에 캐시됩니다. 따라서 DNS A 레코드는 NGINX가 다시 시작하거나 다시로드하지 않는 한 DNS 관리자가 DNS 관리자가 징계되는 경우에도 메모리에서 레코드가 변경되지 않습니다. http {
vhost_traffic_status_zone;
resolver 10.10.10.53 valid=10s
...
server {
...
location /backend {
set $backend_server elb.example.org;
proxy_pass http:// $backend_server ;
}
}
}elb.example.org 의 개별 IP 트래픽을 계산하십시오. elb.example.org 의 DNS 레코드가 변경되면 이전 IP와 새로운 IP ::nogroups 모두 표시됩니다. 첫 번째 업스트림 그룹 설정과 달리 DNS A 레코드를 DNS 관리자가 징수하더라도 두 번째 설정은 잘 작동합니다. Caveats: NGINX DNS에 대한 자세한 내용은 DNS-Service-Discovery-Nginx-Plus를 참조하십시오.
 http {
    vhost_traffic_status_zone;

    ...

    server {

        ...

        location /status {
            vhost_traffic_status_bypass_limit on;
            vhost_traffic_status_bypass_stats on;
            vhost_traffic_status_display;
            vhost_traffic_status_display_format html;
        }
    }
}
/status URI는 상태 트래픽 계산 및 제한 기능에서 제외됩니다. 다음 지침을 참조하십시오. http {
vhost_traffic_status_zone;
vhost_traffic_status_dump /var/log/nginx/vts.db;
...
server {
...
}
}vhost_traffic_status_dump 지시문은 시스템이 재부팅되거나 nginx가 다시 시작된 경우에도 통계 데이터를 영구적으로 유지합니다. 자세한 사용에 대해서는 vhost_traffic_status_dump 지시문을 참조하십시오. {{uri}} 문자열을 status.template.html의 상태 URI로 변경해야합니다. shell> vi share/status.template.html
var vtsStatusURI = "yourStatusUri/format/json", vtsUpdateInterval = 1000;
shell> cp share/status.template.html /usr/share/nginx/html/status.html
nginx.conf 구성하십시오 server {
server_name example.org;
root /usr/share/nginx/html;
# Redirect requests for / to /status.html
location = / {
return 301 /status.html;
}
location = /status.html {}
# Everything beginning /status (except for /status.html) is
# processed by the status handler
location /status {
vhost_traffic_status_display;
vhost_traffic_status_display_format json;
}
}
http://example.org/status.html
share/status.template.html 수정 ( {{uri}} string을 변경하지 마십시오)
다음과 같이 ngx_http_vhost_traffic_status_module_html.h 재현하십시오.
 shell> cd util
shell> ./tplToDefine.sh ../share/status.template.html > ../src/ngx_http_vhost_traffic_status_module_html.h
--add-module=/path/to/nginx-module-vts 추가하여 빌드 구성에 모듈을 추가하십시오.
Nginx 이진을 만듭니다.
Nginx 바이너리를 설치하십시오.

| - | - |
|---|---|
| 통사론 | vhost_traffic_status <on | off> |
| 기본 | 끄다 |
| 문맥 | HTTP, 서버, 위치 |
Description: 모듈 작동을 활성화하거나 비활성화합니다. vhost_traffic_status_zone 지시를 설정하면 자동으로 활성화됩니다.
| - | - |
|---|---|
| 통사론 | vhost_traffic_status_zone [공유 : 이름 : 크기 ] |
| 기본 | 공유 : vhost_traffic_status : 1m |
| 문맥 | http |
Description: 다양한 키의 상태를 유지하는 공유 메모리 영역의 매개 변수를 설정합니다. 캐시는 모든 작업자 프로세스간에 공유됩니다. 대부분의 경우, Nginx-Module-VTS가 사용하는 공유 메모리 크기는 크게 증가하지 않습니다. vhost_traffic_status_filter_by_set_key 지시문을 사용할 때 공유 메모리 크기가 예쁘게 증가하지만 필터의 키가 고정 된 경우 ( 예 : 국가 코드의 총 수는 약 240 ) 지속적으로 증가하지 않습니다.
vhost_traffic_status_filter_by_set_key 지시문을 사용하는 경우 다음과 같이 설정하십시오.
vhost_traffic_status_zone shared:vhost_traffic_status:32m )"ngx_slab_alloc() failed: no memory in vhost_traffic_status_zone" ) error_log에 인쇄 된 경우 (usedsize * 2) 이상으로 증가합니다.| - | - |
|---|---|
| 통사론 | vhost_traffic_status_dump 경로 [ 기간 ] |
| 기본 | - |
| 문맥 | http |
Description: 통계 데이터 덤프 및 복원을 활성화합니다. 경로 는 통계 데이터를 덤프하는 위치입니다. (예 : /var/log/nginx/vts.db ) 기간은 백업주기 시간입니다. (기본값 : 60s) Nginx가 신호 ( SIGKILL )에 의해 종료되면 백업주기에 관계없이 즉시 백업됩니다.
| - | - |
|---|---|
| 통사론 | vhost_traffic_status_display |
| 기본 | - |
| 문맥 | HTTP, 서버, 위치 |
Description: 모듈 디스플레이 핸들러를 활성화하거나 비활성화합니다.
| - | - |
|---|---|
| 통사론 | vhost_traffic_status_display_format <json | html | jsonp | prometheus> |
| 기본 | JSON |
| 문맥 | HTTP, 서버, 위치 |
Description: 디스플레이 핸들러의 출력 형식을 설정합니다. json 설정하면 JSON 문서로 응답합니다. html 설정하면 HTML의 내장 라이브 대시 보드로 응답합니다. jsonp 설정하면 JSONP 콜백 함수 (기본값 : NGX_HTTP_VHOST_TRAFFIC_STATUS_JSONP_CALLBACK )로 응답합니다. prometheus 설정하면 Prometheus 문서로 응답합니다.
| - | - |
|---|---|
| 통사론 | vhost_traffic_status_display_jsonp 콜백 |
| 기본 | ngx_http_vhost_traffic_status_jsonp_callback |
| 문맥 | HTTP, 서버, 위치 |
Description: JSONP의 콜백 이름을 설정합니다.
| - | - |
|---|---|
| 통사론 | vhost_traffic_status_display_sum_key 이름 |
| 기본 | * |
| 문맥 | HTTP, 서버, 위치 |
Description: ServerZones Field의 JSON에서 합계 키 문자열을 설정합니다. 기본 합계 키 문자열은 "*"입니다.
| - | - |
|---|---|
| 통사론 | vhost_traffic_status_filter <on | off> |
| 기본 | ~에 |
| 문맥 | HTTP, 서버, 위치 |
Description: 필터 기능을 활성화하거나 비활성화합니다.
| - | - |
|---|---|
| 통사론 | vhost_traffic_status_filter_by_host <on | off> |
| 기본 | 끄다 |
| 문맥 | HTTP, 서버, 위치 |
Description: 호스트 헤더 필드별로 키를 활성화하거나 비활성화합니다. Nginx의 Server_name 지시문을 on 하고 예를 들어“ *.example.org”로 시작하여 몇 가지 또는 와일드 카드 이름을 설정하고 (a | b | c) .example.org 또는 *.example.org와 같은 호스트 이름으로 서버에 요청한 다음 JSON ServerZones는 다음과 같이 인쇄됩니다.
 server {
  server_name *.example.org;
  vhost_traffic_status_filter_by_host on;

  ...

}
...
"serverZones" : {
"a.example.org" : {
...
},
"b.example.org" : {
...
},
"c.example.org" : {
...
}
...
},
... vhost_traffic_status_filter_by_set_key $host 설정하는 것과 동일한 기능을 제공합니다.
| - | - |
|---|---|
| 통사론 | vhost_traffic_status_filter_by_set_key 키 [ 이름 ] |
| 기본 | - |
| 문맥 | HTTP, 서버, 위치 |
Description: 사용자 정의 변수 별 키를 활성화합니다. 키는 트래픽을 계산하는 키 문자열입니다. 이름은 트래픽을 계산하는 그룹 문자열입니다. 키 와 이름에는 $ host, $ server_name과 같은 변수가 포함될 수 있습니다. 이름 의 그룹은 지정된 경우 filterZones 에 속합니다. Key 의 그룹은 지정된 두 번째 인수 이름이 아닌 경우 serverZones 에 속합니다. GEOIP 모듈의 예제는 다음과 같습니다.
 server {
  server_name example.org;
  vhost_traffic_status_filter_by_set_key $geoip_country_code country:: $server_name ;

  ...

}
...
"serverZones" : {
...
},
"filterZones" : {
"country::example.org" : {
"KR" : {
"requestCounter" : ...,
"inBytes" : ...,
"outBytes" : ...,
"responses" :{
"1xx" : ...,
"2xx" : ...,
"3xx" : ...,
"4xx" : ...,
"5xx" : ...,
"miss" : ...,
"bypass" : ...,
"expired" : ...,
"stale" : ...,
"updating" : ...,
"revalidated" : ...,
"hit" : ...,
"scarce" : ...
},
"requestMsecCounter" : ...,
"requestMsec" : ...,
"requestMsecs" :{
"times" :[ ... ],
"msecs" :[ ... ]
},
},
"US" : {
...
},
...
},
...
},
...
| - | - |
|---|---|
| 통사론 | vhost_traffic_status_filter_check_duplice <on | off> |
| 기본 | ~에 |
| 문맥 | HTTP, 서버, 위치 |
Description: vhost_traffic_status_filter_by_set_key의 중복 제거를 활성화하거나 비활성화합니다. 이 옵션이 활성화 된 경우 각 지침 (HTTP, Server, Location)에서 중복 값 ( key + name ) 중 하나만 처리됩니다.
| - | - |
|---|---|
| 통사론 | vhost_traffic_status_filter_max_node 번호 [ String ...] |
| 기본 | 0 |
| 문맥 | http |
Description: 지정된 숫자 및 문자열 값을 사용하여 필터 크기 제한을 활성화합니다. 숫자가 초과되면 기존 노드는 LRU 알고리즘에 의해 삭제됩니다. 숫자 인수는 제한 될 노드의 크기입니다. 기본값 0 필터를 제한하지 않습니다. 하나의 노드는 JSON 문서의 filterZones 의 객체입니다. 문자열 인수는 vhost_traffic_status_filter_by_set_key directive에 의해 설정된 그룹 문자열 값의 일치하는 문자열 값입니다. 첫 번째 부분 만 일치하더라도 정규 표현식 /^string.*/ 처럼 일치하는 일치가 성공합니다 .*/. 기본적으로 문자열 인수를 설정하지 않으면 모든 필터에 적용됩니다.
예를 위해 :
$ vi nginx.conf
 http {

    geoip_country /usr/share/GeoIP/GeoIP.dat;

    vhost_traffic_status_zone;

    # The all filters are limited to a total of 16 nodes.
    # vhost_traffic_status_filter_max_node 16

    # The `/^uris.*/` and `/^client::ports.*/` group string patterns are limited to a total of 64 nodes.
    vhost_traffic_status_filter_max_node 16 uris client::ports;

    ...

    server {

        server_name example.org;

        ...

        vhost_traffic_status_filter_by_set_key $uri uris:: $server_name ;
        vhost_traffic_status_filter_by_set_key $remote_port client::ports:: $server_name ;
        vhost_traffic_status_filter_by_set_key $geoip_country_code country:: $server_name ;

    }
}
$ for i in {0..1000}; do curl -H 'Host: example.org' -i "http://localhost:80/test$i"; done
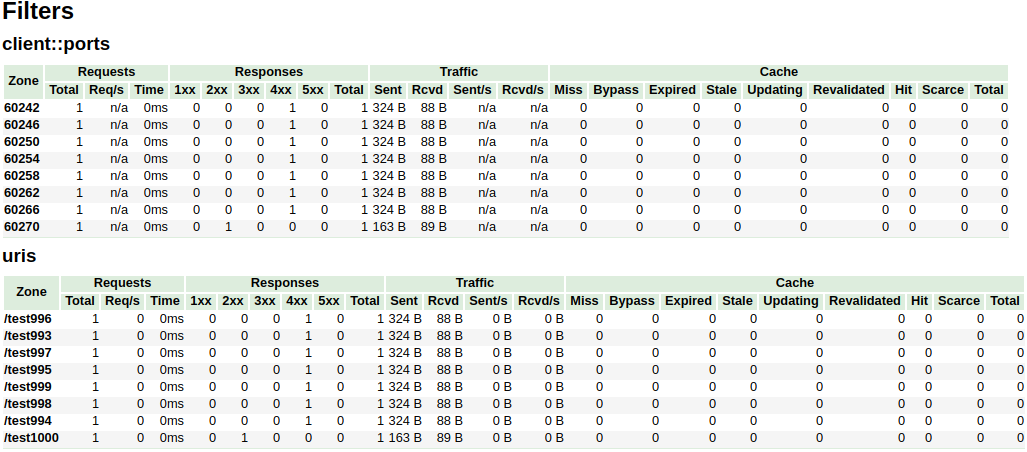
위의 예에서, /^uris.*/ 및 /^client::ports.*/ 그룹 문자열 패턴은 총 16 개의 노드로 제한됩니다. country::.* 과 같은 다른 필터는 제한되지 않습니다.
| - | - |
|---|---|
| 통사론 | vhost_traffic_status_limit <on | off> |
| 기본 | ~에 |
| 문맥 | HTTP, 서버, 위치 |
Description: 제한 기능을 활성화하거나 비활성화합니다.
| - | - |
|---|---|
| 통사론 | vhost_traffic_status_limit_traffic 멤버 : 크기 [ 코드 ] |
| 기본 | - |
| 문맥 | HTTP, 서버, 위치 |
Description: 지정된 멤버 의 트래픽 제한을 활성화합니다. 멤버는 트래픽을 제한하는 회원 문자열입니다. 크기는 트래픽을 제한하기위한 크기 (k/m/g)입니다. 이 코드는 거부 된 요청에 대한 응답으로 반환 할 코드입니다. (기본값 : 503)
사용 가능한 member 스트링은 다음과 같습니다.
| - | - |
|---|---|
| 통사론 | vhost_traffic_status_limit_traffic_by_key 키 멤버 : 크기 [ 코드 ] |
| 기본 | - |
| 문맥 | HTTP, 서버, 위치 |
Description: 지정된 키 및 멤버 의 트래픽 제한을 활성화합니다. 키는 트래픽을 제한하는 키 문자열입니다. 멤버는 트래픽을 제한하는 회원 문자열입니다. 크기는 트래픽을 제한하기위한 크기 (k/m/g)입니다. 이 코드는 거부 된 요청에 대한 응답으로 반환 할 코드입니다. (기본값 : 503)
key 구문은 다음과 같습니다.
group @[ subgroup @] name 사용 가능한 group 문자열은 다음과 같습니다.
subgroup 사용)subgroup 사용) 사용 가능한 member 스트링은 다음과 같습니다.
멤버는 vhost_traffic_status_limit_traffic 지시문과 동일합니다.
| - | - |
|---|---|
| 통사론 | vhost_traffic_status_limit_check_duplice <on | off> |
| 기본 | ~에 |
| 문맥 | HTTP, 서버, 위치 |
Description: vhost_traffic_status_limit_by_set_key의 중복 제거를 활성화하거나 비활성화합니다. 이 옵션이 활성화 된 경우 각 지침 (HTTP, Server, Location)에서 중복 값 ( member | key + member ) 중 하나만 처리됩니다.
| - | - |
|---|---|
| 통사론 | vhost_traffic_status_set_by_by_filter $ variable group / zone / name |
| 기본 | - |
| 문맥 | http, 서버, 위치, if |
Description: 공유 메모리에 저장된 지정된 상태 값을 가져옵니다. 거의 모든 상태 값을 획득 할 수 있으며 획득 된 값은 첫 번째 인수 인 $ 변수 에 저장됩니다.
Caveats: 이름 은 사례에 민감합니다. 모든 반환 값은 정수 유형을 취합니다.
예를 위해 :
$requestCounter server/example.org/requestCounter$requestCounter filter/country::example.org@KR/requestCounter$requestCounter upstream@group/[email protected]:80/requestCounter$requestCounter upstream@alone/10.10.10.11:80/requestCounter$cacheHit cache/my_cache_name/cacheHit| - | - |
|---|---|
| 통사론 | vhost_traffic_status_average_method <AMM|WMA> [ period ] |
| 기본 | AMM 60s |
| 문맥 | http, server, location |
Description: Sets the method which is a formula that calculate the average of response processing times. The period is an effective time of the values used for the average calculation.(Default: 60s) If period set to 0, effective time is ignored. In this case, the last average value is displayed even if there is no requests and after the elapse of time. The corresponding values are requestMsec and responseMsec in JSON.
| - | - |
|---|---|
| 통사론 | vhost_traffic_status_histogram_buckets second ... |
| 기본 | - |
| 문맥 | http, server, location |
Description: Sets the observe buckets to be used in the histograms. By default, if you do not set this directive, it will not work. The second can be expressed in decimal places with a minimum value of 0.001(1ms). The maximum size of the buckets is 32. If this value is insufficient for you, change the NGX_HTTP_VHOST_TRAFFIC_STATUS_DEFAULT_BUCKET_LEN in the src/ngx_http_vhost_traffic_status_node.h
For examples:
0.005 0.01 0.05 0.1 0.5 1 5 100.005 0.01 0.05 0.1 Caveats: By default, if you do not set this directive, the histogram statistics does not work. The restored histograms by vhost_traffic_status_dump directive have no affected by changes to the buckets by vhost_traffic_status_histogram_buckets directive. So you must first delete the zone or the dump file before changing the buckets by vhost_traffic_status_histogram_buckets directive. Similar to the above, delete the dump file when using the histogram for the first time.
| - | - |
|---|---|
| 통사론 | vhost_traffic_status_bypass_limit <on|off> |
| 기본 | 끄다 |
| 문맥 | http, server, location |
Description: Enables or disables to bypass vhost_traffic_status_limit directives. The limit features is bypassed if this option is enabled. This is mostly useful if you want to connect the status web page like /status regardless of vhost_traffic_status_limit directives as follows:
 http {
    vhost_traffic_status_zone;

    ...

    server {

        ...

        location /status {
            vhost_traffic_status_bypass_limit on;
            vhost_traffic_status_display;
            vhost_traffic_status_display_format html;
        }
    }
}| - | - |
|---|---|
| 통사론 | vhost_traffic_status_bypass_stats <on|off> |
| 기본 | 끄다 |
| 문맥 | http, server, location |
Description: Enables or disables to bypass vhost_traffic_status . The traffic status stats features is bypassed if this option is enabled. In other words, it is excluded from the traffic status stats. This is mostly useful if you want to ignore your request in status web page like /status as follows:
 http {
    vhost_traffic_status_zone;

    ...

    server {

        ...

        location /status {
            vhost_traffic_status_bypass_stats on;
            vhost_traffic_status_display;
            vhost_traffic_status_display_format html;
        }
    }
}To cut a release, create a changelog entry PR with git-chglog
 version="v0.2.0"
git checkout -b "cut-${version}"
git-chglog -o CHANGELOG.md --next-tag "${version}"
git add CHANGELOG.md
sed -i "s/NGX_HTTP_VTS_MODULE_VERSION ".*/NGX_HTTP_VTS_MODULE_VERSION "${version}"/" src/ngx_http_vhost_traffic_status_module.h
git add src/ngx_http_vhost_traffic_status_module.h
git-chglog -t .chglog/RELNOTES.tmpl --next-tag "${version}" "${version}" | git commit -F-
After the PR is merged, create the new tag and release on the GitHub Releases.
Stream traffic status
프로 메테우스
System protection
YoungJoo.Kim(김영주) [[email protected]]


