easy analysis
1.0.0
Use this package to perform Data Analysis easily.
pip install arv-easy-analysisFor examples, we are working on tips dataset from seaborn library.
import seaborn as sns
tips = sns.load_dataset("tips")
data.summary module.Get the custom and more insightful summary of your data.
from easy_analysis.data import summary

summary.custom_describe(tips[["total_bill", "tip", "size"]])
Output:
| total_bill | tip | size | |
|---|---|---|---|
| count | 244 | 244 | 244 |
| mean | 19.786 | 2.998 | 2.57 |
| std | 8.902 | 1.384 | 0.951 |
| min | 3.07 | 1 | 1 |
| 1% | 7.25 | 1 | 1 |
| 5% | 9.558 | 1.44 | 2 |
| 25% | 13.348 | 2 | 2 |
| 50% | 17.795 | 2.9 | 2 |
| 75% | 24.127 | 3.562 | 3 |
| 95% | 38.061 | 5.196 | 4 |
| 99% | 48.227 | 7.214 | 6 |
| max | 50.81 | 10 | 6 |
| skew | 1.133 | 1.465 | 1.448 |
| kurtosis | 1.218 | 3.648 | 1.732 |
| notnull | 244 | 244 | 244 |
| isnull | 0 | 0 | 0 |
data.outliers moduleThis function extract the outliers from the given dataset using IQR method and returns the dataframe.
from easy_analysis.data import outliers
outliers.extract_outliers(tips[["total_bill", "tip", "size"]], "total_bill")
Output:
| total_bill | tip | size |
|---|---|---|
| 50.81 | 10 | 3 |
| 48.33 | 9 | 4 |
| 48.27 | 6.73 | 4 |
| 48.17 | 5 | 6 |
| 45.35 | 3.5 | 3 |
| 44.3 | 2.5 | 3 |
| 43.11 | 5 | 4 |
| 41.19 | 5 | 5 |
| 40.55 | 3 | 2 |
plots.univariate moduleUse it for comprehensive univariate plots.
from easy_analysis.plots import univariate
univariate.visualize_feature(tips["total_bill"])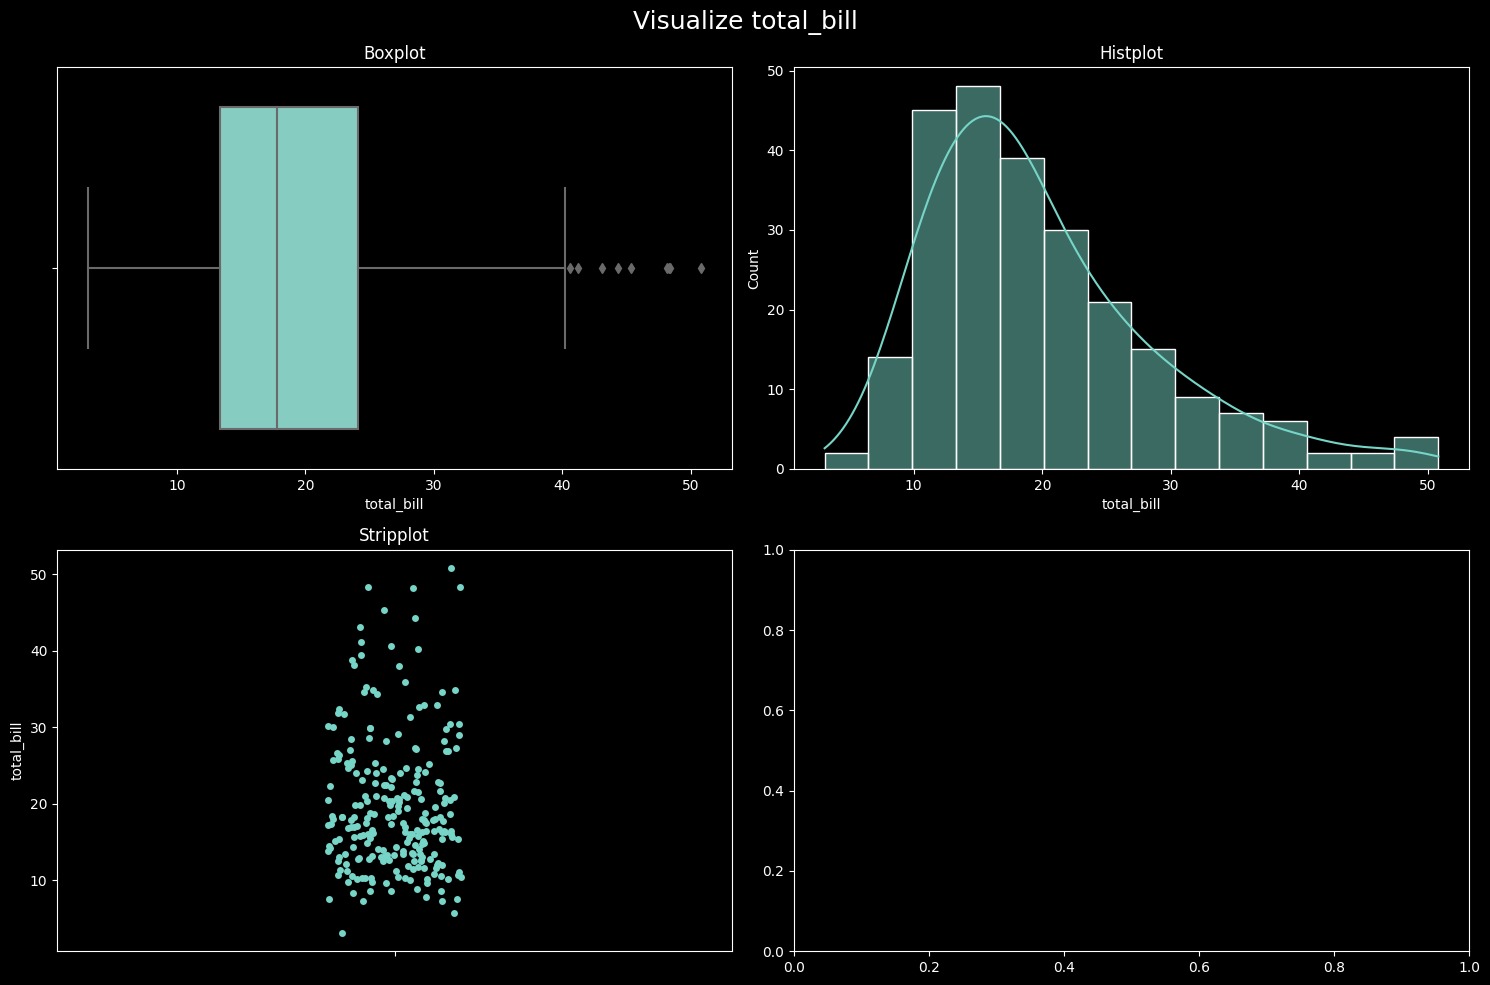
plots.insightsUse insights.null_plot function to get overview of null values in a graph.
from easy_analysis.plots import insights
insights.null_plot(tips) # Output: A graph which gives a overview of null values.If you have any issue or query related to this project you can raise here.


