realtime vector embeddings
1.0.0
 This project is created to understand how similar different pieces of text are in a multi-dimensional space. This is a crucial concept in Natural Language Processing (NLP) tasks such as text classification, clustering, and recommendation systems.
This project is part of llamapp
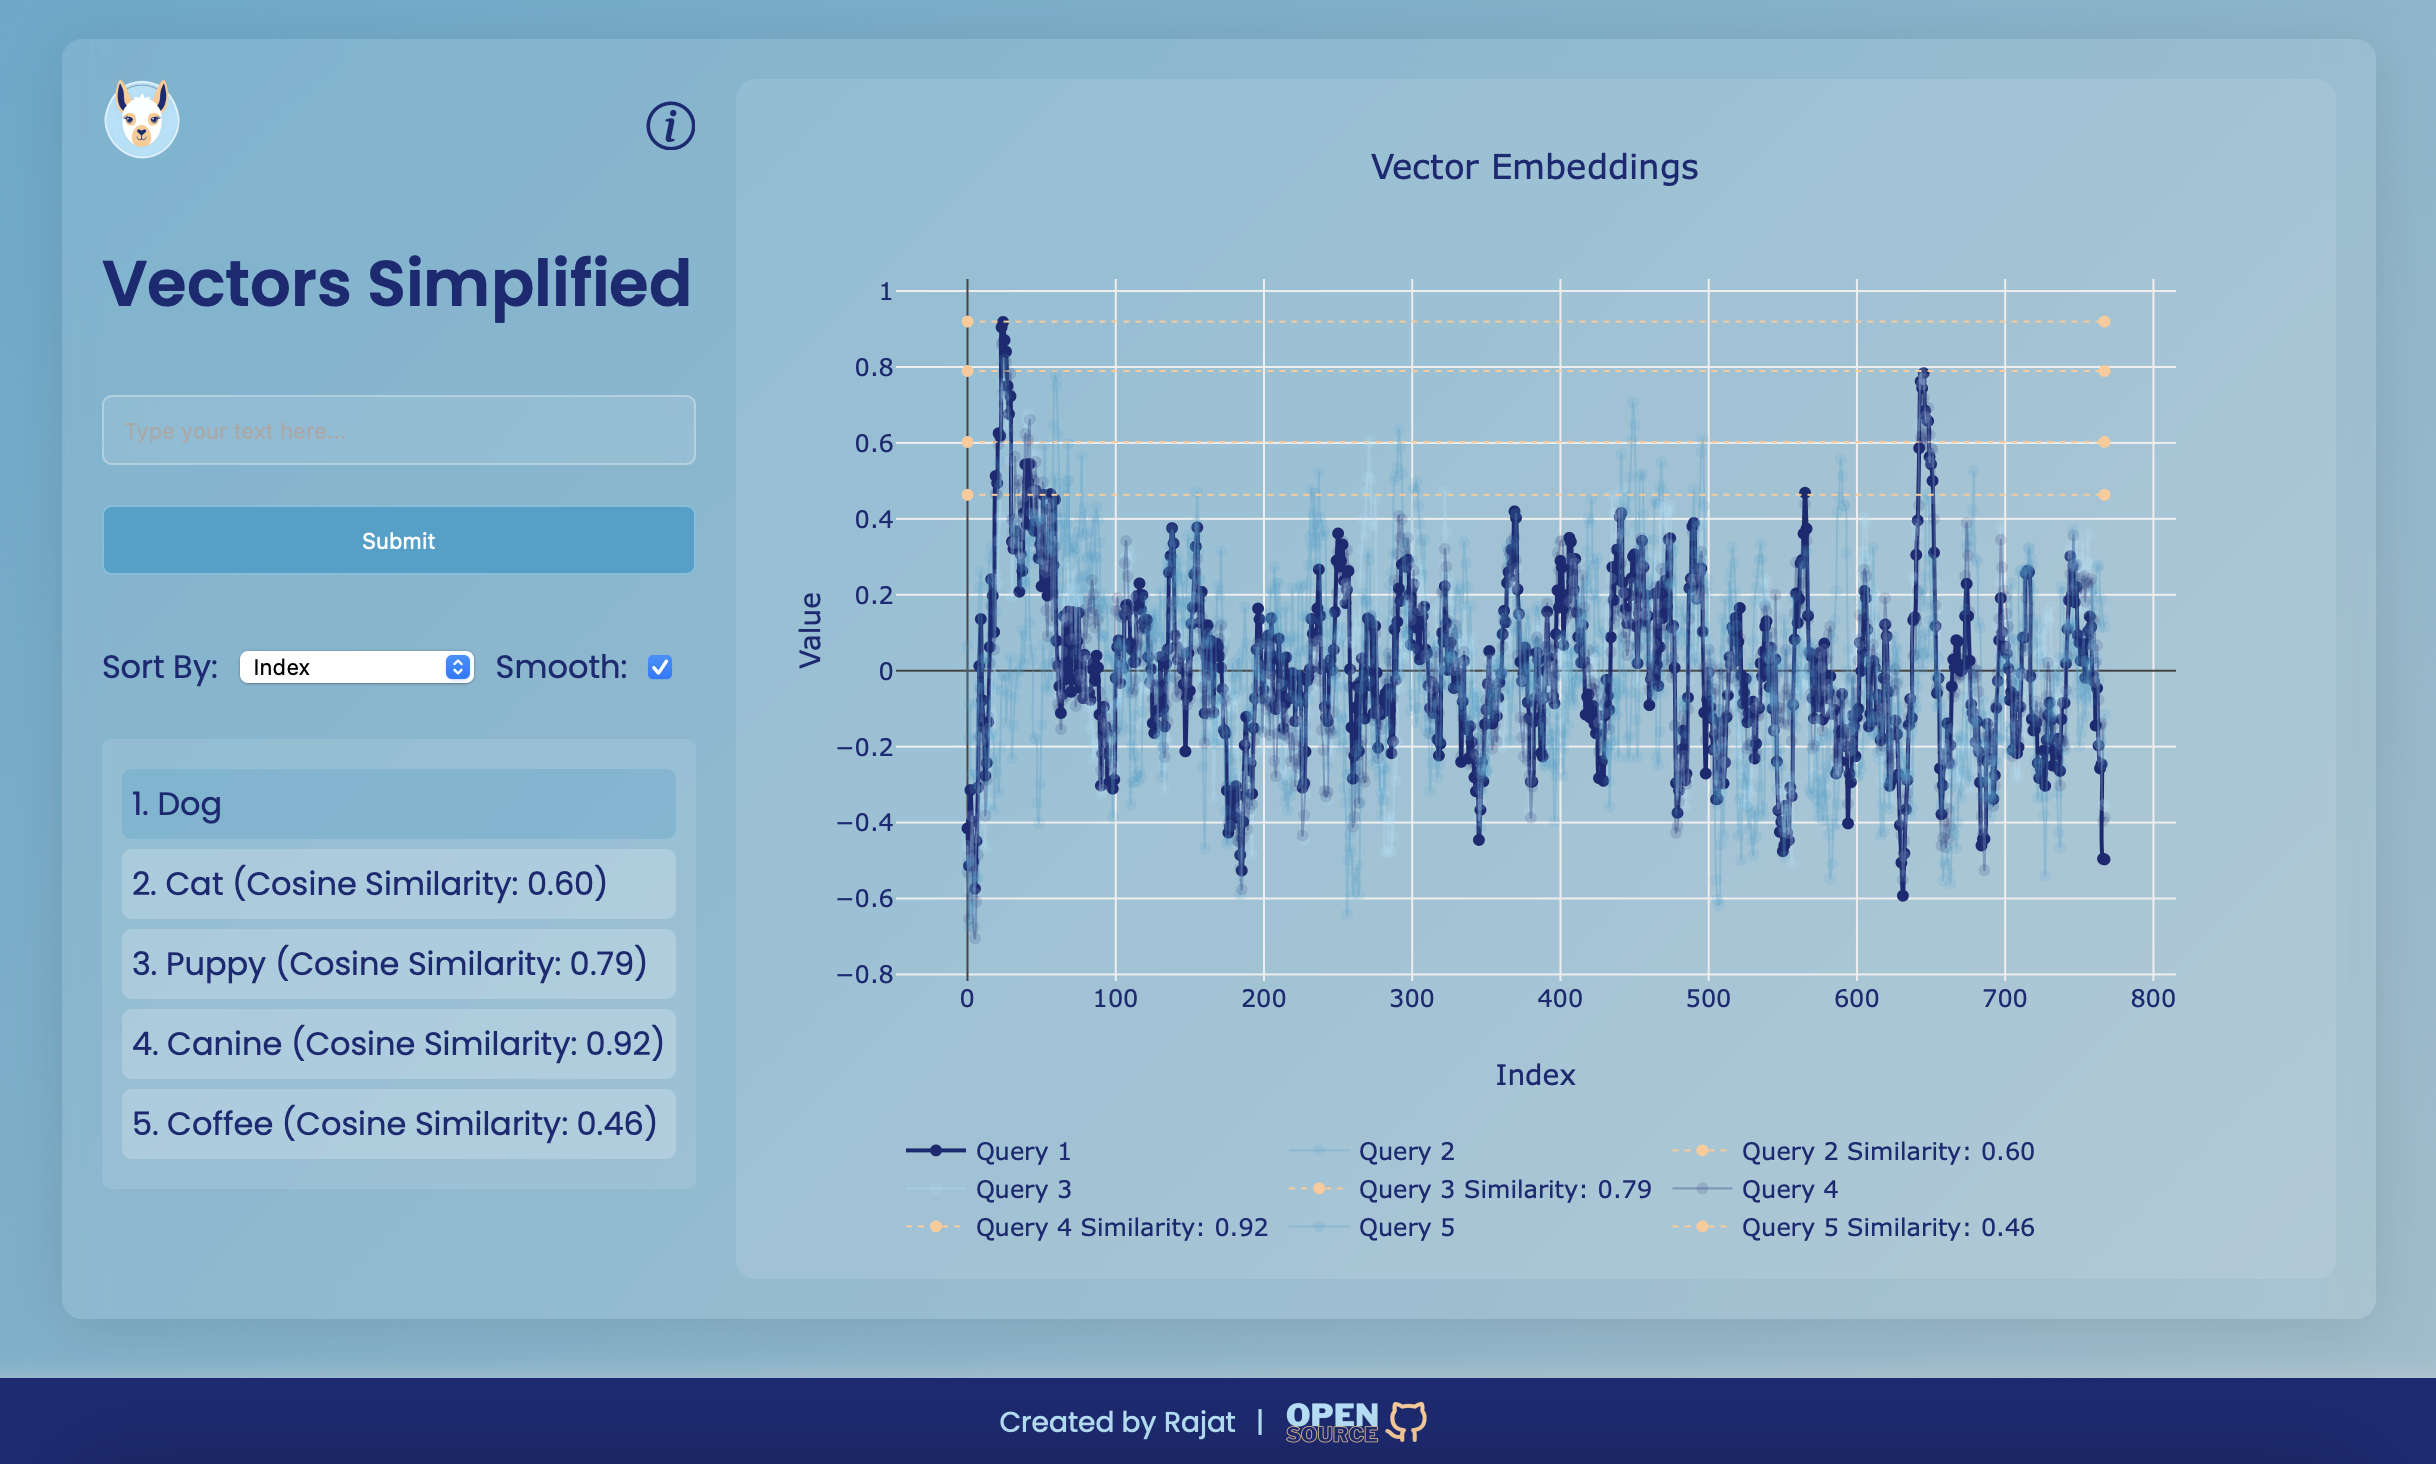
Vectors Simplified is a web application designed to visualize vector embeddings. This project provides a user-friendly interface to input text, generate vector embeddings, and visualize their similarities using interactive plots. The core of the application demonstrates the concept of cosine similarity between vectors, making it easier to understand how similar different pieces of text are in a multi-dimensional space.
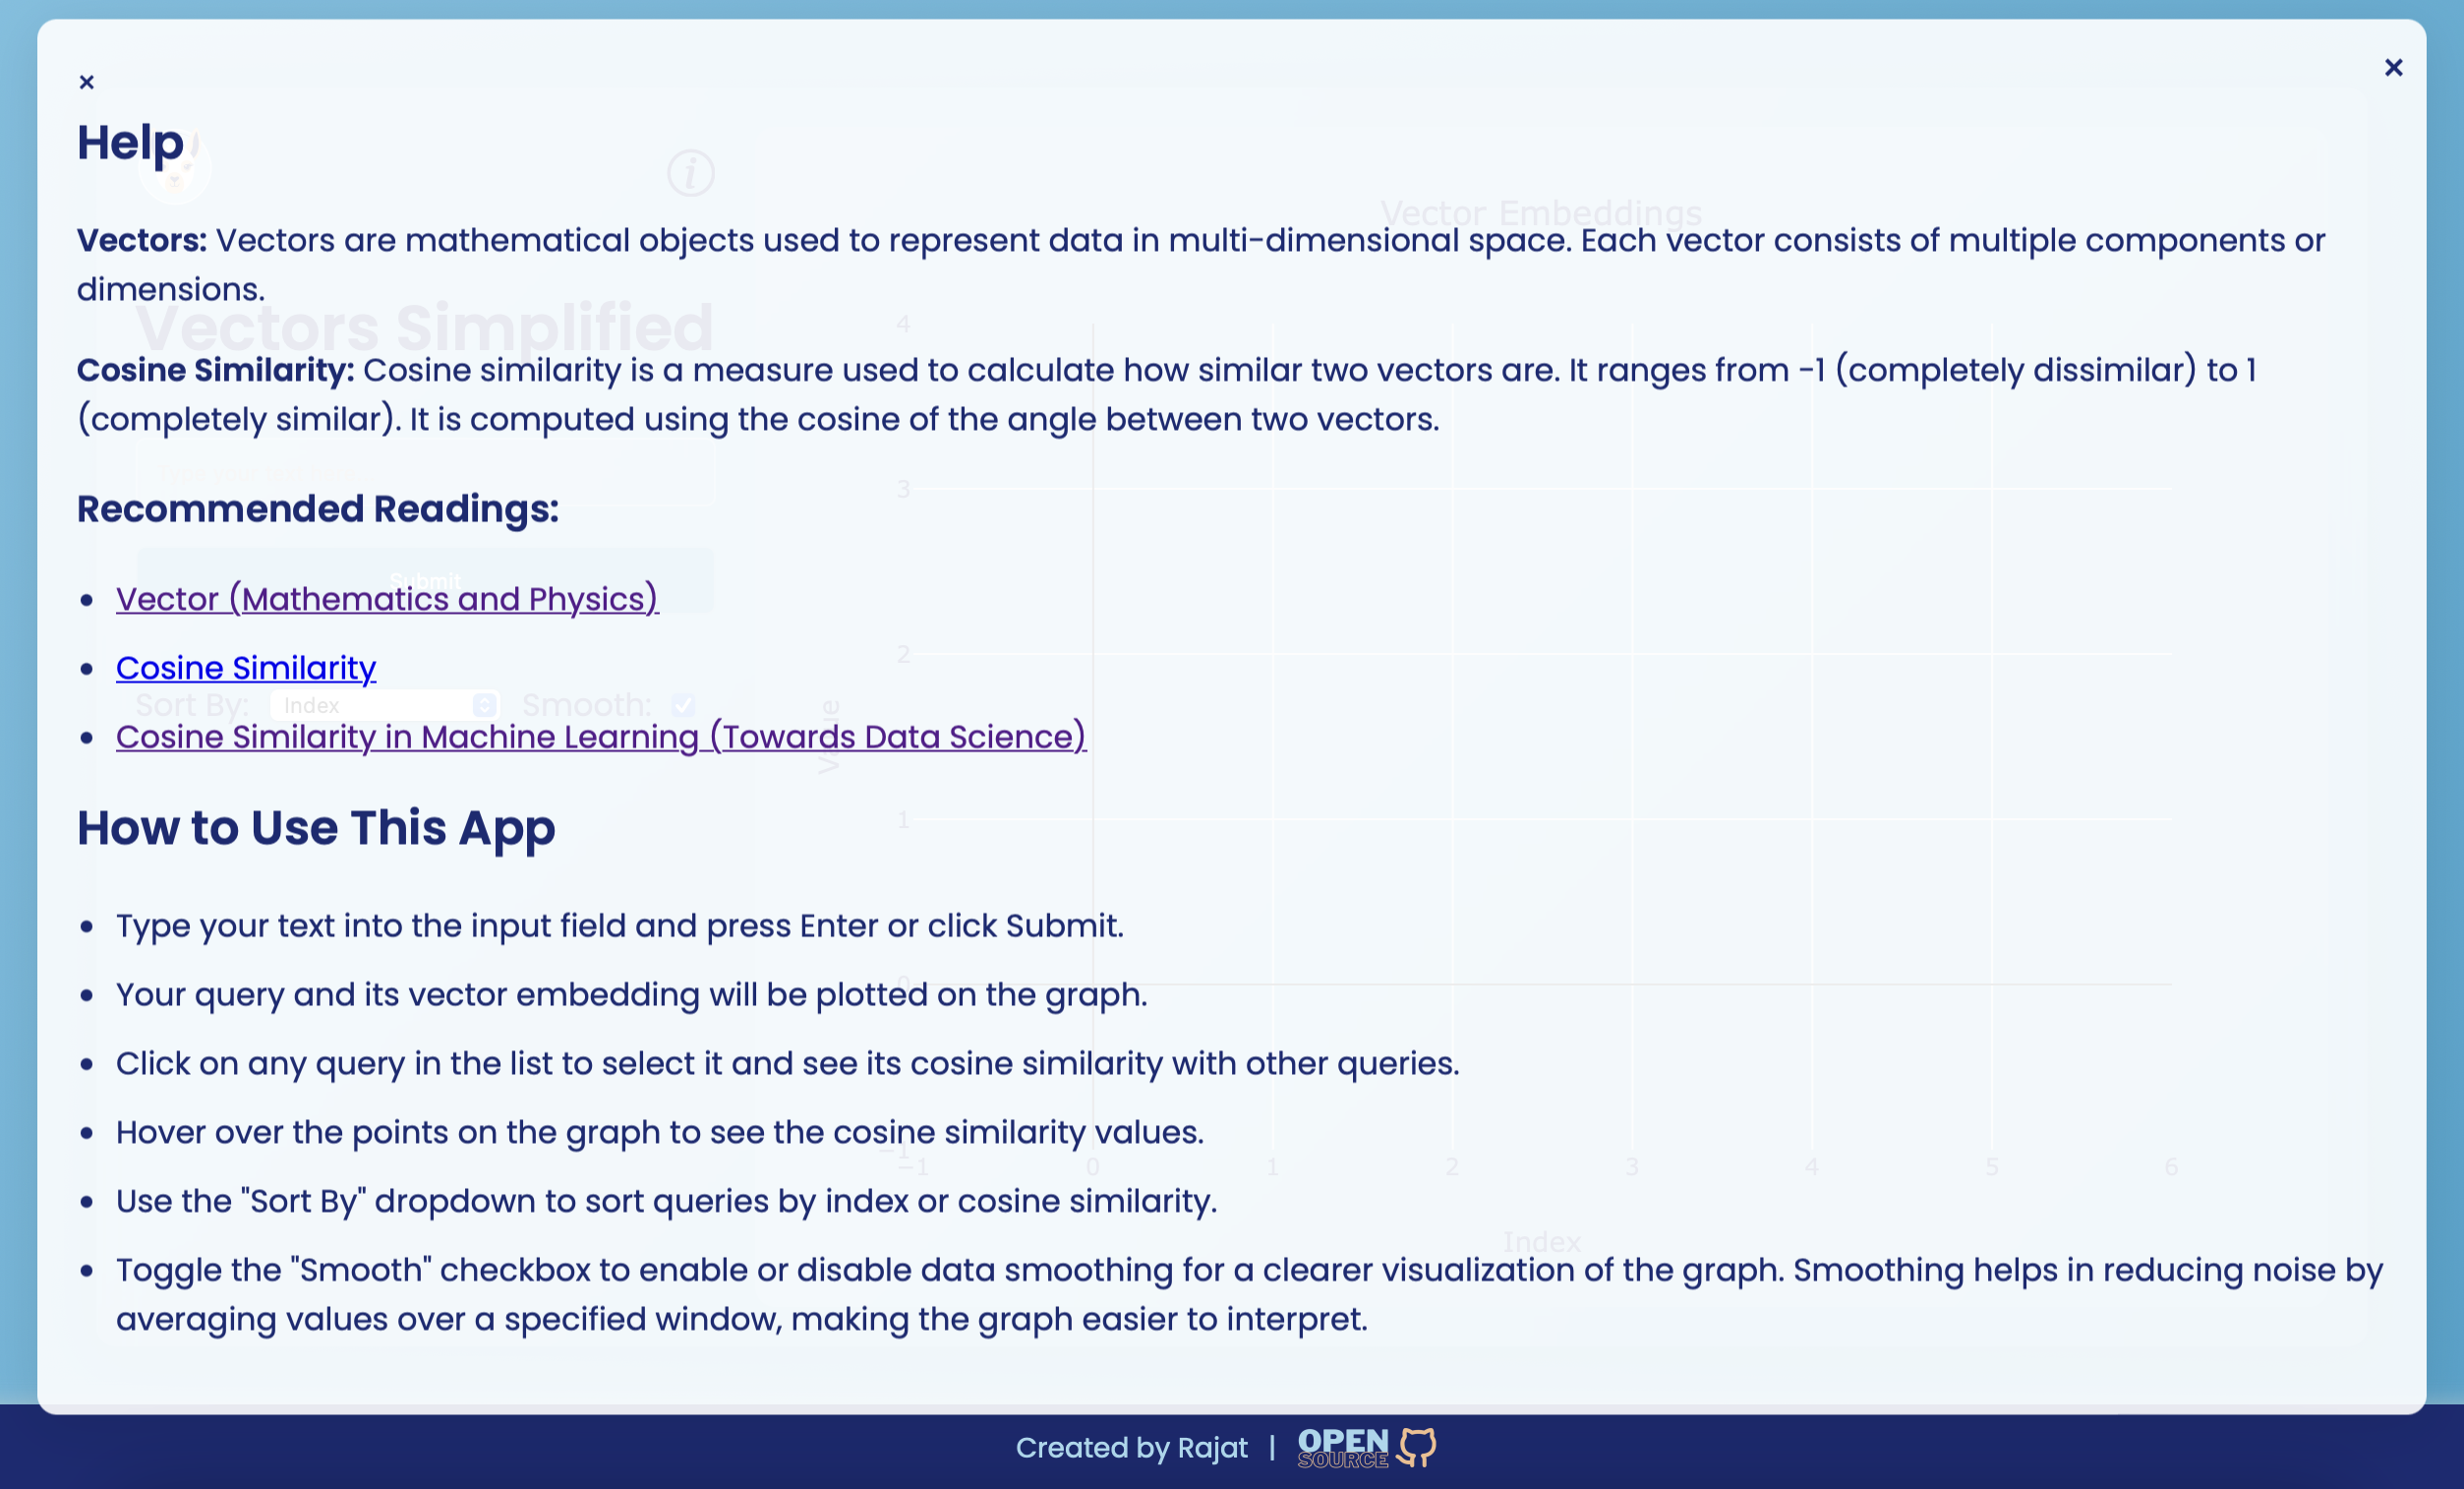
Vector embeddings are numerical representations of text that capture semantic meaning in a high-dimensional space. They are used in various Natural Language Processing (NLP) tasks such as text classification, clustering, and recommendation systems. Each vector consists of multiple components that encode information about the text's features.
Cosine similarity is a metric used to measure how similar two vectors are, based on the cosine of the angle between them. It ranges from -1 (completely dissimilar) to 1 (completely similar). It’s widely used in text analysis to determine how similar two pieces of text are based on their vector representations.
Here’s a simple example of how cosine similarity works with basic vectors:
function calculateCosineSimilarity(vec1, vec2) {
    const dotProduct = vec1.reduce((acc, val, idx) => acc + val * vec2[idx], 0);
    const magnitude1 = Math.sqrt(vec1.reduce((acc, val) => acc + val * val, 0));
    const magnitude2 = Math.sqrt(vec2.reduce((acc, val) => acc + val * val, 0));
    return dotProduct / (magnitude1 * magnitude2);
}

// Example vectors
const vectorA = [1, 2, 3];
const vectorB = [4, 5, 6];

const similarity = calculateCosineSimilarity(vectorA, vectorB);
console.log(`Cosine Similarity: ${similarity.toFixed(2)}`); // Output: Cosine Similarity: 0.9746When visualizing vector embeddings, especially when they contain a large number of items, the graph can become too clustered and difficult to interpret. To address this, a smoothing function is used.
The smoothing function helps in reducing the noise in the data by averaging the values over a specified window size. This makes the graph more readable and allows for better visualization of the overall trends in the data.
Here's how the smoothing function is implemented in the application:
const smoothData = (data, windowSize) => {
    const smoothed = [];
    for (let i = 0; i < data.length; i++) {
        const start = Math.max(0, i - Math.floor(windowSize / 2));
        const end = Math.min(data.length, i + Math.floor(windowSize / 2) + 1);
        const window = data.slice(start, end);
        const average = window.reduce((sum, val) => sum + val, 0) / window.length;
        smoothed.push(average);
    }
    return smoothed;
};
The smoothing can be toggled on or off using a checkbox in the UI, providing flexibility to the user.
Ollama and Nomic-Text-Embed Model
http://localhost:11434.nomic-embed-text command in the terminal by callingollama pull nomic-embed-text
Ollama helps in running Language models locally, large and small. nomic-embed-text isA high-performing open embedding model with a large token context window.
Install Node.js and npm
Clone the repository:
git clone www.github.com/rajatasusual/realtime-vector-embeddings.git
cd realtime-vector-embeddings
Install dependencies:
npm installRun the server:
npm run cliStart typing in the terminal to input text and get vector embeddings. The results and plot will be saved as embedding_plot.png in the current directory.
env file can be found in the project root directory with default settings
PORT=3000
EMBEDDINGS_MODEL=nomic-embed-text
EMBEDDINGS_BASE_URL=http://localhost:11434
SMOOTH=TRUE
Start the Web Server:
npm startThis will start the server with the default port 3000.
Open index.html.
Use the input field to type text and click "Submit" to generate vector embeddings. The results will be displayed on the graph, and you can interact with it to view similarities.
Smoothing Option: Use the "Smooth" checkbox to toggle smoothing on or off for better visualization of the graph.
This project is licensed under the MIT License. See the LICENSE file for more details.


