Star Chart Spherical Projection
verTime, predictPoleStar, new stars

帶有球形投影的Python軟件包,以生成圓形天文星圖(過去,現在和未來),以糾正所有IAU的扭曲,所有IAU命名為恆星準確400,000年以上
2024年南半球的情節星(無星標)
 import star_chart_spherical_projection as scsp

scsp . plotStereographicProjection ( northOrSouth = "South" ,
				displayStarNamesLabels = False ,
				yearSince2000 = 24 )
在1961年(2000 - 39年)(帶有星星標籤和紅色)中,繪製了幾個內置恆星以及兩個新用戶定義的恆星。這使用兩種方法來定義新恆星的適當運動:具有給定的適當運動和角度,並在偏斜和正確的上升中具有適當的運動速度
 import star_chart_spherical_projection as scsp

exalibur_star = scsp . newStar ( starName = "Exalibur" ,
				ra = "14.04.23" ,
				dec = 64.22 ,
				properMotionSpeed = 12.3 ,
				properMotionAngle = 83 ,
				magnitudeVisual = 1.2 )
karaboudjan_star = scsp . newStar ( starName = "Karaboudjan" ,
				ra = "3.14.15" ,
				dec = 10.13 ,
				properMotionSpeedRA = 57.6 ,
				properMotionSpeedDec = 60.1 ,
				magnitudeVisual = 0.3 )
scsp . plotStereographicProjection ( northOrSouth = "North" ,
				builtInStars = [ "Vega" , "Arcturus" , "Altair" ],
				userDefinedStars = [ exalibur_star , karaboudjan_star ],
				displayStarNamesLabels = True ,
				fig_plot_color = "red" ,
				yearSince2000 = - 39 )
在11,500年後,當Vega是新的北極星(最接近 +90°的恆星)之後,返回Vega的最終位置(可以是單星或恆星名單)
 import star_chart_spherical_projection as scsp

star_final_pos_dict = scsp . finalPositionOfStars ( builtInStars = [ "Vega" ],
						yearSince2000 = 11500 ,
						save_to_csv = "final_star_positions.csv" )
返回帶有恆星及其偏角的詞典返回詞典: {'Vega': {'Declination': 83.6899118156341, 'RA': '05.38.21'}}
星星的最終位置保存在final_star_positions.csv中,帶標頭[“恆星名稱”,“右昇華(hh.mm.ss)”,“ deckination(dd.ss)”]
pypi pip安裝在pypi.org/project/star-chart-spherical-provention/
pip install star-chart-spherical-projection
將天體球繪製到2D圖上的第一步是將恆星的右升升映射為沿圖的小時(matplotlib polar plot的theta值),並偏向距離圓的距離(matplotlib polar polar plot的半徑值)。但是,嘗試直接繪製正確的升升和偏斜將導致失真,因為沿偏斜的恆星之間的角度不再保守。在左側,由於這種扭曲,大北斗星的星座被延伸成一個陌生的形狀。通過考慮球形變換,可以校正恆星圖,如右側所示。
| 沒有更正 | 進行更正 |
|---|---|
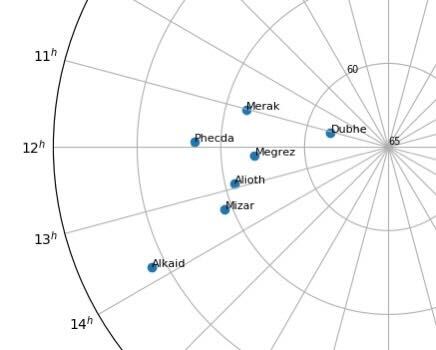 | 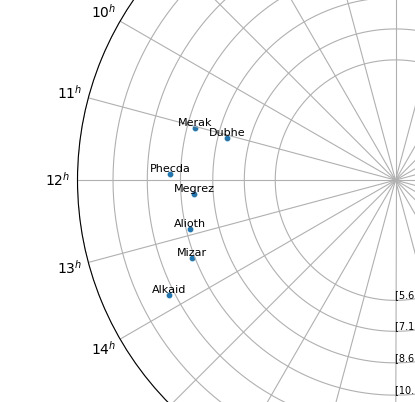 |
球體是從南極投射的(通過立體投影):
從地球表面上的觀察者的角度來看,恆星似乎坐在天體的表面 - 一個任意半徑的虛構球體,地球位於其中心。無論其與地球的真實距離如何,天空中的所有物體都會出現在天體上。每個恆星的位置由兩個值給出。偏斜是距離天赤道的角度距離,右升高是距春分位置的距離。在整整24小時的整整24小時的過程中,由於地球的旋轉,恆星似乎會在天空中旋轉,但它們的位置是固定的。恆星的實際位置確實會隨著時間的流逝而變化,因為恆星的小動作(正確運動)以及地球的旋轉軸的變化(prepession)的綜合結果。
球形投影可以通過將偏差的位置轉換為:
 # Projected from South Pole (Northern Hemisphere)
north_hemisphere_declination = tan(45° + (original_declination / 2))

# Projected from North Pole (Southern Hemisphere)
south_hemisphere_declination = tan(45° - (original_declination / 2))
在北半球的位置,從南極形成了預測: 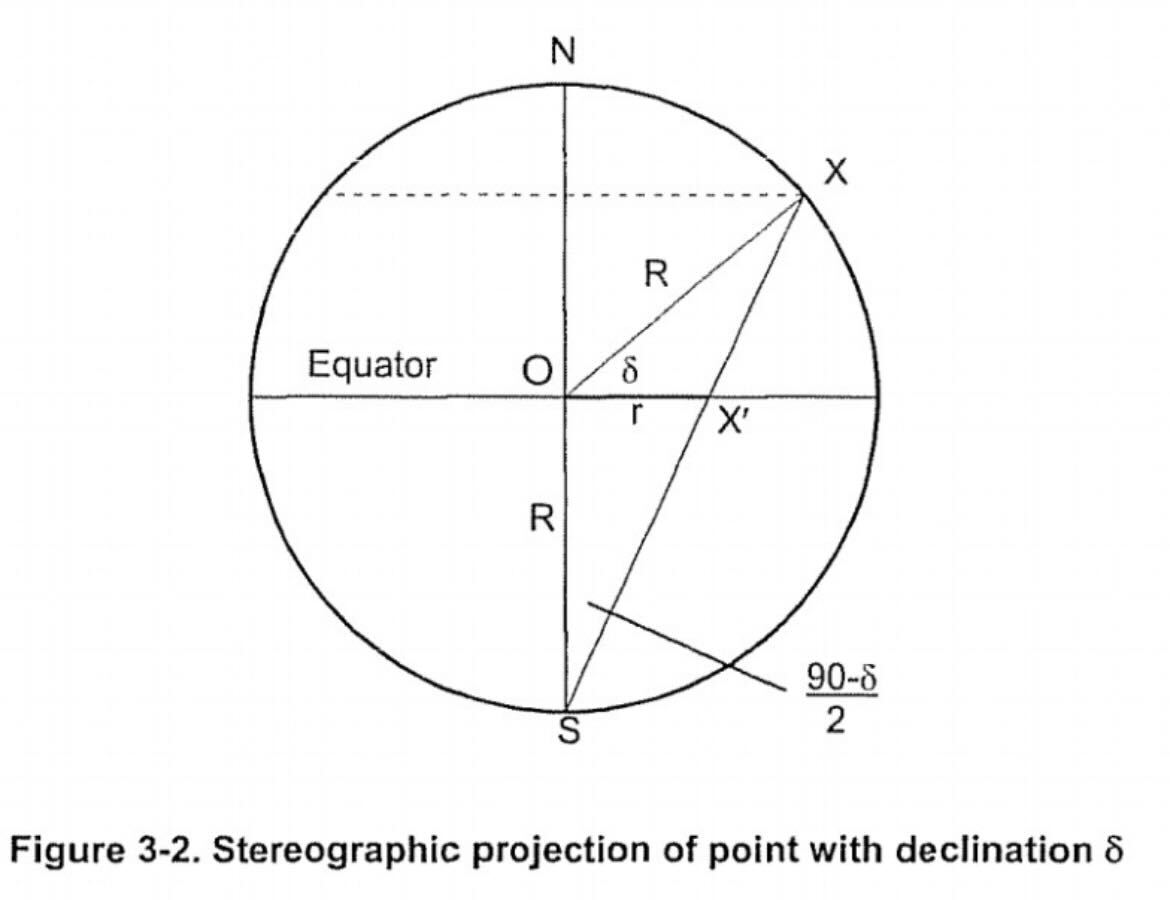
作為內置圖書館的一部分,星圖包含一百多個最亮的星星。但是,可以通過創建NewStar對象來輕鬆添加新的星星以繪製或計算。 NewStar對象將需要一些重要的功能,這些功能繪製了圖形()和finalPositionOfstars()現在可以接受為附加參數。
這可以通過兩種方式創建新星:
1。以適當的運動速度和適當的運動角度
如在sky.org中看到的
 star_chart_spherical_projection.newStar(starName=None,
					ra=None,
					dec=None,
					properMotionSpeed=None,
					properMotionAngle=None,
					magnitudeVisual=None)
沿右升升和偏斜的適當運動速度
如Wikipeida.og所示
 star_chart_spherical_projection.newStar(starName=None,
					ra=None,
					dec=None,
					properMotionSpeedRA=None,
					properMotionSpeedDec=None,
					magnitudeVisual=None)
重要說明:RA/DEC的適當運動將從沿右升升和偏斜的速度轉換為適當的運動速度( properMotionSpeed )和一個角度( properMotionAngle ),以進行進一步的計算
繪圖圖()
立體極圖上的情節星星
 plotStereographicProjection(northOrSouth=None,
			builtInStars=[],
			declination_min=None,
			yearSince2000=0,
			displayStarNamesLabels=True,
			displayDeclinationNumbers=True,
			incrementBy=10,
			isPrecessionIncluded=True,
			maxMagnitudeFilter=None,
			userDefinedStars=[],
			onlyDisplayUserStars=False,
			showPlot=True,
			fig_plot_title=None,
			fig_plot_color="C0",
			figsize_n=12,
			figsize_dpi=100,
			save_plot_name=None)
| Northorsouth =“ North”(-30°至90°)(沒有星級標籤) | Northorsouth =“ South”(30°至-90°)(無星標籤) |
|---|---|
| indenInstars = [](包括所有星星,默認) | buentinstars = [“ vega”,“ arcturus”,“ enif”,“ caph”,“ mimosa”] |
|---|---|
| deckination_min = -30°(默認) | deckination_min = 10° |
|---|---|
| laysince2000 = 0(默認) | laysince2000 = -3100 |
|---|---|
| displaystarnameslabels = true(默認) | displaystarnameslabels = false |
|---|---|
| displayDeclinationNumbers = true(默認)(無星標籤) | displayDeclinationnumbers = false(沒有星級標籤) |
|---|---|
| 增量= 10(默認值)(無星標籤) | 增量= 5(沒有星級標籤) |
|---|---|
| ISPRESPERSIONINCLUDED = TRUE(默認)(laysince2000 = 11500) | ISPRESSECTIONINCLUDED = false(laysince2000 = 11500) |
|---|---|
| maxMagnitudeFilter = none(默認) | maxmagnitude filter = 1 |
|---|---|
| UserDefinedStars = [](默認)(僅使用“ Vega”) | UserDefinedStars = [Exalibur_star,Karaboudjan_star] |
|---|---|
| 唯一displayuserstars = false(默認)帶有UserDefinedStars | 唯一displayuserstars = true with userDefinedstars = [exalibur_star,karaboudjan_star](來自quickstart) |
|---|---|
| fig_plot_title =(默認) | fig_plot_title =“這是星形圖的示例標題” |
|---|---|
| fig_plot_color =“ c0”(默認)(無星標籤) | fig_plot_color =“ darkorchid”(沒有星級標籤) |
|---|---|
finalPositionOfstars()
返回特定年份的恆星最終位置的詞典以格式:{'star name':{“ declination”:neckination(int),“ ra”:ra(str)}
 finalPositionOfStars(builtInStars=[],
		yearSince2000=0,
		isPrecessionIncluded=True,
		userDefinedStars=[],
		onlyDisplayUserStars=False,
		declination_min=None,
		declination_max=None,
		save_to_csv=None)
StarPositionOverTime()
隨著時間的推移返回單星的位置
 starPositionOverTime(builtInStarName=None,
			newStar=None,
			startYearSince2000=None,
			endYearSince2000=None,
			incrementYear=5,
			isPrecessionIncluded=True,
			save_to_csv=None)
Vega5年預測Polestar
自2000年以來,將北/南極星返回給定的一年
predictPoleStar(yearSince2000=0, northOrSouth="North")
South North 90°= -90°,默認為North plotStarPositionOverTime()
隨著時間的流逝,繪製一顆星星的偏差和正確的提升位置
 plotStarPositionOverTime(builtInStarName=None,
			newStar=None,
			startYearSince2000=None,
			endYearSince2000=None,
			incrementYear=10,
			isPrecessionIncluded=True,
			DecOrRA="D",
			showPlot=True,
			showYearMarker=True,
			fig_plot_title=None,
			fig_plot_color="C0",
			figsize_n=12,
			figsize_dpi=100,
			save_plot_name=None)
VegaD或右升升RA ,默認為D10年<STAR NAME> <DECLINATION/RA> (<With/Without> Precession) from <START BCE/CE> to <END BCE/CE>, every <YEAR INCREMENT> YearsC012100傾向的偏差:
 star_chart_spherical_projection . plotStarPositionOverTime ( builtInStarName = "Vega" ,
							newStar = None ,
							startYearSince2000 = - 15000 ,
							endYearSince2000 = 15000 ,
							isPrecessionIncluded = True ,
							incrementYear = 5 ,
							DecOrRA = "D" )
沒有預求的偏差:
 star_chart_spherical_projection . plotStarPositionOverTime ( builtInStarName = "Vega" ,
							newStar = None ,
							startYearSince2000 = - 15000 ,
							endYearSince2000 = 15000 ,
							isPrecessionIncluded = False ,
							incrementYear = 5 ,
							DecOrRA = "D" )
右提升的進步:
 star_chart_spherical_projection . plotStarPositionOverTime ( builtInStarName = "Vega" ,
							newStar = None ,
							startYearSince2000 = - 15000 ,
							endYearSince2000 = 15000 ,
							isPrecessionIncluded = True ,
							incrementYear = 5 ,
							DecOrRA = "R" )
右提升而沒有進步:
 star_chart_spherical_projection . plotStarPositionOverTime ( builtInStarName = "Vega" ,
							newStar = None ,
							startYearSince2000 = - 15000 ,
							endYearSince2000 = 15000 ,
							isPrecessionIncluded = False ,
							incrementYear = 5 ,
DecOrRA = "R" )北半球(以90°為中心)的恆星圖無動。
 star_chart_spherical_projection.plotStereographicProjection(northOrSouth="North",
							displayStarNamesLabels=False,
							yearSince2000=11500,
							isPrecessionIncluded=False,
							fig_plot_color="red")
 star_chart_spherical_projection.plotStereographicProjection(northOrSouth="North",
							displayStarNamesLabels=True,
							yearSince2000=11500,
							isPrecessionIncluded=False,
							fig_plot_color="red")
北半球(以90°為中心)的恆星圖用進攻
 star_chart_spherical_projection.plotStereographicProjection(northOrSouth="North",
							displayStarNamesLabels=False,
							yearSince2000=11500,
							isPrecessionIncluded=True,
							fig_plot_color="red")
 star_chart_spherical_projection.plotStereographicProjection(northOrSouth="North",
							displayStarNamesLabels=True,
							yearSince2000=11500,
							isPrecessionIncluded=True,
							fig_plot_color="red")
南半球(以-90°為中心)的星形圖,沒有進攻
 star_chart_spherical_projection.plotStereographicProjection(northOrSouth="South",
							displayStarNamesLabels=False,
							yearSince2000=11500,
							isPrecessionIncluded=False,
							fig_plot_color="cornflowerblue")
 star_chart_spherical_projection.plotStereographicProjection(northOrSouth="South",
							displayStarNamesLabels=True,
							yearSince2000=11500,
							isPrecessionIncluded=False,
							fig_plot_color="cornflowerblue")
南半球(以-90°為中心)的恆星圖,並進行進攻
 star_chart_spherical_projection.plotStereographicProjection(northOrSouth="South",
							displayStarNamesLabels=False,
							yearSince2000=11500,
							isPrecessionIncluded=True,
							fig_plot_color="cornflowerblue")
 star_chart_spherical_projection.plotStereographicProjection(northOrSouth="South",
							displayStarNamesLabels=True,
							yearSince2000=11500,
							isPrecessionIncluded=True,
							fig_plot_color="cornflowerblue")
為了對star-chart-spherical-projection github repo/fork運行或測試,可以通過conda/miniconda創建開發環境
首先,安裝miniconda
然後,使用現有environment.yml 。
conda env create --file environment.yml
建立環境後,激活環境:
conda activate star_chart
從根目錄運行現有測試和新測試:
python -m pytest
命名為“星號IAU目錄”指定的星形位置(右提升和偏角),以及從sky.org和Wikipedia的正確運動角度和速度
進程模型:Vondrák,J。等。 “新的動力表達式,有效長期間隔。”天文學與天體物理學,第1卷。 534,2011
從Vondrak的長期進步模型GitHub repo“ Vondrak')適應於Python 3+的進動代碼。
提交錯誤修復,問題或功能請求作為GitHub問題或[email protected]


