Star Chart Spherical Projection
verTime, predictPoleStar, new stars

球形の投影を備えた円形天文学スターチャート(過去、現在、未来)を生成するPythonパッケージは、40万年以上の正確な星を正確に除areで歪みを修正します。
2024年の南半球で星をプロットする(星のラベルなし)
 import star_chart_spherical_projection as scsp

scsp . plotStereographicProjection ( northOrSouth = "South" ,
				displayStarNamesLabels = False ,
				yearSince2000 = 24 )
1961年(2000-39)(星のラベルを使用して赤で)の北半球で、いくつかの組み込み星と2つの新しいユーザー定義の星をプロットします。これにより、両方の方法を使用して、新しい星の適切な動きを定義します。特定の適切な動きと角度と、偏角と右昇天の適切な動き速度で
 import star_chart_spherical_projection as scsp

exalibur_star = scsp . newStar ( starName = "Exalibur" ,
				ra = "14.04.23" ,
				dec = 64.22 ,
				properMotionSpeed = 12.3 ,
				properMotionAngle = 83 ,
				magnitudeVisual = 1.2 )
karaboudjan_star = scsp . newStar ( starName = "Karaboudjan" ,
				ra = "3.14.15" ,
				dec = 10.13 ,
				properMotionSpeedRA = 57.6 ,
				properMotionSpeedDec = 60.1 ,
				magnitudeVisual = 0.3 )
scsp . plotStereographicProjection ( northOrSouth = "North" ,
				builtInStars = [ "Vega" , "Arcturus" , "Altair" ],
				userDefinedStars = [ exalibur_star , karaboudjan_star ],
				displayStarNamesLabels = True ,
				fig_plot_color = "red" ,
				yearSince2000 = - 39 )
ベガが新しいノースポールスター( +90°に最も近い星)である11、500年後、ベガの最終的な位置(シングルスターまたは星のリストになることができます)を返します。
 import star_chart_spherical_projection as scsp

star_final_pos_dict = scsp . finalPositionOfStars ( builtInStars = [ "Vega" ],
						yearSince2000 = 11500 ,
						save_to_csv = "final_star_positions.csv" )
星とその偏角と右昇天で辞書を返します: {'Vega': {'Declination': 83.6899118156341, 'RA': '05.38.21'}}
星の最終的な位置は、 final_star_positions.csvでヘッダーを使用して保存されます。
pypi.org/project/star-chart-spherical-projective/にpypi pipインストール
pip install star-chart-spherical-projection
天体球を2Dプロットにプロットする最初のステップは、星の右昇天をプロットに沿った時間としてマッピングすること(Matplotlib Polar Plotのシータ値)と、円の中心からの距離(Matplotlib Polar Plotの半径値)としての偏傾です。ただし、偏角に沿った星間の角度がもはや保存されていないため、適切な昇天と偏角を直接マッピングしようとすると、歪みが生じます。左側では、この歪みのために、大きなディッパーの星座がなじみのない形に伸びます。球状変換を考慮することにより、右側に見られるように星図を修正できます。
| 修正なし | 修正付き |
|---|---|
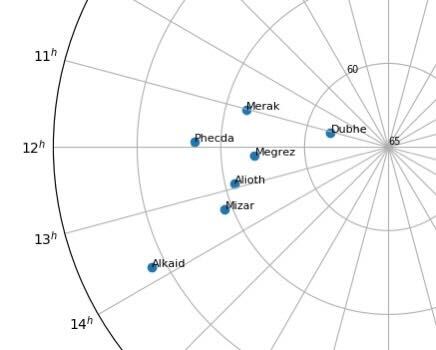 | 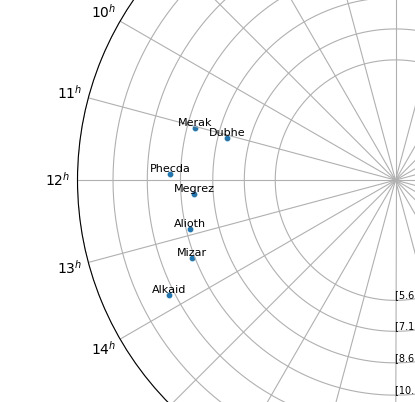 |
球体は南極から投影されます(ステレオグラフィー投影を介して):
地球の表面上の観察者の観点から見ると、星は天の球体の表面に沿って座っているように見えます - その中心に地球を持つ任意の半径の想像上の球体。空のすべてのオブジェクトは、地球からの真の距離に関係なく、天の球に投影されているように見えます。各星の位置は2つの値で与えられます。偏角は天の赤道からの角距離であり、右昇天は春分の位置からの距離です。 24時間の完全な1日の間に、星は地球の回転の結果として空を横切って回転するように見えますが、その位置は固定されています。星の実際の位置は、星の小さな動き(適切な動き)の合計結果と、地球の回転軸の変化(歳差運動)として時間とともに変化します。
球状の投影は、偏角の位置を次のように変換することにより、角度の歪みを克服できます。
 # Projected from South Pole (Northern Hemisphere)
north_hemisphere_declination = tan(45° + (original_declination / 2))

# Projected from North Pole (Southern Hemisphere)
south_hemisphere_declination = tan(45° - (original_declination / 2))
北半球では、南極から投影が形成されます。 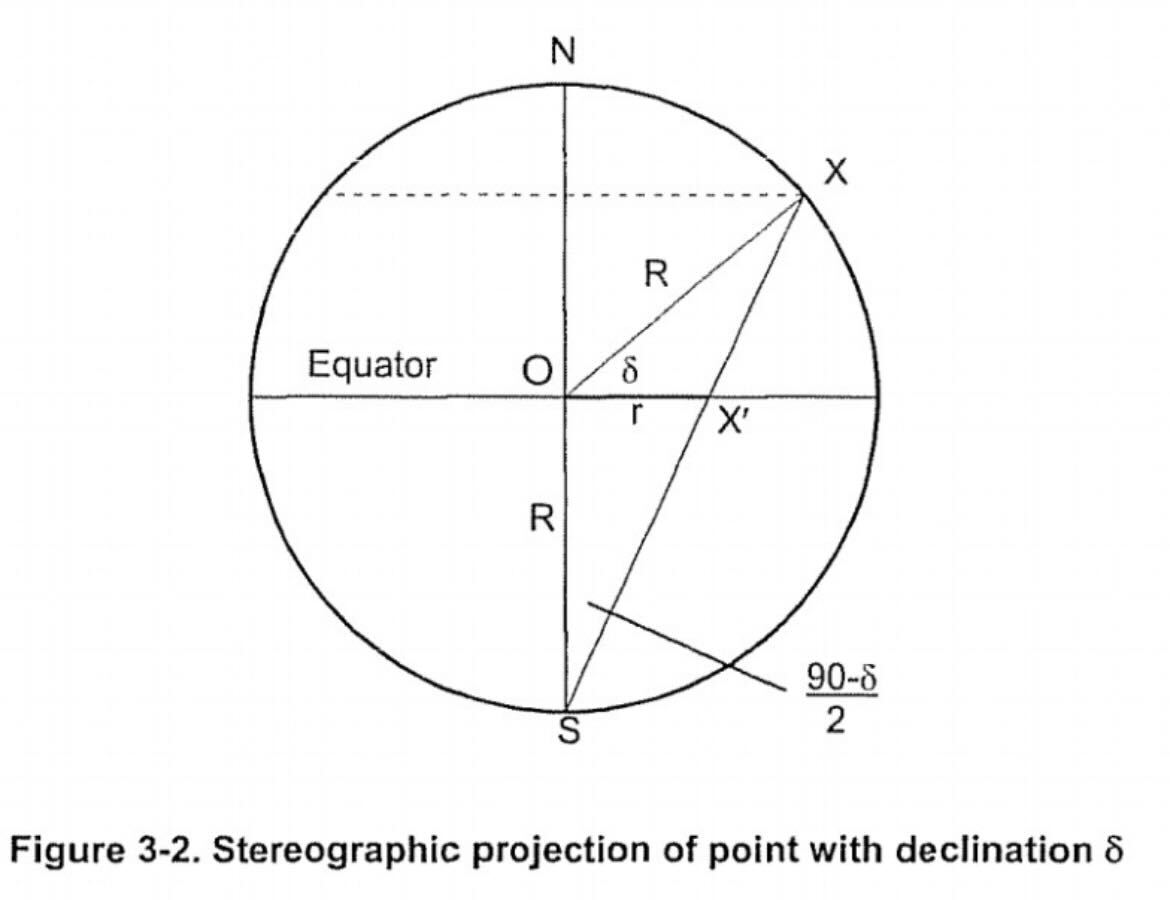
Star Chartパッケージには、組み込みライブラリの一部として、最も明るい星を100以上超える星が付属しています。ただし、NewStarオブジェクトを作成することで、プロットまたは計算のために新しい星を簡単に追加できます。 NewStarオブジェクトには、PlotSterographicProjection()およびFinalPositionOfStars()が追加の引数として受け入れることができるいくつかの重要な機能が必要です。
これにより、2つの方法で新しい星を作成できます。
1。適切な動き速度と適切な動き角度で
PolluxのInsky.orgで見られるように
 star_chart_spherical_projection.newStar(starName=None,
					ra=None,
					dec=None,
					properMotionSpeed=None,
					properMotionAngle=None,
					magnitudeVisual=None)
適切な昇天と偏角に沿って適切な動き速度で
Polluxのwikipeida.ogで見られるように
 star_chart_spherical_projection.newStar(starName=None,
					ra=None,
					dec=None,
					properMotionSpeedRA=None,
					properMotionSpeedDec=None,
					magnitudeVisual=None)
重要な注意:RA/DEC適切な動きは、適切な昇天と偏角に沿った速度から適切な動き速度( properMotionSpeed )と角度( properMotionAngle )に変換されます。
plotsterographicprojection()
ステレオグラフィック極プロットで星をプロットします
 plotStereographicProjection(northOrSouth=None,
			builtInStars=[],
			declination_min=None,
			yearSince2000=0,
			displayStarNamesLabels=True,
			displayDeclinationNumbers=True,
			incrementBy=10,
			isPrecessionIncluded=True,
			maxMagnitudeFilter=None,
			userDefinedStars=[],
			onlyDisplayUserStars=False,
			showPlot=True,
			fig_plot_title=None,
			fig_plot_color="C0",
			figsize_n=12,
			figsize_dpi=100,
			save_plot_name=None)
| Northorsouth = "North"(-30°〜90°)(星のラベルなし) | Northorsouth = "South"(30°〜 -90°)(星のラベルなし) |
|---|---|
| BuiltInStars = [](すべての星を含む、デフォルト) | BuiltinStars = ["vega"、 "arcturus"、 "enif"、 "caph"、 "mimosa"]] |
|---|---|
| debling_min = -30°(デフォルト) | deblination_min = 10° |
|---|---|
| yearsince2000 = 0(デフォルト) | yearsince2000 = -3100 |
|---|---|
| displayStarNamesLabels = true(default) | displayStarNamesLabels = false |
|---|---|
| displaydeclinationnumbers = true(default)(星のラベルなし) | displaydeclinationnumbers = false(星のラベルなし) |
|---|---|
| IncrementBy = 10(デフォルト)(星のラベルなし) | IncrementBy = 5(星のラベルなし) |
|---|---|
| isprecessionincluded = true(default)(yearsince2000 = 11500) | isprecessionincluded = false(yearsince2000 = 11500) |
|---|---|
| maxmagnitudefilter = none(default) | maxmagnitudefilter = 1 |
|---|---|
| userdefinedStars = [](デフォルト)(「vega」だけで) | userdefinedstars = [exalibur_star、karaboudjan_star](QuickStartから「Vega」から) |
|---|---|
| onlydisplayuserstars = false(default)with userdefinedStars | onlydisplayuserstars = true with userdefinedstars = [exalibur_star、karaboudjan_star](QuickStartから) |
|---|---|
| fig_plot_title =(デフォルト) | fig_plot_title = "これはスターチャートのサンプルタイトルです" |
|---|---|
| fig_plot_color = "c0"(デフォルト)(星のラベルなし) | fig_plot_color = "darkorchid"(星のラベルなし) |
|---|---|
finalposition ofstars()
形式の特定の年の星の最終位置の辞書を返します:{'Star name':{"Dedination":Dedination(int)、 "ra":ra(str)}
 finalPositionOfStars(builtInStars=[],
		yearSince2000=0,
		isPrecessionIncluded=True,
		userDefinedStars=[],
		onlyDisplayUserStars=False,
		declination_min=None,
		declination_max=None,
		save_to_csv=None)
starpositionoverime()
時間の経過とともに単一の星の位置を返します
 starPositionOverTime(builtInStarName=None,
			newStar=None,
			startYearSince2000=None,
			endYearSince2000=None,
			incrementYear=5,
			isPrecessionIncluded=True,
			save_to_csv=None)
Vega5年になりますPredictPolestar
2000年以降、特定の年に北/南極の星を返します
predictPoleStar(yearSince2000=0, northOrSouth="North")
North = 90°およびSouth = -90°、デフォルトはNorthにありますplotStarpositionOurtieTime()
時間の経過とともに星の偏角と右昇天の位置をプロットする
 plotStarPositionOverTime(builtInStarName=None,
			newStar=None,
			startYearSince2000=None,
			endYearSince2000=None,
			incrementYear=10,
			isPrecessionIncluded=True,
			DecOrRA="D",
			showPlot=True,
			showYearMarker=True,
			fig_plot_title=None,
			fig_plot_color="C0",
			figsize_n=12,
			figsize_dpi=100,
			save_plot_name=None)
VegaDまたは右の昇天RAをプロットし、デフォルトはDになります10年になります<STAR NAME> <DECLINATION/RA> (<With/Without> Precession) from <START BCE/CE> to <END BCE/CE>, every <YEAR INCREMENT> YearsC0になります12100になります歳差運動を伴う偏り:
 star_chart_spherical_projection . plotStarPositionOverTime ( builtInStarName = "Vega" ,
							newStar = None ,
							startYearSince2000 = - 15000 ,
							endYearSince2000 = 15000 ,
							isPrecessionIncluded = True ,
							incrementYear = 5 ,
							DecOrRA = "D" )
歳差運動のない偏り:
 star_chart_spherical_projection . plotStarPositionOverTime ( builtInStarName = "Vega" ,
							newStar = None ,
							startYearSince2000 = - 15000 ,
							endYearSince2000 = 15000 ,
							isPrecessionIncluded = False ,
							incrementYear = 5 ,
							DecOrRA = "D" )
歳差運動を伴う正しい昇天:
 star_chart_spherical_projection . plotStarPositionOverTime ( builtInStarName = "Vega" ,
							newStar = None ,
							startYearSince2000 = - 15000 ,
							endYearSince2000 = 15000 ,
							isPrecessionIncluded = True ,
							incrementYear = 5 ,
							DecOrRA = "R" )
歳差運動のない正しい昇天:
 star_chart_spherical_projection . plotStarPositionOverTime ( builtInStarName = "Vega" ,
							newStar = None ,
							startYearSince2000 = - 15000 ,
							endYearSince2000 = 15000 ,
							isPrecessionIncluded = False ,
							incrementYear = 5 ,
DecOrRA = "R" )北半球の星図(90°を中心)の歳差運動せずに
 star_chart_spherical_projection.plotStereographicProjection(northOrSouth="North",
							displayStarNamesLabels=False,
							yearSince2000=11500,
							isPrecessionIncluded=False,
							fig_plot_color="red")
 star_chart_spherical_projection.plotStereographicProjection(northOrSouth="North",
							displayStarNamesLabels=True,
							yearSince2000=11500,
							isPrecessionIncluded=False,
							fig_plot_color="red")
北半球の星図(90°を中心)の歳差運動
 star_chart_spherical_projection.plotStereographicProjection(northOrSouth="North",
							displayStarNamesLabels=False,
							yearSince2000=11500,
							isPrecessionIncluded=True,
							fig_plot_color="red")
 star_chart_spherical_projection.plotStereographicProjection(northOrSouth="North",
							displayStarNamesLabels=True,
							yearSince2000=11500,
							isPrecessionIncluded=True,
							fig_plot_color="red")
歳差別なしで南半球の星図(-90°を中心とする)
 star_chart_spherical_projection.plotStereographicProjection(northOrSouth="South",
							displayStarNamesLabels=False,
							yearSince2000=11500,
							isPrecessionIncluded=False,
							fig_plot_color="cornflowerblue")
 star_chart_spherical_projection.plotStereographicProjection(northOrSouth="South",
							displayStarNamesLabels=True,
							yearSince2000=11500,
							isPrecessionIncluded=False,
							fig_plot_color="cornflowerblue")
歳差別のある南半球(-90°を中心とする)の星図
 star_chart_spherical_projection.plotStereographicProjection(northOrSouth="South",
							displayStarNamesLabels=False,
							yearSince2000=11500,
							isPrecessionIncluded=True,
							fig_plot_color="cornflowerblue")
 star_chart_spherical_projection.plotStereographicProjection(northOrSouth="South",
							displayStarNamesLabels=True,
							yearSince2000=11500,
							isPrecessionIncluded=True,
							fig_plot_color="cornflowerblue")
star-chart-spherical-projection Github Repo/Forkに対して実行またはテストするには、開発環境をConda/Minicondaを介して作成できます
まず、Minicondaをインストールします
次に、既存のenvironment.ymlを使用して、新しいコンドラ環境を作成してスクリプトを実行/テストすることができます
conda env create --file environment.yml
環境が構築されたら、環境をアクティブにします。
conda activate star_chart
ルートディレクトリから既存および新しいテストを実行するには:
python -m pytest
星の位置(右昇天と偏角)を備えた「星名のIAUカタログ」によって指定された名前の星と、Inshe-Sky.orgとWikipediaからの適切な動きの角度と速度が示されている場所
歳差運動モデル:Vondrák、J.、et al。 「長時間の間隔で有効な新しい歳差運動表現。」天文学&天体物理学、Vol。 534、2011
Vondrakの長期歳差運動モデルGithub Repo 'Vondrak'からPython 3+に適応した歳差運動コード
githubの問題として、または[email protected]にバグ修正、質問、または機能のリクエストを提出します


