surpriver
1.0.0

在使用異常檢測和機器學習移動之前,先找到高移動的庫存。驚喜使用機器學習來查看音量 +價格動作和推斷出異常的模式,這可能會導致股票的大動作。
| 小路 | 描述 |
|---|---|
| 驚喜 | 主文件夾。 |
| └字典 | 文件夾以保存數據字典以供以後使用。 |
| └數字 | 該GitHub存儲庫的數字。 |
| └股票 | 您要分析的所有股票的列表。 |
| data_loader.py | 從Yahoo Finance加載數據的模塊。 |
| detuction_engine.py | 用於在數據上運行異常檢測並查找具有最不尋常價格和數量模式的庫存的主要模塊。 |
| feature_generator.py | 生成價格和數量回報功能以及大量技術指標。 |
您將需要安裝以下軟件包來訓練和測試模型。
您可以使用以下命令安裝所有軟件包。請注意,該腳本是使用Python3編寫的。
pip install -r requirements.txt
如果您知道它是什麼,並且對如何使用它有一些知識,也可以使用Docker。這是使用Docker運行工具的步驟。
docker build . -t surpriver<C:\path\to\this\dir>用您正在使用的目錄。docker-compose up -d來運行容器docker exec -it surpriver 。如果您想繼續前進並直接獲得最異常的庫存,則可以簡單地運行以下命令,以獲取具有最不尋常的模式的股票。我們將在以下各節中深入研究命令。
python detection_engine.py --top_n 25 --min_volume 5000 --data_granularity_minutes 60 --history_to_use 14 --is_load_from_dictionary 0 --data_dictionary_path 'dictionaries/data_dict.npy' --is_save_dictionary 1 --is_test 0 --future_bars 0
該命令將為您提供前25個股票,在60分鐘蠟燭的最後14個酒吧中的異常得分最高。它還將存儲用來在字典/data_dict.npy文件夾中存儲用於對預測進行預測的所有數據。以下是每個參數的更詳細說明。
python detection_engine.py --top_n 25 --min_volume 5000 --data_granularity_minutes 60 --history_to_use 14 --is_load_from_dictionary 1 --data_dictionary_path 'dictionaries/data_dict.npy' --is_save_dictionary 0 --is_test 0 --future_bars 0 --output_format 'CLI'
請注意IS_SAVE_DICTIONARY和IS_LOAD_FROM_DICTIONARY的更改。
這是單個預測的外觀的輸出。請注意,負分數表明較高的異常和異常模式,而正分數表示正常的模式。越低越好。
 Last Bar Time: 2020-08-25 11:30:00-04:00
Symbol: SPI
Anomaly Score: -0.029
Today Volume (Today = Date Above): 313.94K
Average Volume 5d: 206.53K
Average Volume 20d: 334.14K
Volatility 5bars: 0.013
Volatility 20bars: 0.038
Future Absolute Sum Price Changes: 72.87
如果您懷疑在交易中使用機器學習和人工智能,則實際上可以在此工具上測試有關歷史數據的預測。測試的兩個最重要的命令行參數是is_test和future_bars 。如果將前一個設置為1,而後者則將其設置為超過5的任何內容,則該工具實際上將留下大量數據以進行分析目的,並在此之前使用數據進行異常預測。接下來,它將查看其餘數據,以了解預測的表現。這是以下命令中散點圖的示例。
python detection_engine.py --top_n 25 --min_volume 5000 --data_granularity_minutes 60 --history_to_use 14 --is_load_from_dictionary 0 --data_dictionary_path 'dictionaries/data_dict.npy' --is_save_dictionary 1 --is_test 1 --future_bars 25
如果您已經生成了數據字典,則可以使用以下命令將我們設置為is_load_from_dictionary為1,而is_save_dictionary將其設置為0。
python detection_engine.py --top_n 25 --min_volume 5000 --data_granularity_minutes 60 --history_to_use 14 --is_load_from_dictionary 1 --data_dictionary_path 'dictionaries/data_dict.npy' --is_save_dictionary 0 --is_test 1 --future_bars 25
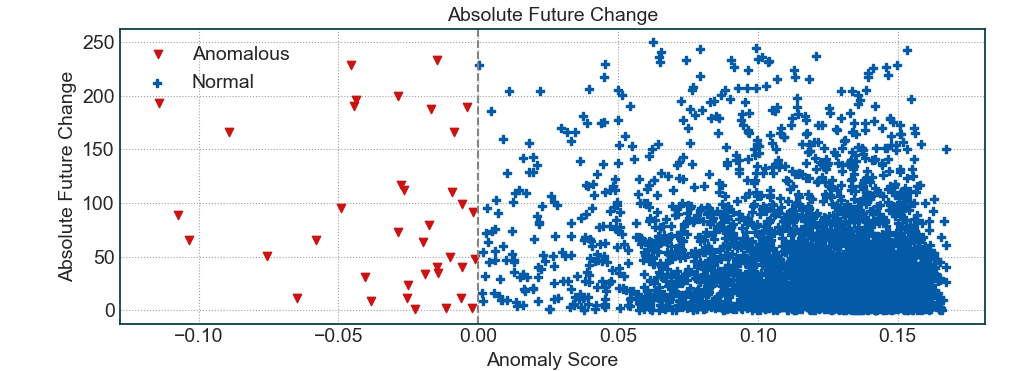
如上圖所示,異常的股票(得分<0)通常平均具有更高的絕對變化。這證明了這些預測實際上是針對那些在接下來幾個小時/天內移動超過平均水平的股票。這裡出現了一個問題,如果該工具只是選擇最高的波動率庫存怎麼辦,因為這些庫存將產生很高的絕對變化。為了證明情況並非如此,這是您從上面命令獲得的統計數據的更詳細的描述。
 --> Future Performance
Correlation between future absolute change vs anomalous score (lower is better, range = (-1, 1)): **-0.23**
Total absolute change in future for Anomalous Stocks: **89.660**
Total absolute change in future for Normal Stocks: **43.000**
Average future volatility of Anomalous Stocks: **0.332**
Average future volatility of Normal Stocks: **0.585**
Historical volatility for Anomalous Stocks: **2.528**
Historical volatility for Normal Stocks: **2.076**
您會看到普通與異常股票的歷史波動率沒有什麼不同。但是,與普通股相比,異常股票的絕對未來總變化的差異是兩倍。
現在,您可以指定要使用哪些數據源以及要使用的庫存列表。
python detection_engine.py --top_n 25 --min_volume 500 --data_granularity_minutes 60 --history_to_use 14 --is_load_from_dictionary 0 --data_dictionary_path 'dictionaries/feature_dict.npy' --is_save_dictionary 1 --is_test 0 --future_bars 0 --data_source binance --stock_list cryptos.txt
我們將嘗試每週發布一組參數的前25個結果。
該工具只能發現其價格和數量動作的總和。它無法預測股票將移動哪個方向。這可能是我將來實現的功能,但是現在,您需要查看圖表並執行DD來弄清楚這一點。
傳統的產品
版權(c)2020-resent,tradytics.com


