surpriver
1.0.0

在使用异常检测和机器学习移动之前,先找到高移动的库存。惊喜使用机器学习来查看音量 +价格动作和推断出异常的模式,这可能会导致股票的大动作。
| 小路 | 描述 |
|---|---|
| 惊喜 | 主文件夹。 |
| └字典 | 文件夹以保存数据字典以供以后使用。 |
| └数字 | 该GitHub存储库的数字。 |
| └股票 | 您要分析的所有股票的列表。 |
| data_loader.py | 从Yahoo Finance加载数据的模块。 |
| detuction_engine.py | 用于在数据上运行异常检测并查找具有最不寻常价格和数量模式的库存的主要模块。 |
| feature_generator.py | 生成价格和数量回报功能以及大量技术指标。 |
您将需要安装以下软件包来训练和测试模型。
您可以使用以下命令安装所有软件包。请注意,该脚本是使用Python3编写的。
pip install -r requirements.txt
如果您知道它是什么,并且对如何使用它有一些知识,也可以使用Docker。这是使用Docker运行工具的步骤。
docker build . -t surpriver<C:\path\to\this\dir>用您正在使用的目录。docker-compose up -d来运行容器docker exec -it surpriver 。如果您想继续前进并直接获得最异常的库存,则可以简单地运行以下命令,以获取具有最不寻常的模式的股票。我们将在以下各节中深入研究命令。
python detection_engine.py --top_n 25 --min_volume 5000 --data_granularity_minutes 60 --history_to_use 14 --is_load_from_dictionary 0 --data_dictionary_path 'dictionaries/data_dict.npy' --is_save_dictionary 1 --is_test 0 --future_bars 0
该命令将为您提供前25个股票,在60分钟蜡烛的最后14个酒吧中的异常得分最高。它还将存储用来在字典/data_dict.npy文件夹中存储用于对预测进行预测的所有数据。以下是每个参数的更详细说明。
python detection_engine.py --top_n 25 --min_volume 5000 --data_granularity_minutes 60 --history_to_use 14 --is_load_from_dictionary 1 --data_dictionary_path 'dictionaries/data_dict.npy' --is_save_dictionary 0 --is_test 0 --future_bars 0 --output_format 'CLI'
请注意IS_SAVE_DICTIONARY和IS_LOAD_FROM_DICTIONARY的更改。
这是单个预测的外观的输出。请注意,负分数表明较高的异常和异常模式,而正分数表示正常的模式。越低越好。
 Last Bar Time: 2020-08-25 11:30:00-04:00
Symbol: SPI
Anomaly Score: -0.029
Today Volume (Today = Date Above): 313.94K
Average Volume 5d: 206.53K
Average Volume 20d: 334.14K
Volatility 5bars: 0.013
Volatility 20bars: 0.038
Future Absolute Sum Price Changes: 72.87
如果您怀疑在交易中使用机器学习和人工智能,则实际上可以在此工具上测试有关历史数据的预测。测试的两个最重要的命令行参数是is_test和future_bars 。如果将前一个设置为1,而后者则将其设置为超过5的任何内容,则该工具实际上将留下大量数据以进行分析目的,并在此之前使用数据进行异常预测。接下来,它将查看其余数据,以了解预测的表现。这是以下命令中散点图的示例。
python detection_engine.py --top_n 25 --min_volume 5000 --data_granularity_minutes 60 --history_to_use 14 --is_load_from_dictionary 0 --data_dictionary_path 'dictionaries/data_dict.npy' --is_save_dictionary 1 --is_test 1 --future_bars 25
如果您已经生成了数据字典,则可以使用以下命令将我们设置为is_load_from_dictionary为1,而is_save_dictionary将其设置为0。
python detection_engine.py --top_n 25 --min_volume 5000 --data_granularity_minutes 60 --history_to_use 14 --is_load_from_dictionary 1 --data_dictionary_path 'dictionaries/data_dict.npy' --is_save_dictionary 0 --is_test 1 --future_bars 25
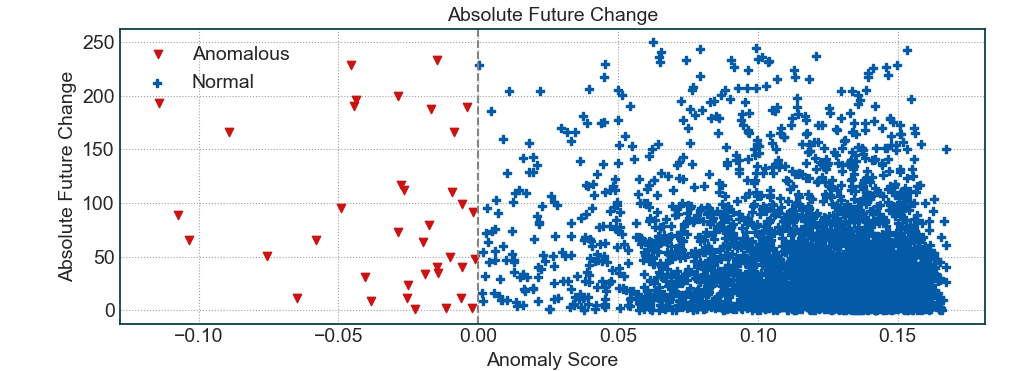
如上图所示,异常的股票(得分<0)通常平均具有更高的绝对变化。这证明了这些预测实际上是针对那些在接下来几个小时/天内移动超过平均水平的股票。这里出现了一个问题,如果该工具只是选择最高的波动率库存怎么办,因为这些库存将产生很高的绝对变化。为了证明情况并非如此,这是您从上面命令获得的统计数据的更详细的描述。
 --> Future Performance
Correlation between future absolute change vs anomalous score (lower is better, range = (-1, 1)): **-0.23**
Total absolute change in future for Anomalous Stocks: **89.660**
Total absolute change in future for Normal Stocks: **43.000**
Average future volatility of Anomalous Stocks: **0.332**
Average future volatility of Normal Stocks: **0.585**
Historical volatility for Anomalous Stocks: **2.528**
Historical volatility for Normal Stocks: **2.076**
您会看到普通与异常股票的历史波动率没有什么不同。但是,与普通股相比,异常股票的绝对未来总变化的差异是两倍。
现在,您可以指定要使用哪些数据源以及要使用的库存列表。
python detection_engine.py --top_n 25 --min_volume 500 --data_granularity_minutes 60 --history_to_use 14 --is_load_from_dictionary 0 --data_dictionary_path 'dictionaries/feature_dict.npy' --is_save_dictionary 1 --is_test 0 --future_bars 0 --data_source binance --stock_list cryptos.txt
我们将尝试每周发布一组参数的前25个结果。
该工具只能发现其价格和数量动作的总和。它无法预测股票将移动哪个方向。这可能是我将来实现的功能,但是现在,您需要查看图表并执行DD来弄清楚这一点。
传统的产品
版权(c)2020-resent,tradytics.com


