torchview
- TorchView 0.2.6
Torchview는 시각적 그래프 형태로 Pytorch 모델의 시각화를 제공합니다. 시각화에는 텐서, 모듈, 토치 및 입력/출력 모양과 같은 정보가 포함됩니다.
plot_model of keras 의 Pytorch 버전 (및 기타)
Pytorch 버전을 지원합니다

먼저 GraphViz를 설치해야합니다.
pip install graphvizGraphiz의 Python 인터페이스가 작동하려면 시스템에서 DOT 레이아웃 명령이 작동해야합니다. 아직 설치되지 않은 경우 OS에서 다음 층을 실행하는 것이 좋습니다.
데비안 기반 리눅스 배포판 (예 : 우분투) :
apt-get install graphvizWindows :
choco install graphviz마코스
brew install graphviz자세한 내용은 여기를 참조하십시오
그런 다음 PIP를 사용하여 Torchview 설치를 계속하십시오
pip install torchview또는 Conda를 통해 원한다면
conda install -c conda-forge torchview또는 대부분의 최신 버전을 원하는 경우 Repo에서 직접 설치하십시오.
pip install git+https://github.com/mert-kurttutan/torchview.git from torchview import draw_graph
model = MLP ()
batch_size = 2
# device='meta' -> no memory is consumed for visualization
model_graph = draw_graph ( model , input_size = ( batch_size , 128 ), device = 'meta' )
model_graph . visual_graph 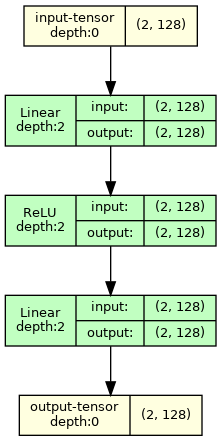
더 많은 예는 아래 Colab 노트북을 참조하십시오.
소개 노트북 :
컴퓨터 비전 모델 :
NLP 모델 :
참고 : 출력 GraphViz Visuals 원하는 크기의 이미지를 반환합니다. 그러나 때로는 VSCODE에서는 VSCODE에 의해 큰 크기와 SVG 렌더링으로 인해 일부 모양이 잘립니다. 이것을 해결하기 위해 다음을 실행하는 것이 좋습니다
 import graphviz
graphviz . set_jupyter_format ( 'png' )
이 문제는 Jupyterlab 또는 Google Colab의 다른 플랫폼에서는 발생하지 않습니다.
 def draw_graph (
    model : nn . Module ,
    input_data : INPUT_DATA_TYPE | None = None ,
    input_size : INPUT_SIZE_TYPE | None = None ,
    graph_name : str = 'model' ,
    depth : int | float = 3 ,
    device : torch . device | str | None = None ,
    dtypes : list [ torch . dtype ] | None = None ,
    mode : str | None = None ,
    strict : bool = True ,
    expand_nested : bool = False ,
    graph_dir : str | None = None ,
    hide_module_functions : bool = True ,
    hide_inner_tensors : bool = True ,
    roll : bool = False ,
    show_shapes : bool = True ,
    save_graph : bool = False ,
    filename : str | None = None ,
    directory : str = '.' ,
    ** kwargs : Any ,
) -> ComputationGraph :
    '''Returns visual representation of the input Pytorch Module with
    ComputationGraph object. ComputationGraph object contains:

    1) Root nodes (usually tensor node for input tensors) which connect to all
    the other nodes of computation graph of pytorch module recorded during forward
    propagation.

    2) graphviz.Digraph object that contains visual representation of computation
    graph of pytorch module. This graph visual shows modules/ module hierarchy,
    torch_functions, shapes and tensors recorded during forward prop, for examples
    see documentation, and colab notebooks.


    Args:
        model (nn.Module):
            Pytorch model to represent visually.

        input_data (data structure containing torch.Tensor):
            input for forward method of model. Wrap it in a list for
            multiple args or in a dict or kwargs

        input_size (Sequence of Sizes):
            Shape of input data as a List/Tuple/torch.Size
            (dtypes must match model input, default is FloatTensors).
            Default: None

        graph_name (str):
            Name for graphviz.Digraph object. Also default name graphviz file
            of Graph Visualization
            Default: 'model'

        depth (int):
            Upper limit for depth of nodes to be shown in visualization.
            Depth is measured how far is module/tensor inside the module hierarchy.
            For instance, main module has depth=0, whereas submodule of main module
            has depth=1, and so on.
            Default: 3

        device (str or torch.device):
            Device to place and input tensors. Defaults to
            gpu if cuda is seen by pytorch, otherwise to cpu.
            Default: None

        dtypes (list of torch.dtype):
            Uses dtypes to set the types of input tensor if
            input size is given.

        mode (str):
            Mode of model to use for forward prop. Defaults
            to Eval mode if not given
            Default: None

        strict (bool):
            if true, graphviz visual does not allow multiple edges
            between nodes. Mutiple edge occurs e.g. when there are tensors
            from module node to module node and hiding those tensors
            Default: True

        expand_nested(bool):
            if true shows nested modules with dashed borders

        graph_dir (str):
            Sets the direction of visual graph
            'TB' -> Top to Bottom
            'LR' -> Left to Right
            'BT' -> Bottom to Top
            'RL' -> Right to Left
            Default: None -> TB

        hide_module_function (bool):
            Determines whether to hide module torch_functions. Some
            modules consist only of torch_functions (no submodule),
            e.g. nn.Conv2d.
            True => Dont include module functions in graphviz
            False => Include modules function in graphviz
            Default: True

        hide_inner_tensors (bool):
            Inner tensor is all the tensors of computation graph
            but input and output tensors
            True => Does not show inner tensors in graphviz
            False => Shows inner tensors in graphviz
            Default: True

        roll (bool):
            If true, rolls recursive modules.
            Default: False

        show_shapes (bool):
            True => Show shape of tensor, input, and output
            False => Dont show
            Default: True

        save_graph (bool):
            True => Saves output file of graphviz graph
            False => Does not save
            Default: False

        filename (str):
            name of the file to store dot syntax representation and
            image file of graphviz graph. Defaults to graph_name

        directory (str):
            directory in which to store graphviz output files.
            Default: .

    Returns:
        ComputationGraph object that contains visualization of the input
        pytorch model in the form of graphviz Digraph object
''' from torchview import draw_graph
model_graph = draw_graph (
SimpleRNN (), input_size = ( 2 , 3 ),
graph_name = 'RecursiveNet' ,
roll = True
)
model_graph . visual_graph 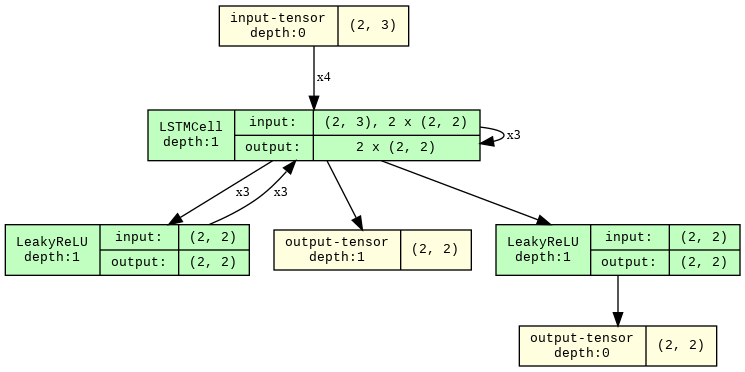
 # Show inner tensors and Functionals
model_graph = draw_graph (
    MLP (), input_size = ( 2 , 128 ),
    graph_name = 'MLP' ,
    hide_inner_tensors = False ,
    hide_module_functions = False ,
)

model_graph . visual_graph 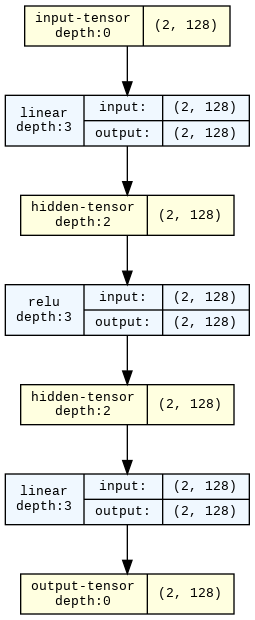
 import torchvision

model_graph = draw_graph ( resnet18 (), input_size = ( 1 , 3 , 32 , 32 ), expand_nested = True )
model_graph . visual_graph 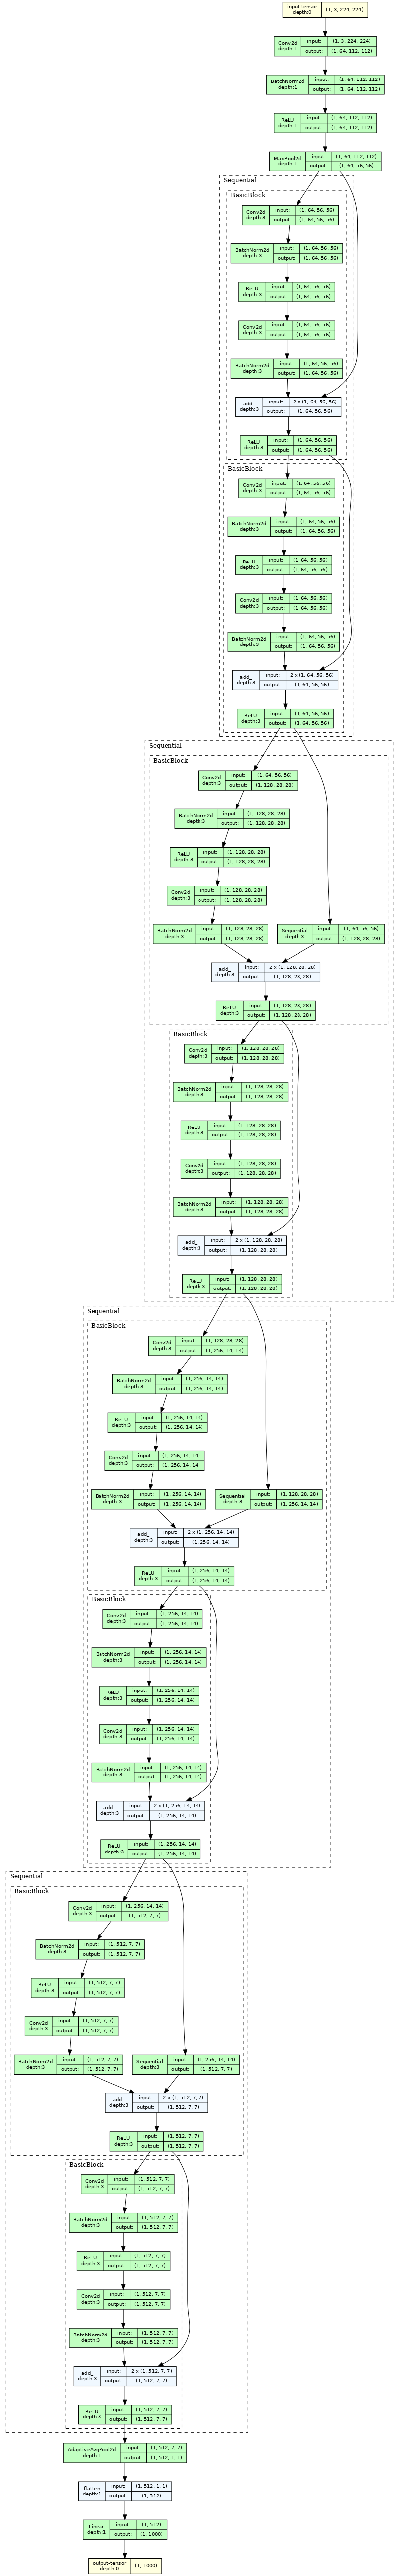
모든 문제와 풀 요청은 대단히 감사합니다! 프로젝트 구축 방법이 궁금하다면 :
pip install -r requirements-dev.txt 실행합니다. 우리는 모든 개발 패키지의 최신 버전을 사용합니다.pytest 실행하십시오.pytest --overwrite 실행하십시오.pytest --no-output 사용하십시오 __torch_function__ 및 서브 클래스 torch.Tensor 덕분입니다. 이 API를 개발 한 모든 분들께 감사드립니다 !!. 여기서 토치 기반 함수는 토치 기능과 모듈 만 사용하는 기능을 말합니다. 이것은 모듈보다 일반적입니다. ↩


