bin graph
1.0.0
이 프로그램은 이진 파일의 다른 영역을 시각화하는 간단한 방법을 제공합니다.
이것들은이 프로젝트에 영감을주는 몇 가지 참고 자료입니다.
보다 전문적인 접근 방식에 관심이 있으시면 다음 링크를 확인하십시오.
이 프로그램은 이미지를 내보내기위한 libpng 에 의존합니다. 패키지 관리자에서 설치하십시오.
 # Arch-based distros
pacman -S libpng

# Gentoo
emerge media-libs/libpng
모든 종속성이 설치되면 프로그램을 컴파일하십시오.
git clone https://github.com/8dcc/bin-graph
cd bin-graph
make
시스템에 설치하려면 다음 명령을 실행하십시오.
sudo make install 입력 바이너리가 출력 이미지에 어떻게 표시되는지를 결정하는 다양한 그래프 모드가 있습니다. 설명이 포함 된 전체 모드 목록은 프로그램의 help 명령으로 찾을 수 있습니다.
bin-graph --help
# Usage:
#   ./bin-graph [OPTION...] INPUT OUTPUT.png
#
# ...
이 프로젝트에는 Bin-Graph-Section.sh 스크립트도 포함되어 있습니다. readelf 와 grep 사용하여 지정된 영역의 오프셋과 크기를 찾아 bin-graph 에 대한 --offset-* 인수로 사용합니다. 섹션 이름의 추가 옵션은 bin-graph 로 전달됩니다.
./bin-graph-section.sh SECTION [OPTION...] INPUT OUTPUT.png
# ...나는 프로그램의 각 부분을 가능한 한 모듈 식적이고 독립적으로 만들려고 노력했습니다.
이것은 이진에서 이미지를 생성하는 기본 프로세스입니다.
read_file 함수를 사용하여 바이트 배열로 읽습니다.Image 구조로 변환되며, 이는 크기와 함께 RGB Color 구조의 배열 일뿐입니다. 프로그램 모드 ( --mode 매개 변수로 덮어 쓸 수 있음)는 사용되는 image_* 함수를 결정합니다. 이 image_* 함수는 image.c에 정의되어 있습니다. 사용 가능한 모드에 대한 자세한 내용은 사용법 및 모드를 참조하십시오.Image 구조는 image.c에 정의 된 image2png 함수가있는 PNG 파일로 변환됩니다../bin-graph --mode grayscale bin-graph examples/grayscale.png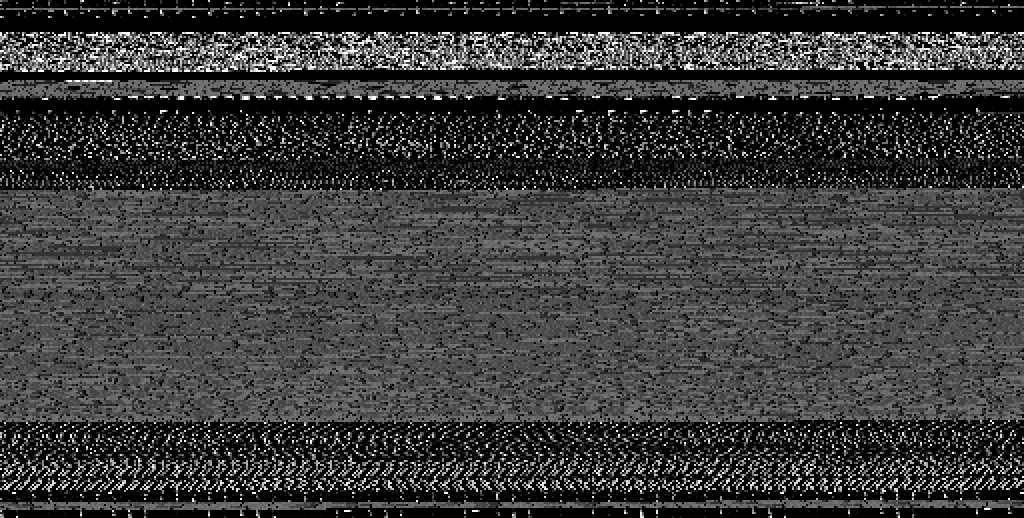
./bin-graph --mode ascii bin-graph examples/ascii.png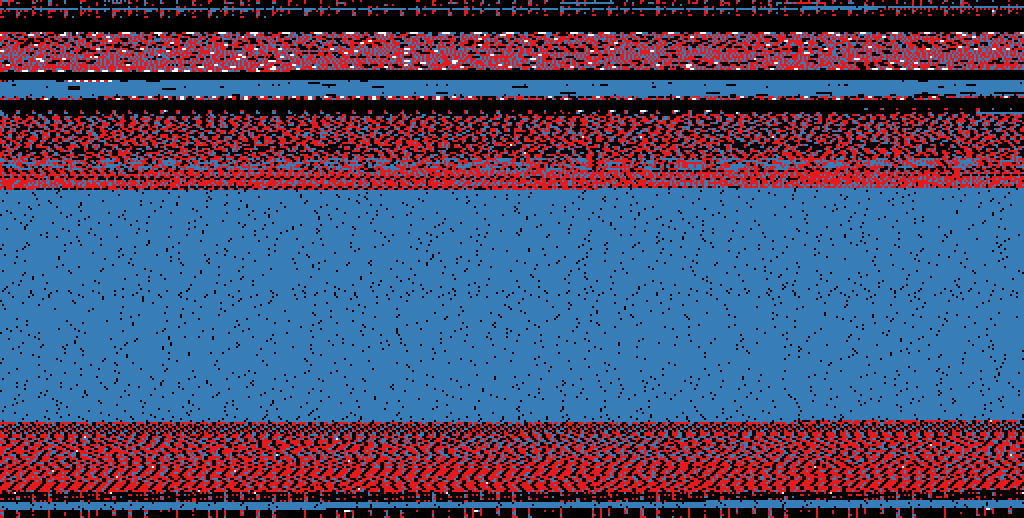
./bin-graph --mode entropy --transform-squares 16 bin-graph examples/entropy-squared.png
 # Only the .text section of the ELF file
./bin-graph-section.sh .text --mode histogram bin-graph examples/histogram.png
 # Only the .rodata section of the ELF file
./bin-graph-section.sh .rodata --mode bigrams bin-graph examples/rodata-bigrams.png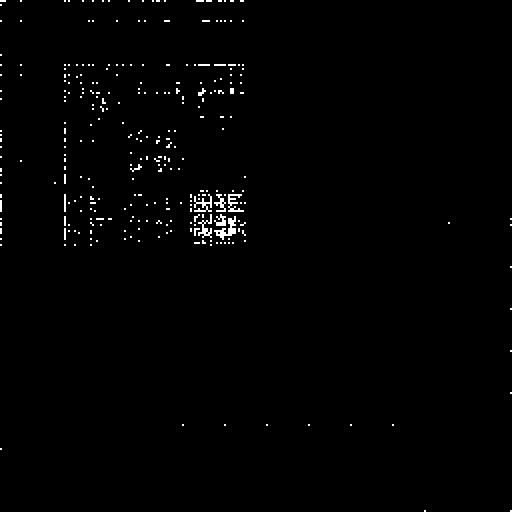
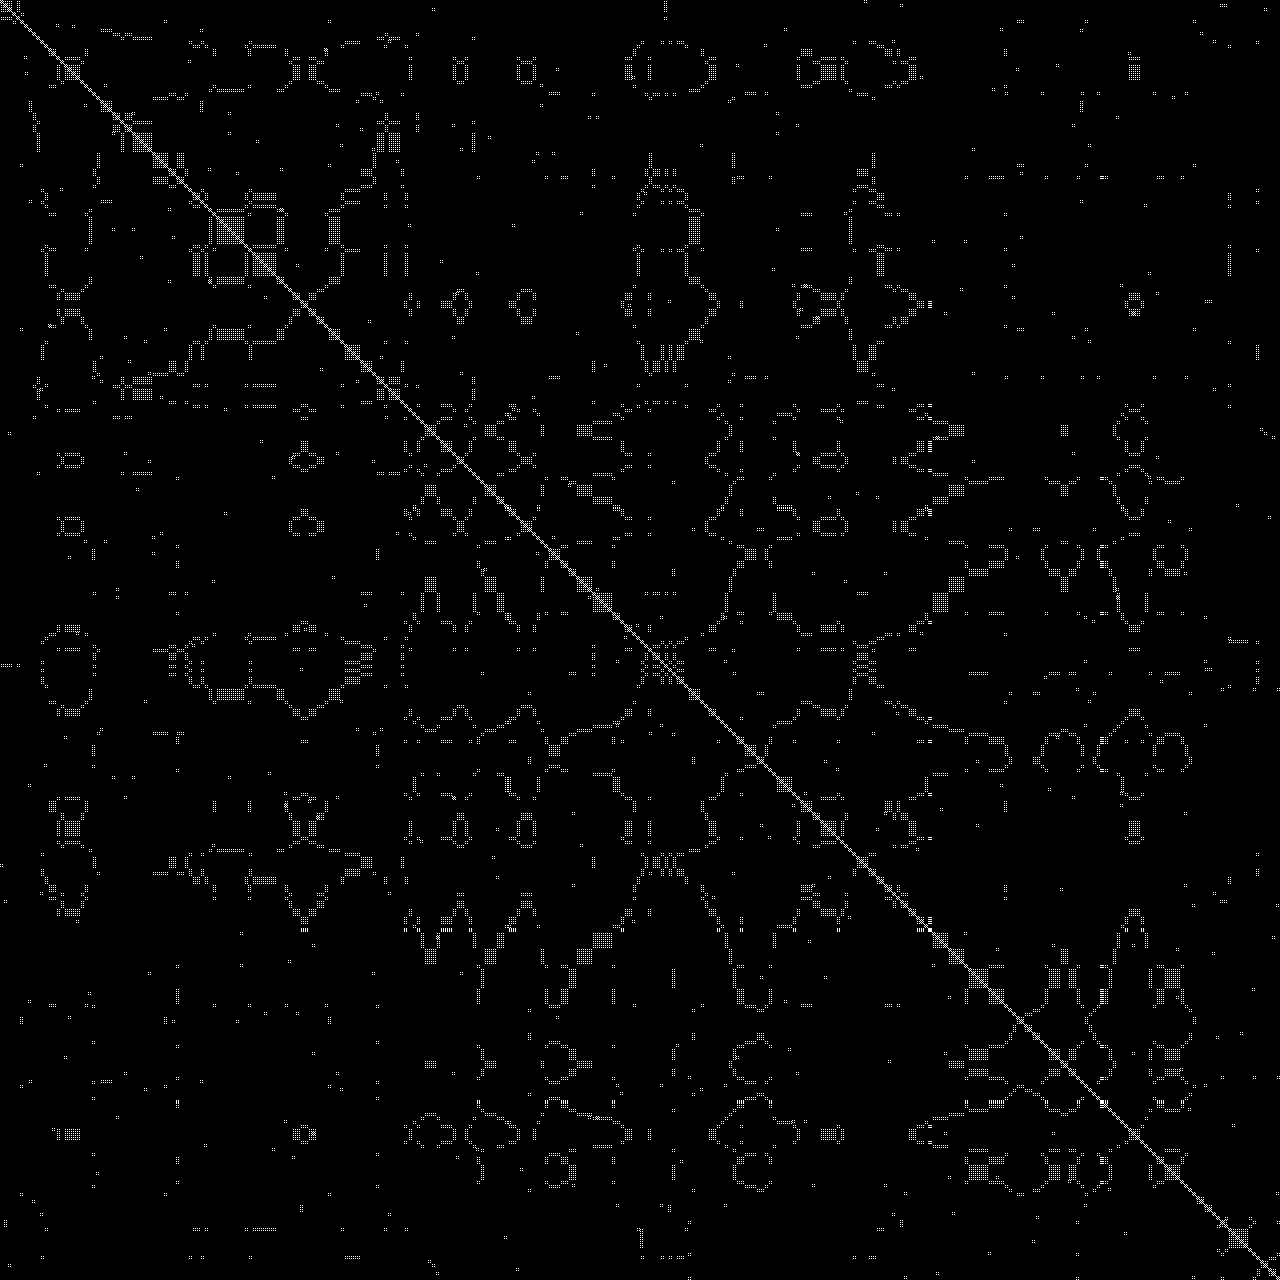
./bin-graph --mode dotplot --zoom 1 --offset-start 5000 --offset-end 5500 input.wav examples/dotplot.png