Olist business analysis
1.0.0
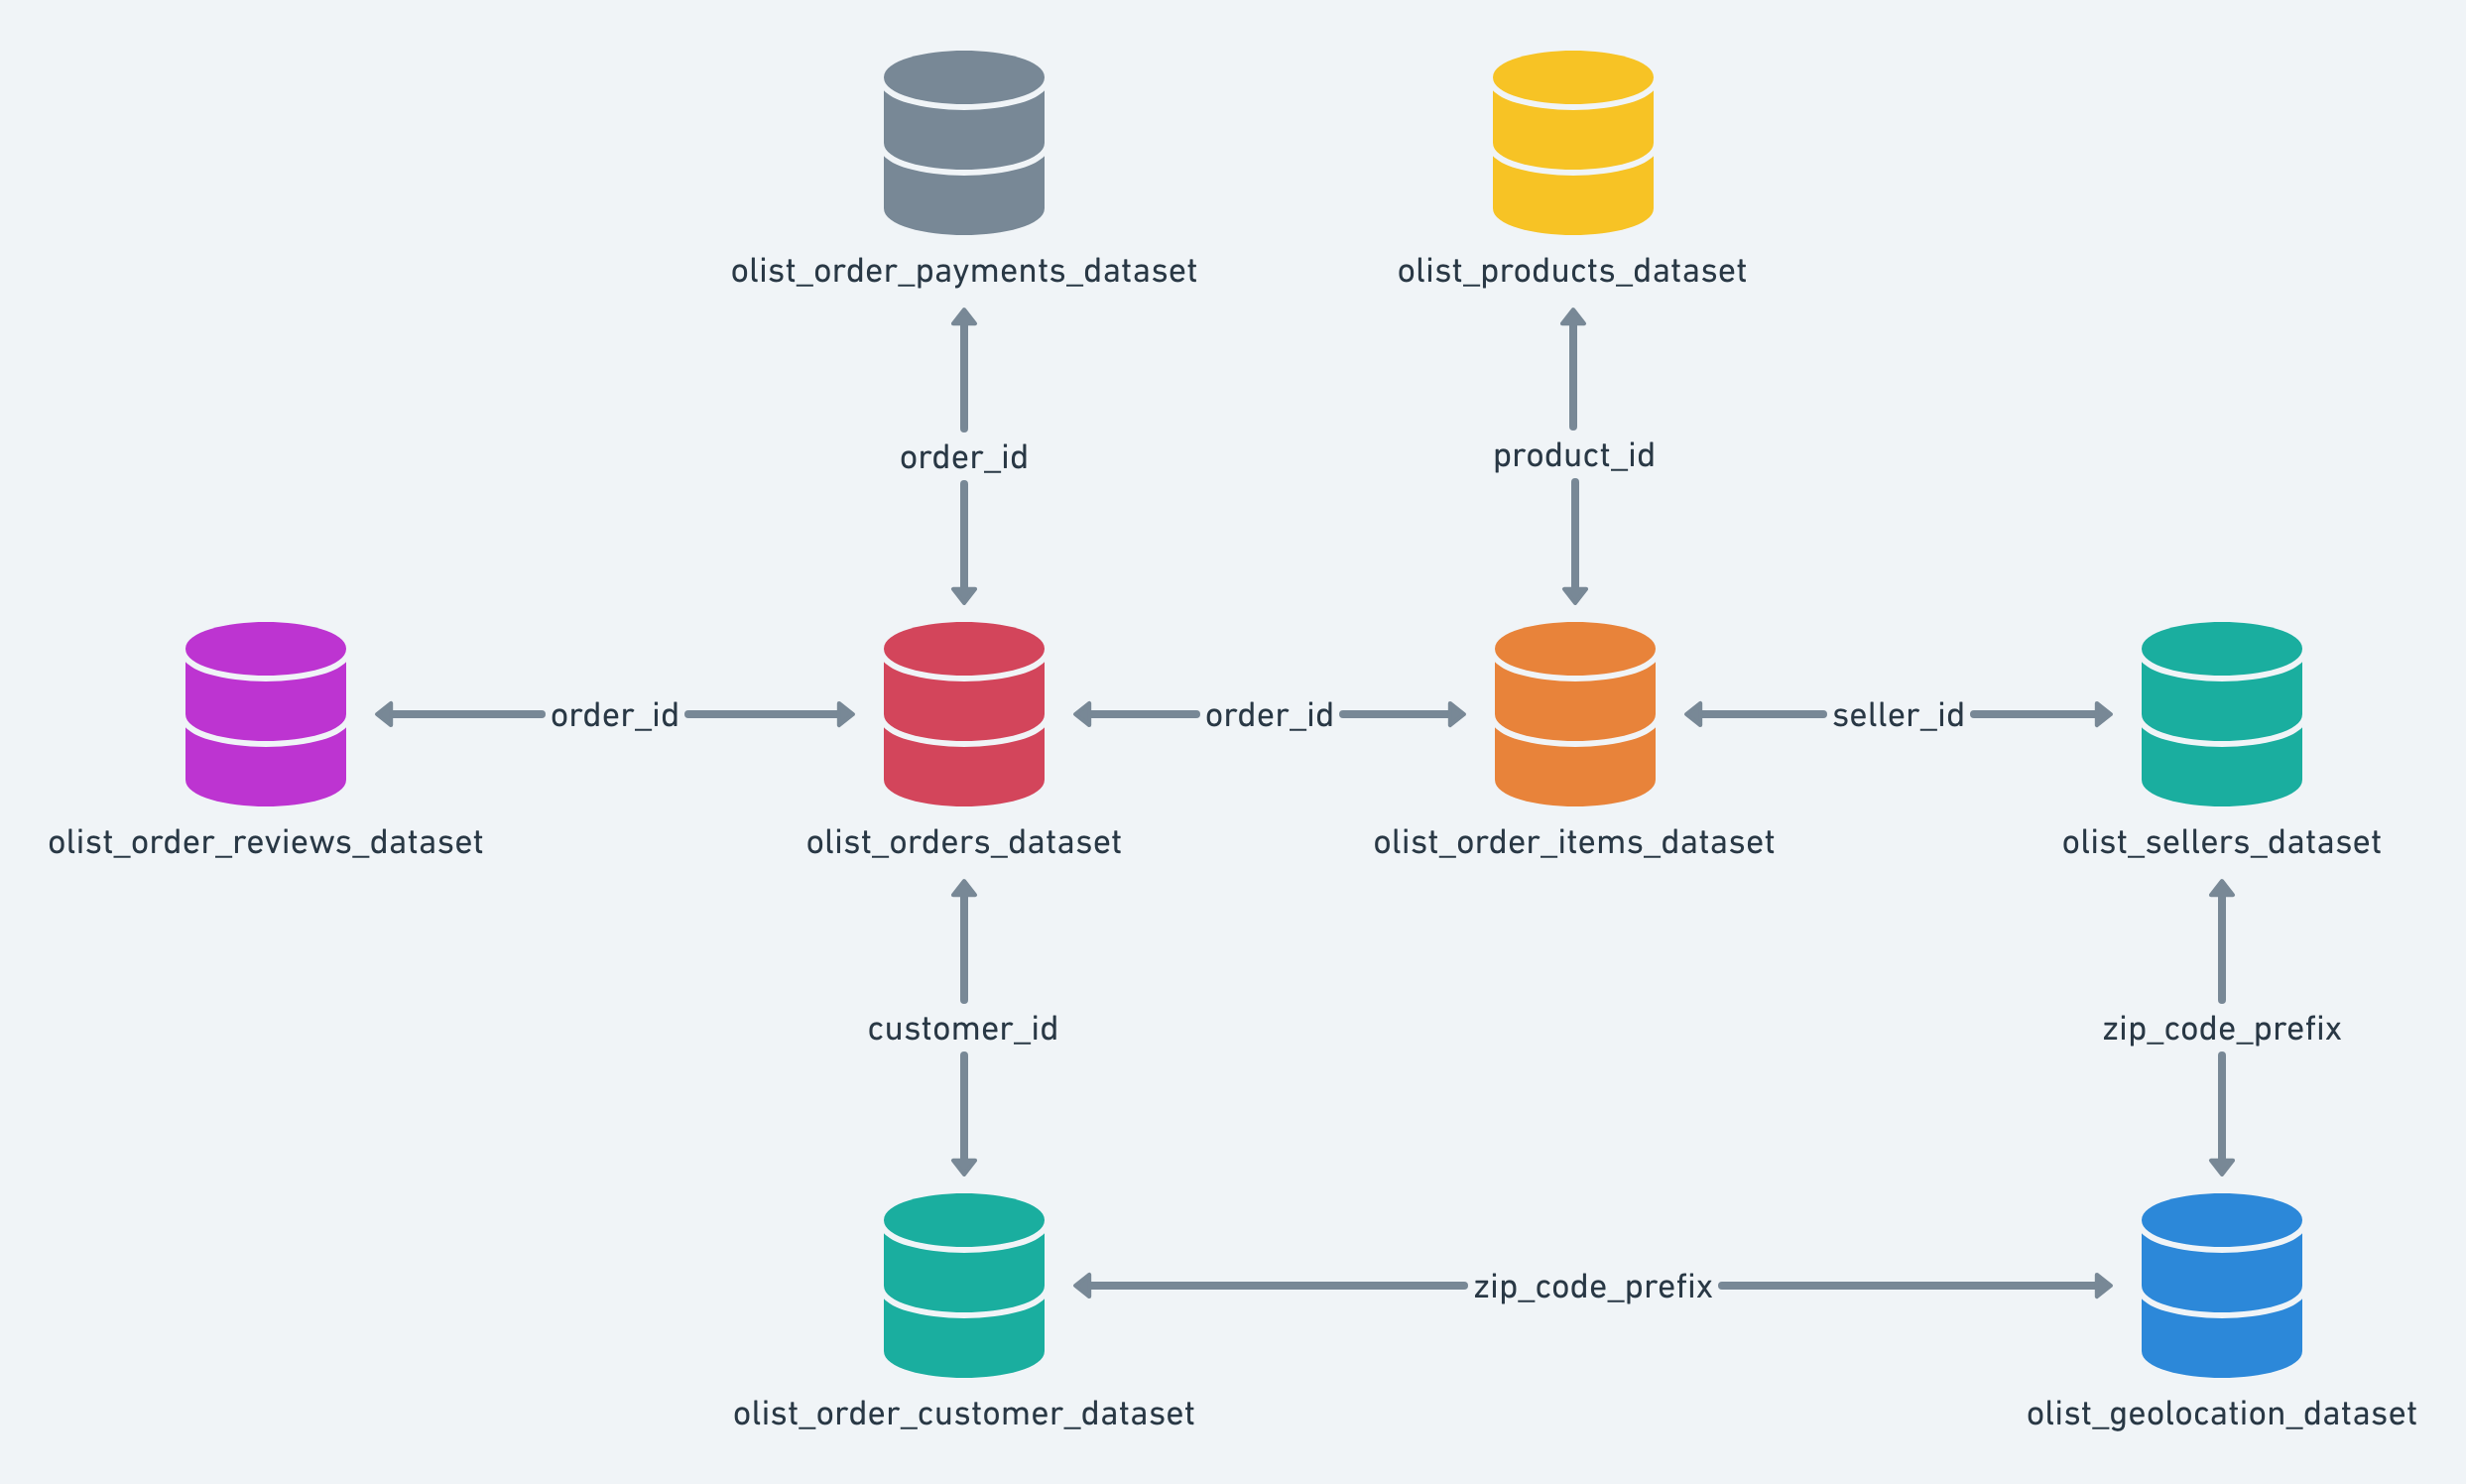
Olist is a Brazilian startup that operates in the e-commerce segment , mainly through the marketplace. It is well spread within the country. This project is a detailed analysis on the comprehensive Olist data. The original Olist dataset has information of 100k orders from 2016 to 2018 made at multiple marketplaces in Brazil. Its features allows viewing an order from multiple dimensions: from order status, price, payment and freight performance to customer location, product attributes and finally reviews written by customers. The schema of the dataset is as below:-
Multiple analysis tasks are carried out on the dataset, ranging from descriptive analysis to forecasting and predictive analysis.
The various analysis tasks are listed and explained below:-
The original data is used to derive multiple datasets by joins and manipulations. The Data manipulation and combinig jupyter notebook contains the step by step process and explanations.
The notebook Preliminary Data analysis contains the detailed analysis. This notebook visualizes and summarizes the original and the combined datasets, to find trends, patterns or faults. This analysis gives a holistic view of th dataset.
Using the transactional dataset created from the original dataset, association rule mining is performed using Frequent pattern algorithms - FP growth trees. The model returns frequent item sets with a confidence threshold of 10%. The Association rule mining notebook contains the detailed explanation for this task.
The objective of this analysis is to find the most popular products, popular product categories and category wise popular products in the Olist ecosystem. Further, the delivery times and product characteristics such as - description lenght, number of photos etc, are compared to popularity to find correlations in the data. The Product analysis notebook contains the detailed code.
Sentiment analysis is carried out on the reviews offered by customers. The notebook contains Supervised and Unsupervised methods for sentiment analysis, Reviews Sentiment Analysis. The supervised technique uses the rating provided as label for sentiment analysis, whereas the unsupervised technique lexicons- AFINN, TextBlob to perform the analysis.
The freight value is the shipping value associated with each order. The Freight value prediction notebook contains detailed model building steps to predict the shipping value for an order, given the distance between seller and customer, the dimensions and weight of the product. Further, the model is also build and deployed on AzureML as a web service. A webapp is created using Dash plotly, to query the model for freight value predictions.
The web application is deployed on Heroku, built in Dash plotly. The application provides a front end to the freight value predictor model built on the AzureML platform. The web application has the following file structure.
__ app.py
__ layout.py
__ requirements.txt
__ Procfile
__ Resources
  |__ API_key
  |__ URL
  |__ ship.png
The schema below is of the web service built on AzureML.
The app.py file contains the server instance and the layout.py file contains the layout to be rendered. The requirements.txt file contains the dependencies of the web application
pip freeze > requirements.txt
The Procfile is used to launch an instance of the app server onto the virtual machine. The contents of the Procfile are
web: gunicorn app:server
Once the files are ready, push the repo to Heroku master
heroku create new_app
git add .
git commit -m "intial push"
git push heroku master
heroku ps:scale web=1
The web application, deployed can be accessed on Heroku via this link. https://olist-freight-app.herokuapp.com/
NOTE:- The Web service on Azure is not currently, up and running. Kindly create a similar web service on Azure and change the API_key and URL files accordingly.
The Olist dataset was analyzed on multiple fronts. Each analysis revealed new information and insights as reported in the notebook. For any queries, contact - [email protected] and [email protected]


