BlazorComponents
1.0.0
Note: Just as Blazor, this repo is also experimental.
如果您喜歡此存儲庫的想法,請將您的反饋作為問題或售罄的回購或在@ma_khan上告訴我
目前,從簡單的ChartJS實現開始。
不知道什麼是什麼?在這裡閱讀
完成所有大火依賴性。
安裝
Install-Package BlazorComponents
或者
dotnet add package BlazorComponents
 < div class =" row " >
    < button class =" btn btn-primary " onclick =" @UpdateChart " > Update Chart </ button >
</ div >
< ChartJsBarChart ref =" barChartJs " Chart =" @blazorBarChartJS " Width =" 600 " Height =" 300 " />
@functions {
public ChartJSBarChart blazorBarChartJS { get ; set ; } = new ChartJSBarChart ( ) ;
ChartJsBarChart barChartJs ;
protected override void OnInit ( )
{
blazorBarChartJS = new ChartJSBarChart ( )
{
ChartType = "bar" ,
CanvasId = "myFirstBarChart" ,
Options = new ChartJsOptions ( )
{
Text = "Sample chart from Blazor" ,
BorderWidth = 1 ,
Display = true ,
// Title of the chart
Title = new ChartJsTitle ( )
{
Display = true , // Set to false for hiding the title
Text = "Title" ,
FontSize = 40
} ,
Layout = new ChartJsLayout ( )
{
// add some space to the chart for better rendering
Padding = new ChartJsPadding ( )
{
Bottom = 0 ,
Left = 0 ,
Right = 0 ,
Top = 50
}
} ,
// move the legend
Legend = new ChartJsLegend ( )
{
Position = "top" ,
Display = true // set to false for hiding legend
} ,
Scales = new ChartJsScale ( )
{
XAxes = new List < ChartJsXAxes > ( )
{
new ChartJsXAxes ( )
{
Ticks = new ChartJsTicks ( )
{
BeginAtZero = true ,
FontSize = 20
} ,
Position = "top"
}
} ,
YAxes = new List < ChartJsYAxes > ( )
{
new ChartJsYAxes ( )
{
Ticks = new ChartJsTicks ( )
{
BeginAtZero = true ,
FontSize = 20 ,
Max = 50 // set a maxmimum value for this axis
}
}
}
} ,
Plugins = new ChartJsPlugins ( )
{
// if you have enabled the plugin you can use these parameters, otherwise it will be ignored
Datalabels = new ChartJsDataLabels ( )
{
Align = "end" ,
Anchor = "end" ,
Color = "black" ,
Display = true ,
Font = new ChartJsDataLabelsFont ( )
{
Size = 20
}
}
}
} ,
Data = new ChartJsBarData ( )
{
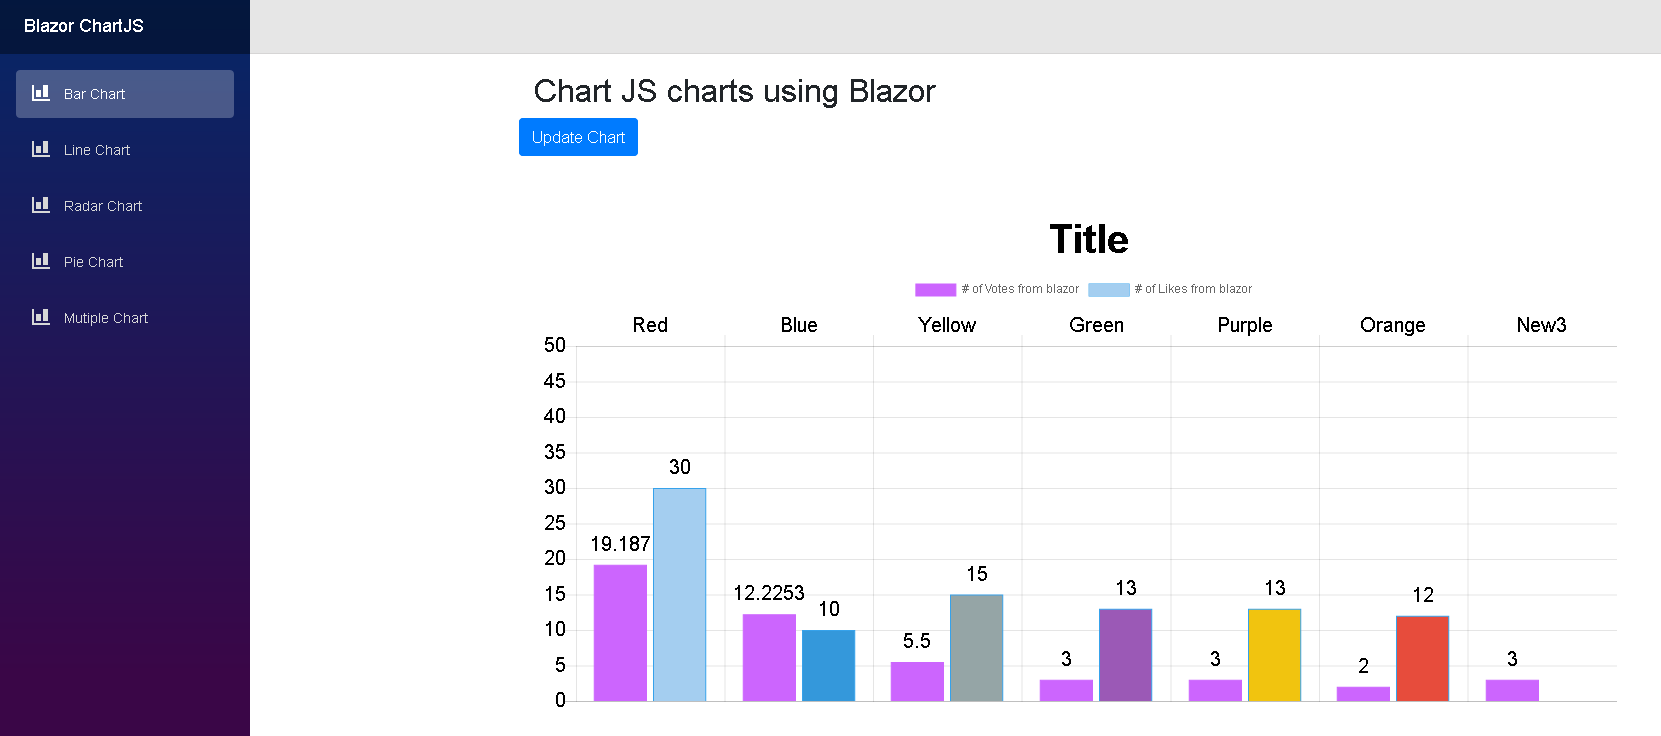
Labels = new List < string > ( ) { "Red" , "Blue" , "Yellow" , "Green" , "Purple" , "Orange" } ,
Datasets = new List < ChartJsBarDataset > ( )
{
new ChartJsBarDataset ( )
{
Label = "# of Votes from blazor" ,
BackgroundColor = new List < string > ( ) { "#cc65fe" } ,
BorderColor = "#cc65fe" ,
PointHoverRadius = 2 ,
Data = new List < double > ( ) { 19.187 , 12.2253 , 5.5 , 3 , 3 , 2 }
} ,
new ChartJsBarDataset ( )
{
Label = "# of Likes from blazor" ,
BackgroundColor = new List < string > ( ) {
"#a4cef0" ,
"#3498db" ,
"#95a5a6" ,
"#9b59b6" ,
"#f1c40f" ,
"#e74c3c" ,
"#34495e" } ,
BorderColor = "#36a2eb" ,
PointHoverRadius = 2 ,
Data = new List < int > ( ) { 30 , 10 , 15 , 13 , 13 , 12 } . Select < int , double > ( i => i ) . ToList ( )
}
}
}
} ;
}
public async Task < bool > UpdateChart ( )
{
//Update existing dataset
blazorBarChartJS . Data . Labels . Add ( $ "New { DateTime . Now . Second } " ) ;
var firstDataSet = blazorBarChartJS . Data . Datasets [ 0 ] ;
firstDataSet . Data . Add ( DateTime . Now . Second ) ;
//Add new dataset
//blazorLineChartJS.Data.Datasets.Add(new ChartJsLineDataset()
//{
// BackgroundColor = "#cc65fe",
// BorderColor = "#cc65fe",
// Label = "# of Votes from blazor 1",
// Data = new List<int> {20,21,12,3,4,4},
// Fill = true,
// BorderWidth = 2,
// PointRadius = 3,
// PointBorderWidth = 1
//});
return true ;
}
} < script src =" //cdnjs.cloudflare.com/ajax/libs/Chart.js/2.7.2/Chart.min.js " > </ script >
< script type =" blazor-boot " >
</ script >2.1。對於使用數據標籤插件,也添加了此信息:
< script src =" //cdn.jsdelivr.net/npm/chartjs-plugin-datalabels " > </ script > @using BlazorComponents.ChartJS
@using BlazorComponents.Shared
@addTagHelper *,BlazorComponents條形圖示例: