BlazorComponents
1.0.0
Note: Just as Blazor, this repo is also experimental.
Wenn Sie die Idee dieses Repo mögen, hinterlassen Sie Ihr Feedback als Problem oder spielen Sie das Repo oder lassen Sie es mich auf @ma_khan wissen
Derzeit beginnend mit einer einfachen Diagramm -Implementierung.
Sie wissen nicht, was Blazor ist? Lesen Sie hier
Vervollständigen Sie alle Blazor -Abhängigkeiten.
Zu installieren
Install-Package BlazorComponents
oder
dotnet add package BlazorComponents
 < div class =" row " >
    < button class =" btn btn-primary " onclick =" @UpdateChart " > Update Chart </ button >
</ div >
< ChartJsBarChart ref =" barChartJs " Chart =" @blazorBarChartJS " Width =" 600 " Height =" 300 " />
@functions {
public ChartJSBarChart blazorBarChartJS { get ; set ; } = new ChartJSBarChart ( ) ;
ChartJsBarChart barChartJs ;
protected override void OnInit ( )
{
blazorBarChartJS = new ChartJSBarChart ( )
{
ChartType = "bar" ,
CanvasId = "myFirstBarChart" ,
Options = new ChartJsOptions ( )
{
Text = "Sample chart from Blazor" ,
BorderWidth = 1 ,
Display = true ,
// Title of the chart
Title = new ChartJsTitle ( )
{
Display = true , // Set to false for hiding the title
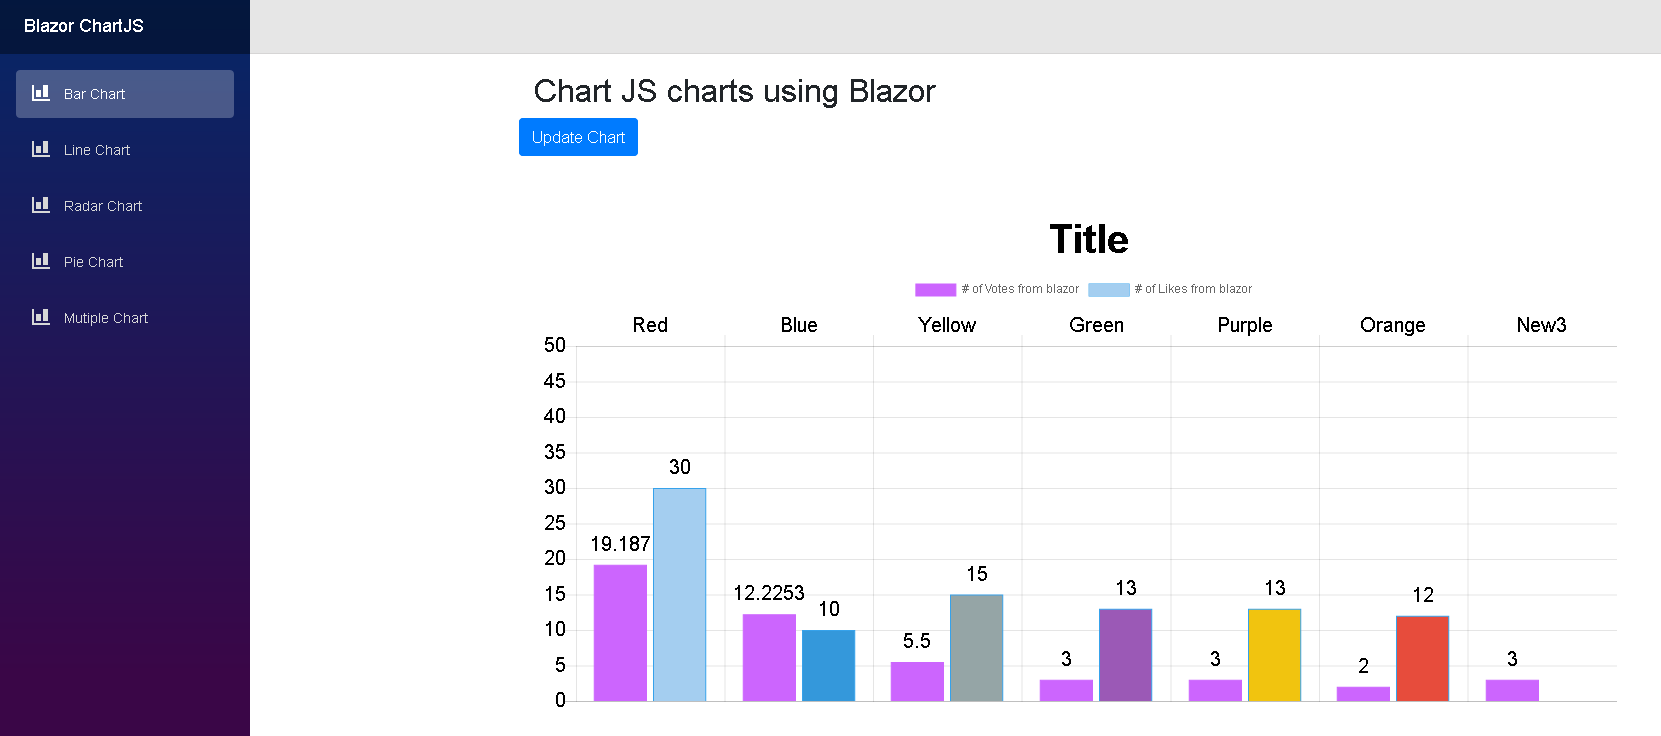
Text = "Title" ,
FontSize = 40
} ,
Layout = new ChartJsLayout ( )
{
// add some space to the chart for better rendering
Padding = new ChartJsPadding ( )
{
Bottom = 0 ,
Left = 0 ,
Right = 0 ,
Top = 50
}
} ,
// move the legend
Legend = new ChartJsLegend ( )
{
Position = "top" ,
Display = true // set to false for hiding legend
} ,
Scales = new ChartJsScale ( )
{
XAxes = new List < ChartJsXAxes > ( )
{
new ChartJsXAxes ( )
{
Ticks = new ChartJsTicks ( )
{
BeginAtZero = true ,
FontSize = 20
} ,
Position = "top"
}
} ,
YAxes = new List < ChartJsYAxes > ( )
{
new ChartJsYAxes ( )
{
Ticks = new ChartJsTicks ( )
{
BeginAtZero = true ,
FontSize = 20 ,
Max = 50 // set a maxmimum value for this axis
}
}
}
} ,
Plugins = new ChartJsPlugins ( )
{
// if you have enabled the plugin you can use these parameters, otherwise it will be ignored
Datalabels = new ChartJsDataLabels ( )
{
Align = "end" ,
Anchor = "end" ,
Color = "black" ,
Display = true ,
Font = new ChartJsDataLabelsFont ( )
{
Size = 20
}
}
}
} ,
Data = new ChartJsBarData ( )
{
Labels = new List < string > ( ) { "Red" , "Blue" , "Yellow" , "Green" , "Purple" , "Orange" } ,
Datasets = new List < ChartJsBarDataset > ( )
{
new ChartJsBarDataset ( )
{
Label = "# of Votes from blazor" ,
BackgroundColor = new List < string > ( ) { "#cc65fe" } ,
BorderColor = "#cc65fe" ,
PointHoverRadius = 2 ,
Data = new List < double > ( ) { 19.187 , 12.2253 , 5.5 , 3 , 3 , 2 }
} ,
new ChartJsBarDataset ( )
{
Label = "# of Likes from blazor" ,
BackgroundColor = new List < string > ( ) {
"#a4cef0" ,
"#3498db" ,
"#95a5a6" ,
"#9b59b6" ,
"#f1c40f" ,
"#e74c3c" ,
"#34495e" } ,
BorderColor = "#36a2eb" ,
PointHoverRadius = 2 ,
Data = new List < int > ( ) { 30 , 10 , 15 , 13 , 13 , 12 } . Select < int , double > ( i => i ) . ToList ( )
}
}
}
} ;
}
public async Task < bool > UpdateChart ( )
{
//Update existing dataset
blazorBarChartJS . Data . Labels . Add ( $ "New { DateTime . Now . Second } " ) ;
var firstDataSet = blazorBarChartJS . Data . Datasets [ 0 ] ;
firstDataSet . Data . Add ( DateTime . Now . Second ) ;
//Add new dataset
//blazorLineChartJS.Data.Datasets.Add(new ChartJsLineDataset()
//{
// BackgroundColor = "#cc65fe",
// BorderColor = "#cc65fe",
// Label = "# of Votes from blazor 1",
// Data = new List<int> {20,21,12,3,4,4},
// Fill = true,
// BorderWidth = 2,
// PointRadius = 3,
// PointBorderWidth = 1
//});
return true ;
}
} < script src =" //cdnjs.cloudflare.com/ajax/libs/Chart.js/2.7.2/Chart.min.js " > </ script >
< script type =" blazor-boot " >
</ script >2.1. Für die Verwendung des Data Label -Plugins fügen Sie dies auch hinzu:
< script src =" //cdn.jsdelivr.net/npm/chartjs-plugin-datalabels " > </ script > @using BlazorComponents.ChartJS
@using BlazorComponents.Shared
@addTagHelper *,BlazorComponents Beispiel für ein Balkendiagramm: