glyth graph
1.0.0
Révision de 0,01
Glyth Graph est un package Python open source, pour graphiquement les équations sur un tableau bidimensionnel (nommé la toile ) avec une variété d'arguments à dessiner dans une plage spécifique et lié. Échelle à la largeur et à la hauteur de la toile en proportion
.Lors de la connexion du constructeur à un objet, un tableau 2D avec la taille de résolution déclarée sera rempli avec le Blank_glyth choisi, nommé la toile .
Le package fonctionne sur les valeurs de mappage entre le x et le f (x) de l'équation du graphique à la résolution donnée de la toile, traduisant les coordonnées avec un facteur de mise à l'échelle non uniforme pour dessiner une glythme par un indice 2D.

où la gamme et la plage à la plage sont respectivement la région de l'axe x donné de l'équation à dessiner.
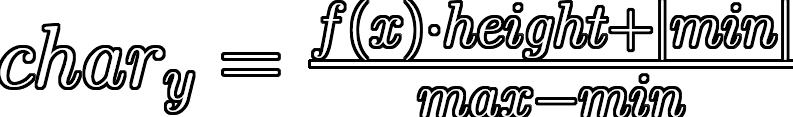
où Max et Min sont respectivement les valeurs calculées (ou données) maximales et minimales de l'axe y pour l'équation dans la région de l'axe X.
 The constructor of the class to create an attached object, setup the canvas array with the arguements given, both the size and blank (background) glyth

 - resolution: the width by the height of the canvas measured in character glyths | 'x'.join([width, height])
 - blank_glyth: the background glyth used for spacing the graph
 Format the graph equation such that all unecessary characters are removed to be processed, this includes removal of 'y' and '=' if given an equation to form an expression and all ' ' (spaces) present

- equation: the mathematical equation of the graph going to be drawn
 Calculate the upper and lower bounds in the y-axis of a graph equation between the given x-axis range, to be used later for mapping positions

- equation: the mathematical equation of the graph going to be drawn
- x_range: a tuple of the x-axis range between which the graph will be used, all outside this is unnecessary
 Draw a glyth onto the canvas array dependent on given arguments in relation to the graph equation, including the x-axis range and y-axis bounds of the 2-dimensional section of the graph and character position along the canvas

- char_x: the x_axis glyth position of the canvas, such that it starts to the leftmost position (0) to the rightmost (canvas width - 1) | 0 <= char_x < canvas width
- equation: the mathematical equation of the graph going to be drawn
- glyth: the character/s to be drawn onto the canvas at the calculated coordinate relative to the graph equation
- x_range: a tuple of the x-axis range between which the graph will be used, all outside this is unnecessary | (range_from, range_to)
- y_bounds: a tuple of the y-axis bounds for the x-axis region of the graph, including both the minimum and maximum values | (min, max)
Clear the canvas by replacing all indicies in the array with the blank glyth assigned in the constructor, removing any graphs drawn
 Pretty print the canvas array into equal rows of the set width with newline character moving to the next row, as each index is printed incrementally

- clear: a boolean value (either True or False) whether to clear the each canvas array index after printing the index | True or False
 from glyth_graph import graph_basic
from random import choice

character_set = '0123456789ABCDEFGHIJKLMNOPQRSTUVWXYZabcdefghijklmnopqrstuvwxyz+/'

print ( '---Glyth Graph---' )

print ( ' n ---Resolution---' )
width = int ( input ( 'Width (chars): ' ))
height = int ( input ( 'Height (chars): ' ))

glyth_graph = graph_basic (
    resolution = 'x' . join ([ str ( width ), str ( height )]),
    blank_glyth = '  '
)

while True :
    print ( ' n ---Graph Properties---' )
    equation = glyth_graph . format_equation ( input ( 'Equation: ' ))
    range_from , range_to = int ( input ( 'x-axis From: ' )), int ( input ( 'x-axis To: ' ))
    print ()

    bounds = glyth_graph . y_bounds (
        equation = equation ,
        x_range = ( range_from , range_to )
    )

    for char_x in range ( 0 , width ):
        glyth_graph . draw_graph (
            char_x = char_x ,
            equation = equation ,
            glyth = choice ( character_set ),
            x_range = ( range_from , range_to ),
            y_bounds = bounds
        )

    glyth_graph . print_canvas ()
Un exemple de sortie du programme, qui peut varier avec des valeurs personnalisées pour toutes les entrées données, assez en impression du tableau Canvas:
 ---Glyth Graph---

---Resolution---
Width (chars): 100
Height (chars): 30

Width: 100 | Height: 30

---Graph Properties---
Equation: y = math.sin(x)
x-axis From: 0
x-axis To: 6.283185

                     LbvwLB+K
                  Rp8        49D
                MB              FgW
              Kt                   O
            i6                      +w
           t                          f
          z                            LZ
        k7                               q
       9                                  q
      Y                                    G
     3                                      yP
    r                                         c
   9                                           h
  C                                             4
 f                                               K
l                                                 M                                               oe
                                                   o                                             7
                                                    y                                           n
                                                     O                                         e
                                                      tf                                      0
                                                        M                                    u
                                                         r                                  O
                                                          I                               lv
                                                           o8                            w
                                                             L                          A
                                                              Q2                      uO
                                                                w                   LD
                                                                 zvu              8x
                                                                    nGl        xMw
                                                                       XsohPTDx
| Autorisation | Conditions | Limites |
|---|---|---|
| Usage commercial | Licence et avis de droit d'auteur | Responsabilité |
| Distribution | Garantie | |
| Modification | ||
| Usage privé |
 MIT License

Copyright (c) 2021 Ivan (GitHub: ivanl-exe, E-Mail: [email protected])

Permission is hereby granted, free of charge, to any person obtaining a copy
of this software and associated documentation files (the "Software"), to deal
in the Software without restriction, including without limitation the rights
to use, copy, modify, merge, publish, distribute, sublicense, and/or sell
copies of the Software, and to permit persons to whom the Software is
furnished to do so, subject to the following conditions:

The above copyright notice and this permission notice shall be included in all
copies or substantial portions of the Software.

THE SOFTWARE IS PROVIDED "AS IS", WITHOUT WARRANTY OF ANY KIND, EXPRESS OR
IMPLIED, INCLUDING BUT NOT LIMITED TO THE WARRANTIES OF MERCHANTABILITY,
FITNESS FOR A PARTICULAR PURPOSE AND NONINFRINGEMENT. IN NO EVENT SHALL THE
AUTHORS OR COPYRIGHT HOLDERS BE LIABLE FOR ANY CLAIM, DAMAGES OR OTHER
LIABILITY, WHETHER IN AN ACTION OF CONTRACT, TORT OR OTHERWISE, ARISING FROM,
OUT OF OR IN CONNECTION WITH THE SOFTWARE OR THE USE OR OTHER DEALINGS IN THE
SOFTWARE.


