glyth graph
1.0.0
Revisión para 0.01
El gráfico de Glyth es un paquete de pitón de código abierto, para gráficos de ecuaciones en una matriz bidimensional (llamada lienzo ) con una variedad de argumentos para dibujar dentro de un rango específico y límite. Escala hasta el ancho y la altura del lienzo en proporción
.Al colocar el constructor a un objeto, una matriz 2D con el tamaño de resolución declarado se llenará con el blank_gly de elegido, llamado el lienzo .
El paquete opera en los valores de mapeo entre el X y F (X) desde la ecuación gráfica hasta la resolución dada del lienzo, traduciendo las coordenadas con un factor de escala no uniforme para dibujar un glyth por un índice 2D.

donde el rango y el rango son respectivamente la región dada del eje x de la ecuación para dibujar.
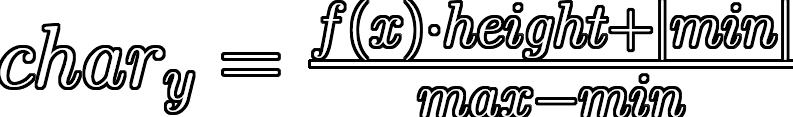
donde max y min son respectivamente los valores calculados (o dados) máximos y mínimos del eje y para la ecuación dentro de la región del eje x.
 The constructor of the class to create an attached object, setup the canvas array with the arguements given, both the size and blank (background) glyth

 - resolution: the width by the height of the canvas measured in character glyths | 'x'.join([width, height])
 - blank_glyth: the background glyth used for spacing the graph
 Format the graph equation such that all unecessary characters are removed to be processed, this includes removal of 'y' and '=' if given an equation to form an expression and all ' ' (spaces) present

- equation: the mathematical equation of the graph going to be drawn
 Calculate the upper and lower bounds in the y-axis of a graph equation between the given x-axis range, to be used later for mapping positions

- equation: the mathematical equation of the graph going to be drawn
- x_range: a tuple of the x-axis range between which the graph will be used, all outside this is unnecessary
 Draw a glyth onto the canvas array dependent on given arguments in relation to the graph equation, including the x-axis range and y-axis bounds of the 2-dimensional section of the graph and character position along the canvas

- char_x: the x_axis glyth position of the canvas, such that it starts to the leftmost position (0) to the rightmost (canvas width - 1) | 0 <= char_x < canvas width
- equation: the mathematical equation of the graph going to be drawn
- glyth: the character/s to be drawn onto the canvas at the calculated coordinate relative to the graph equation
- x_range: a tuple of the x-axis range between which the graph will be used, all outside this is unnecessary | (range_from, range_to)
- y_bounds: a tuple of the y-axis bounds for the x-axis region of the graph, including both the minimum and maximum values | (min, max)
Clear the canvas by replacing all indicies in the array with the blank glyth assigned in the constructor, removing any graphs drawn
 Pretty print the canvas array into equal rows of the set width with newline character moving to the next row, as each index is printed incrementally

- clear: a boolean value (either True or False) whether to clear the each canvas array index after printing the index | True or False
 from glyth_graph import graph_basic
from random import choice

character_set = '0123456789ABCDEFGHIJKLMNOPQRSTUVWXYZabcdefghijklmnopqrstuvwxyz+/'

print ( '---Glyth Graph---' )

print ( ' n ---Resolution---' )
width = int ( input ( 'Width (chars): ' ))
height = int ( input ( 'Height (chars): ' ))

glyth_graph = graph_basic (
    resolution = 'x' . join ([ str ( width ), str ( height )]),
    blank_glyth = '  '
)

while True :
    print ( ' n ---Graph Properties---' )
    equation = glyth_graph . format_equation ( input ( 'Equation: ' ))
    range_from , range_to = int ( input ( 'x-axis From: ' )), int ( input ( 'x-axis To: ' ))
    print ()

    bounds = glyth_graph . y_bounds (
        equation = equation ,
        x_range = ( range_from , range_to )
    )

    for char_x in range ( 0 , width ):
        glyth_graph . draw_graph (
            char_x = char_x ,
            equation = equation ,
            glyth = choice ( character_set ),
            x_range = ( range_from , range_to ),
            y_bounds = bounds
        )

    glyth_graph . print_canvas ()
Un ejemplo de una salida al programa, que puede variar con valores personalizados para todas las entradas dadas, imprimiendo bonita la matriz de lienzo:
 ---Glyth Graph---

---Resolution---
Width (chars): 100
Height (chars): 30

Width: 100 | Height: 30

---Graph Properties---
Equation: y = math.sin(x)
x-axis From: 0
x-axis To: 6.283185

                     LbvwLB+K
                  Rp8        49D
                MB              FgW
              Kt                   O
            i6                      +w
           t                          f
          z                            LZ
        k7                               q
       9                                  q
      Y                                    G
     3                                      yP
    r                                         c
   9                                           h
  C                                             4
 f                                               K
l                                                 M                                               oe
                                                   o                                             7
                                                    y                                           n
                                                     O                                         e
                                                      tf                                      0
                                                        M                                    u
                                                         r                                  O
                                                          I                               lv
                                                           o8                            w
                                                             L                          A
                                                              Q2                      uO
                                                                w                   LD
                                                                 zvu              8x
                                                                    nGl        xMw
                                                                       XsohPTDx
| Permisos | Condiciones | Limitaciones |
|---|---|---|
| Uso comercial | Aviso de licencia y derechos de autor | Responsabilidad |
| Distribución | Garantía | |
| Modificación | ||
| Uso privado |
 MIT License

Copyright (c) 2021 Ivan (GitHub: ivanl-exe, E-Mail: [email protected])

Permission is hereby granted, free of charge, to any person obtaining a copy
of this software and associated documentation files (the "Software"), to deal
in the Software without restriction, including without limitation the rights
to use, copy, modify, merge, publish, distribute, sublicense, and/or sell
copies of the Software, and to permit persons to whom the Software is
furnished to do so, subject to the following conditions:

The above copyright notice and this permission notice shall be included in all
copies or substantial portions of the Software.

THE SOFTWARE IS PROVIDED "AS IS", WITHOUT WARRANTY OF ANY KIND, EXPRESS OR
IMPLIED, INCLUDING BUT NOT LIMITED TO THE WARRANTIES OF MERCHANTABILITY,
FITNESS FOR A PARTICULAR PURPOSE AND NONINFRINGEMENT. IN NO EVENT SHALL THE
AUTHORS OR COPYRIGHT HOLDERS BE LIABLE FOR ANY CLAIM, DAMAGES OR OTHER
LIABILITY, WHETHER IN AN ACTION OF CONTRACT, TORT OR OTHERWISE, ARISING FROM,
OUT OF OR IN CONNECTION WITH THE SOFTWARE OR THE USE OR OTHER DEALINGS IN THE
SOFTWARE.


