COVID 19 NLP vis
1.0.0
The technology stack of this project is basic enough and should be very suitable for beginner data analysis and visualization projects. Basically, as long as you understand python and have basic knowledge of crawlers, networks, html, etc., you can achieve it.
The epidemic of novel coronavirus pneumonia (COVID-19, referred to as "new coronavirus pneumonia") has raging many countries around the world. On March 11, 2020, the World Health Organization (WHO) officially announced that it would list new coronavirus pneumonia as a global pandemic.
In the process of fighting the new coronavirus epidemic globally, unprecedented large-scale epidemic data have been generated. Big data analysis technology and methods can help discover virus infection sources, monitor the development of the epidemic, and allocate rescue materials, so as to better carry out epidemic prevention and control work. As an important part of big data analysis, spatial data analysis organically combines intelligent data processing, intuitive display and interactive analysis, so that machine intelligence and human intelligence are deeply integrated and complementary to each other's advantages, providing an effective basis and guide for analysis, command and decision-making in epidemic prevention and control.
This project hopes to use interactive spatial data analysis technology and use flask + pyecharts to build a simple interactive analysis platform for visualizing and visualizing the new crown pneumonia epidemic data, perceive and predict the development trends and key nodes of the epidemic, analyze the dynamic evolution of social media topics and emotions, and realize the situation of social public opinion.
The project analysis report has been deployed to the web page, you can click http://covid.yunwei123.tech/ to view it
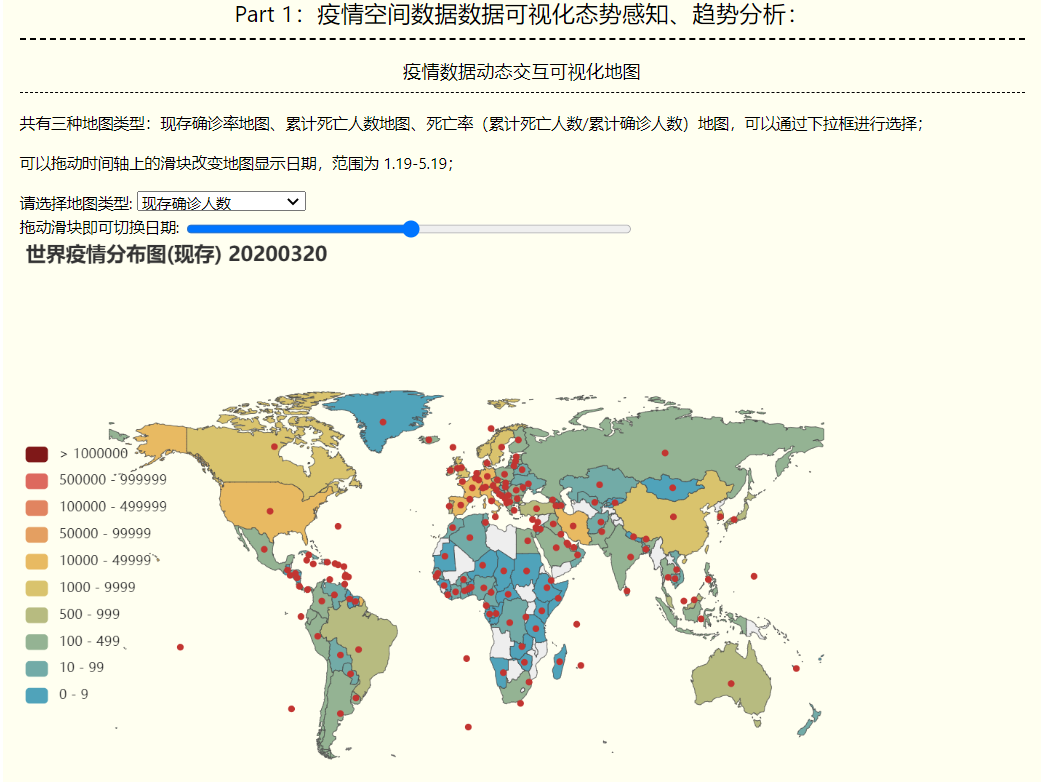
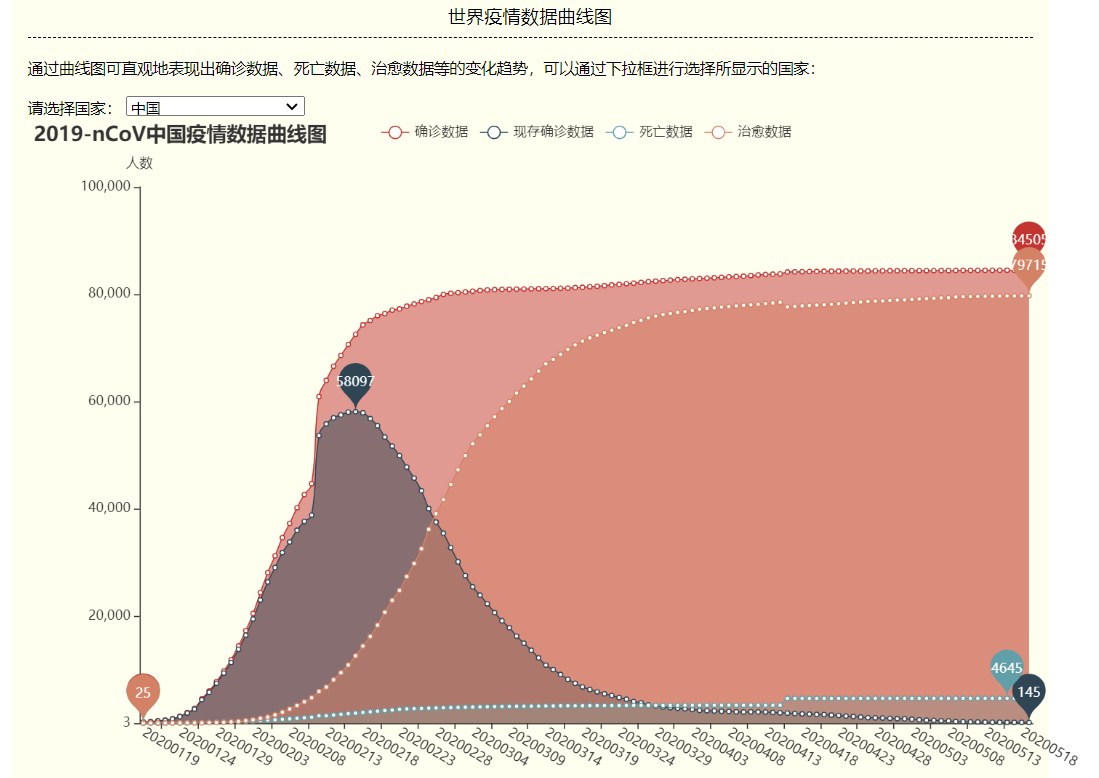
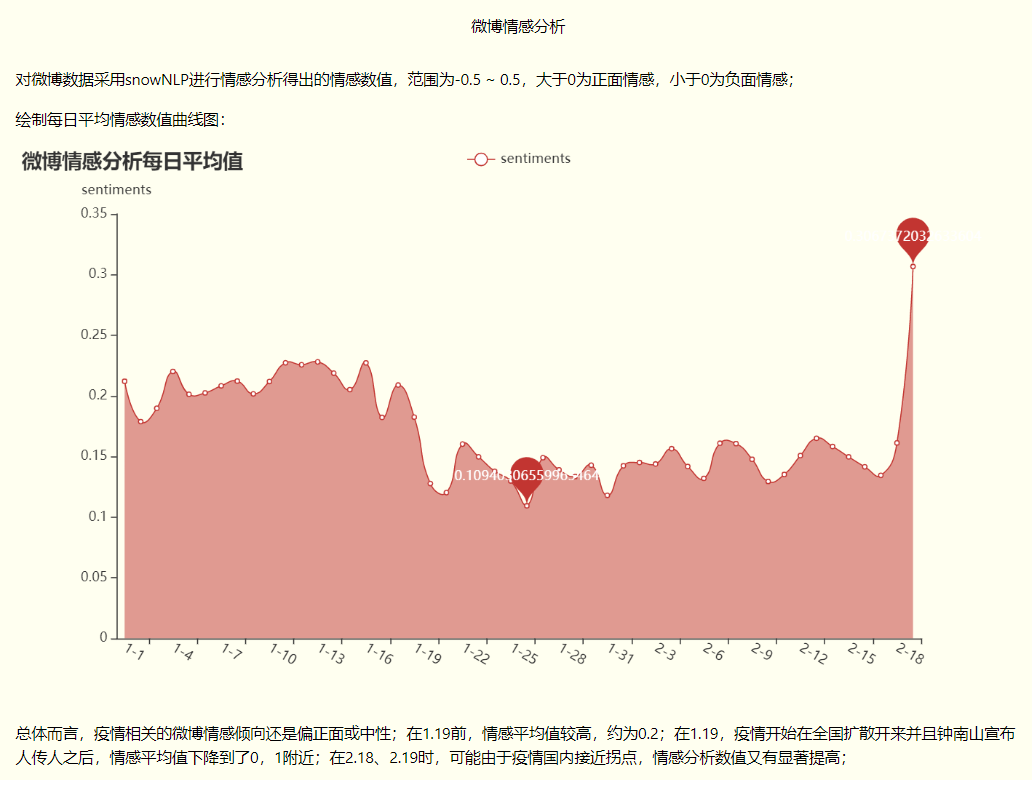
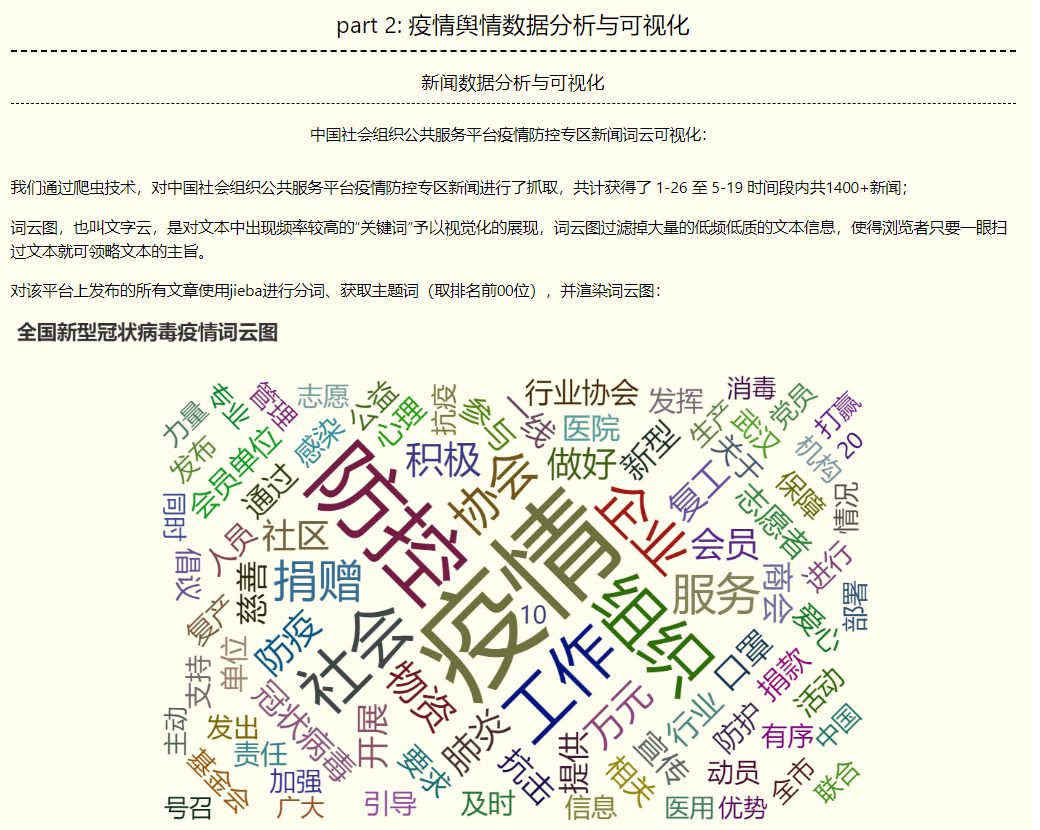
Screenshot of interactive visual analysis report:
dataSets
china_provincedata.csv epidemic data from provinces, municipalities, autonomous regions and special administrative regions in China
countrydata.csv epidemic data from 214 countries and regions around the world and Diamond Princess cruise ship
nCoV_900k_train.unlabled.csv
The data set collects data based on 230 theme keywords related to "new coronavirus pneumonia", and captures a total of 1 million Weibo data from January 1, 2020 to February 20, 2020, and manually marks 100,000 of them. The annotations are divided into three categories: 1 (positive), 0 (neutral) and -1 (negative).
nCoV_100k_train.labled.csv is the same as above, marked
Since the original dataset cannot be found, only the processed files are currently
nCov_10k_test.csv Same as above
yqkx_data-5_21.csv 100 People's Daily Epidemic News obtained using crawlers
China Social Organization_Epidemic Prevention and Control-5_21.csv China Social Organization Public Service Platform Epidemic Prevention and Control Zone News
weiboComments-5_21.csv 5.21 Weibo and comment data under the theme of "Fighting the Epidemic"
notebook used for analysis
myScripts python scripts (crawlers, visualizations, data processing, etc.)
templates: website html/css/js and picture files
index.md: markdown version of the website
server.py: flask app
Design of the prediction algorithm for timing data of new coronavirus pneumonia.docx
Use docker:
 docker build -t covidvisimage .
docker run -d --name covidvis -p 5000:5000 covidvisimage
OR:
 pip3 install -r requirements.txt
python3 server.py
Note: The pyecharts version used here is 1.7.1 , which may be partially incompatible with subsequent versions 1.8 or above. You can install it through the following command:
pip install pyecharts==1.7.1


