cufflinks
1.0.0
تربط هذه المكتبة قوة مؤامرة مع مرونة الباندا لسهولة التخطيط.
هذه المكتبة متوفرة على https://github.com/santosjorge/cufflinks
يفترض هذا البرنامج التعليمي أن بيانات اعتماد المستخدم المؤسسة قد تم تكوينها بالفعل كما هو مذكور في دليل البدء.
دعم لارتلي 4.x
لم تعد أزرار أكمام أزرار أكمام متوافقة مع مؤسسة 3.x
دعم لارتيلي 3.0
مساعد iplot جديد. لرؤية قائمة شاملة من المعلمات cf.help ()
 # For a list of supported figures
cf . help ()
# Or to see the parameters supported that apply to a given figure try
cf . help ( 'scatter' )
cf . help ( 'candle' ) #etcإزالة التبعية على TA-LIB. لم تعد هذه المكتبة مطلوبة. تم إعادة كتابة جميع الدراسات في بيثون.
QuantFigure هو فئة جديدة ستولد كائن الرسم البياني مع الثبات. يمكن إضافة/تعديل المعلمات في أي نقطة معينة.يمكن أن يكون هذا سهلاً مثل:
 df = cf . datagen . ohlc ()
qf = cf . QuantFig ( df , title = 'First Quant Figure' , legend = 'top' , name = 'GS' )
qf . add_bollinger_bands ()
qf . iplot ()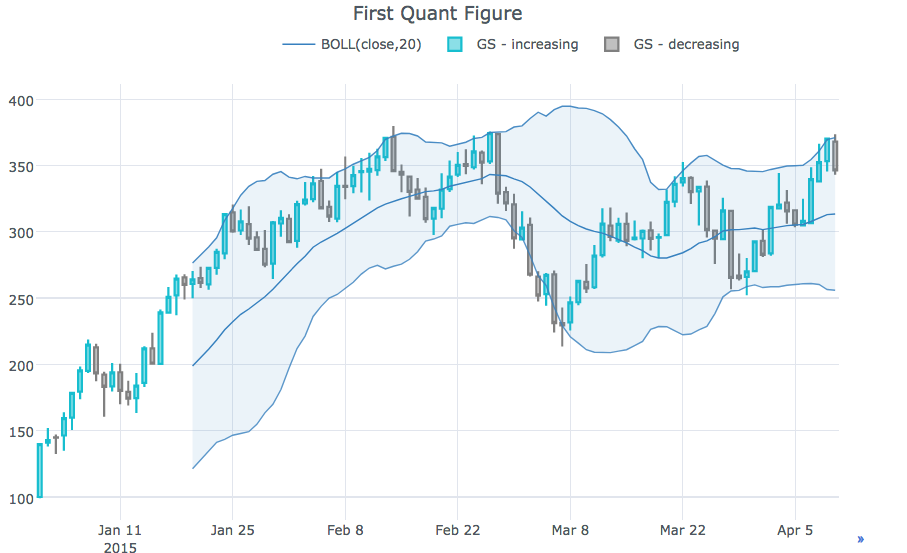
 qf . add_sma ([ 10 , 20 ], width = 2 , color = [ 'green' , 'lightgreen' ], legendgroup = True )
qf . add_rsi ( periods = 20 , color = 'java' )
qf . add_bollinger_bands ( periods = 20 , boll_std = 2 , colors = [ 'magenta' , 'grey' ], fill = True )
qf . add_volume ()
qf . add_macd ()
qf . iplot ()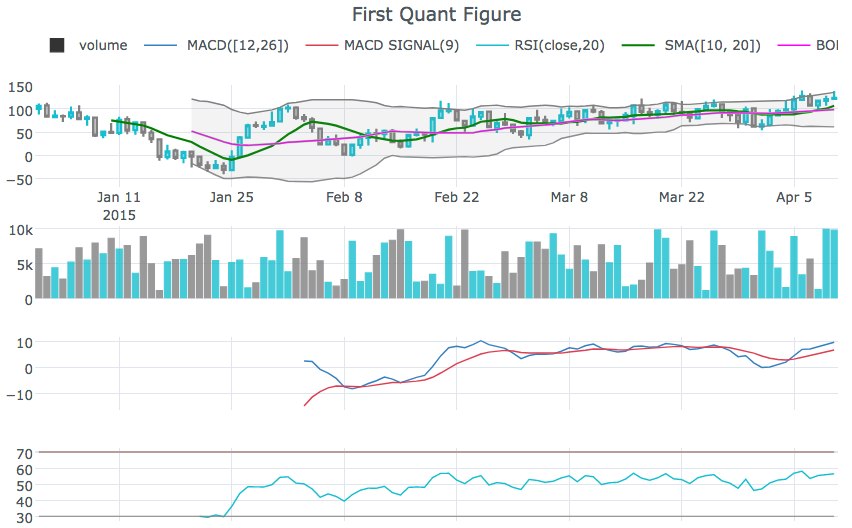
rangeslider لعرض شريط التمرير النطاق في الأسفلcf.datagen.ohlc().iplot(kind='candle',rangeslider=True)rangeselector لعرض أزرار لتغيير نطاق التاريخ المعروضcf.datagen.ohlc(500).iplot(kind='candle', rangeselector={ 'steps':['1y','2 months','5 weeks','ytd','2mtd','reset'], 'bgcolor' : ('grey',.3), 'x': 0.3 , 'y' : 0.95})fontsize ، fontcolor ، textanglecf.datagen.lines(1,mode='stocks').iplot(kind='line', annotations={'2015-02-02':'Market Crash', '2015-03-01':'Recovery'}, textangle=-70,fontsize=13,fontcolor='grey')cf.datagen.lines(1,mode='stocks').iplot(kind='line', annotations=[{'text':'exactly here','x':'0.2', 'xref':'paper','arrowhead':2, 'textangle':-10,'ay':150,'arrowcolor':'red'}])Figure.iplot()cf.datagen.ohlc().iplot(kind='candle')iplotxrange و yrange و zrange في iplot و getLayoutcf.datagen.lines(1).iplot(yrange=[5,15])layout_update في iplot و getLayout لتحديث أي قيمة Layout بشكل صريحانظر دفتر Ipython
cf.datagen.pie().iplot(kind='pie',labels='labels',values='values')datagen.ohlc()ohlc=cf.datagen.ohlc()ohlc.iplot(kind='candle',up_color='blue',down_color='red')ohlc=cf.datagen.ohlc()ohlc.iplot(kind='ohlc',up_color='blue',down_color='red')df=pd.DataFrame([x**2] for x in range(100))df.iplot(kind='lines',logy=True)cf.datagen.lines(1,5).iplot(kind='bar',error_y=[1,2,3.5,2,2])cf.datagen.lines(1,5).iplot(kind='bar',error_y=20, error_type='percent')cf.datagen.lines(1).iplot(kind='lines',error_y=20,error_type='continuous_percent')cf.datagen.lines(1).iplot(kind='lines',error_y=10,error_type='continuous',color='blue')cf.datagen.lines(1,500).ta_plot(study='sma',periods=[13,21,55])cf.datagen.lines(1,200).ta_plot(study='boll',periods=14)cf.datagen.lines(1,200).ta_plot(study='rsi',periods=14)cf.datagen.lines(1,200).ta_plot(study='macd',fast_period=12,slow_period=26, signal_period=9)cf.go_offline()cf.go_online()cf.iplot(figure,online=True) (لفرض الإنترنت أثناء الوضع غير المتصل)fig=cf.datagen.lines(3,columns=['a','b','c']).figure()fig=fig.set_axis('b',side='right')cf.iplot(fig)cufflinks.set_config_file(theme='pearl')cufflinks.datagen.lines(5).iplot(theme='ggplot')cufflinks.datagen.lines(2).iplot(kind='barh',barmode='stack',bargap=.1)cufflinks.datagen.histogram().iplot(kind='histogram',orientation='h',norm='probability')cufflinks.datagen.lines(4).iplot(kind='area',fill=True,opacity=1)cufflinks.datagen.histogram(4).iplot(kind='histogram',subplots=True,bins=50)cufflinks.datagen.lines(4).iplot(subplots=True,shape=(4,1),shared_xaxes=True,vertical_spacing=.02,fill=True)cufflinks.datagen.lines(4,1000).scatter_matrix()cufflinks.datagen.lines(3).iplot(hline=[2,3])cufflinks.datagen.lines(3).iplot(hline=dict(y=2,color='blue',width=3))cufflinks.datagen.lines(3).iplot(hspan=(-1,2))cufflinks.datagen.lines(3).iplot(hspan=dict(y0=-1,y1=2,color='orange',fill=True,opacity=.4))cufflinks.set_config_file(world_readable=True)cufflinks.datagen.lines(2).iplot(kind='spread')cufflinks.datagen.heatmap().iplot(kind='heatmap')cufflinks.datagen.bubble(4).iplot(kind='bubble',x='x',y='y',text='text',size='size',categories='categories')cufflinks.datagen.bubble3d(4).iplot(kind='bubble3d',x='x',y='y',z='z',text='text',size='size',categories='categories')cufflinks.datagen.box().iplot(kind='box')cufflinks.datagen.surface().iplot(kind='surface')cufflinks.datagen.scatter3d().iplot(kind='scatter3d',x='x',y='y',z='z',text='text',categories='categories')cufflinks.datagen.histogram(2).iplot(kind='histogram')cufflinks.datagencufflinks.to_df(Figure)iplot(colorscale='accent') لرسم مخطط باستخدام مقياس لون لهجةiplot(colors=['pink','red','yellow'])

