ECEMasterProject
Initial Release of Master Project
在自然災害/現象的情況下,可能會發生停電。為了對抗這一點,電動汽車(電動汽車)駕駛員可以將其車輛用作客戶/客戶的電池。為了模擬這一挑戰的困難,即在停電期結束之前,找到盡可能多的客戶,創建了RL環境。該環境具有基於節點網絡大小,房屋數量(不能大於節點大小),停電數據和住房模型的隨機場景,以模擬高水平的響應。
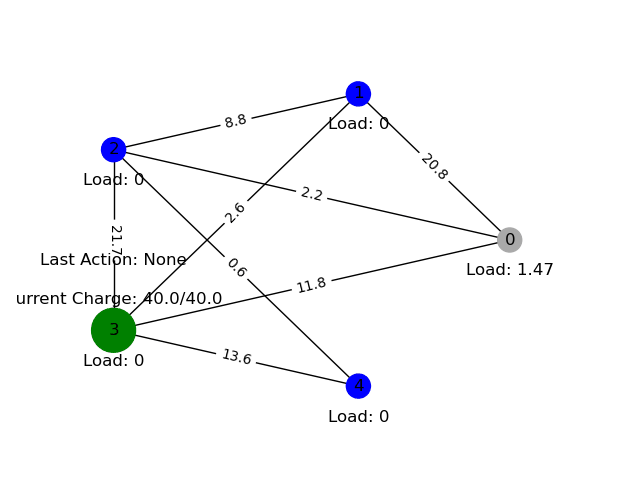
動作中的隨機代理的示例。
負載代表目前從節點所需的功率。
當前費用代表代理(或汽車)具有的功率。
邊緣的值代表了邊緣成本的里程。
藍色節點代表緩衝區。綠節點代表房屋。灰色節點表示停電節點。
可以在Action&State Space部分中找到更多詳細信息。
克隆項目
git clone https://github.com/Natemen96/ECEMasterProject.git轉到項目目錄
cd ECEMasterProject/RL python main.py警告:這是一個較大的安裝(〜2GB),根據互聯網速度,大約需要30分鐘。根據您的設置,您可能會發現自己更容易自己安裝包裝。該列表可以在conda_env文件夾中找到。有關最新的包裝列表,請參見'conda_env/rl_window.yml'。在Windows上最有效。
要輕鬆安裝,首先使用CONDA確保已安裝Conda。
安裝conda後,請執行以下操作以設置環境
  conda env create -f conda_env/rl_window.yml --name rl_env  # or any name you prefer

  conda activate rl_env # verify it work
確保在Conda Env中運行該程序。
可以從山核桃街/dataport下載住房數據
從“家”(節點)前往每個位置以換取電力(EV的主要資源),卸載電力以換取獎勵,回到家中以換取電力。代理商可以恢復“家”的電力,並根據其恢復的力量獲得更多的獎勵。它自己恢復的力量越多,獎勵就越多。
將電源恢復到具有電源充電站的節點中,代理也可以在那裡恢復能量。有些節點將取決於參數。
graph_env: Randomly generated a fully connected graph n nodes

Args:
    n (int, optional): [number of nodes]. Defaults to 5.
    numofhome (int, optional): [number of homes for agent starting
    point]. Defaults to 1.
    numofblackout (int, optional): [number of houses with blackout].
    Defaults to 1.
    numofblackoutws (int, optional): [number of blackout houses with
    solarpower]. Defaults to 0.
    numofchargingstation (int, optional): [number of charging
    station]. Defaults to 0.
    max_actions (int, optional): [max number of action can be done
    times 7.  By default 3 (7) = 21]. Defaults to 3.
    blackout_str (str, optional): [Reads Blackout data from npy
    file. Blackout data from the 2021 Texas Power Crisis, a file for
    each country]. Defaults to 'Brazoria'.
    agents (list, optional): [Agent objects]. Defaults to [None].
    nonsolarhouse_data_paths (list, optional): [Path for npy file
    with nonsolar data info. Added to a node per path.]. Defaults to
    [None].
    solarhouse_data_paths (list, optional): [Path for npy file with
    solarhouse data info. Added to a node per path.]. Defaults to
    [None].
    data_sample (int, optional): [how many data sample it take from
    data in paths, samples taken evenly throughout data. By default
(0/6. 1/6 ... 6/6 0/6 ...) sample]. Defaults to 6.BasicAgent: Basic Agent that act as skeleton for other agent. Won't work by itself.
Args:
car ([dict]): [car information in the form of a python
dictionary. Required dict information: model, make, year,
avg_energy_consumption(kWh/mile), battery_capacity(kWh)]SmartQLAgent: Smart Agent that uses Qtable to make decisions
Args:
car ([dict]): [car information in the form of a python
dictionary. Required dict information: model, make, year,
avg_energy_consumption(kWh/mile), battery_capacity(kWh)]
sample_rate (int, optional): [decides how often a sample of the
qtable is taken. If left to default it's every 1/100 of total ep]
. Defaults to 100.
qtabletraining (bool, optional): [Flag for turning qtable
training on]. Defaults to True.
quiet (bool, optional): [Flag for turning data collection on].
Defaults to True.RandomDataAgent: Used for data collection of random agent. Doesn't
use Observation.
Args:
car ([dict]): [car information in the form of a python
dictionary. Required dict information: model, make, year,
avg_energy_consumption(kWh/mile), battery_capacity(kWh)]給予卸載,充電給予獎勵。電力恢復的多樣性將帶來更多的回報。獎勵因能量用盡而失去。當電動汽車出現能源或網絡完全動力時,情節已經結束。
    Each Agent will have 24 actions per ep by default.

    e+2 Actions:
        e - Move (at cost) to Node if possible
        1 - Unload (at cost)
        1 - Recharge (no cost, expect an action)

    2 * n + 6 * n + 300 * n + c States:
        n - Statuses of Each Node
            Key - Assignment
            0 - Buffer (Blue)
            1 - Blackout (Darkgrey)
            2 - Blackout with Solar (Lightgrey)
            3 - Powered (Blue)
            4 - Charging Station (Yellow)
            5 - Home (Green)

        n - Cost of each edge

        n - Is the path reachable or not?
            0 - No
            1 - Yes

        c - Charge State (400 possible values by default)

where n is the number of nodes states, e is the number of edges, and c number of is Charge states 每個節點均設計為基於房屋數據集。與非極性動力房屋相比,一些太陽能的房屋需要更少的電動汽車功率。房屋節點的成本可以從住房數據中得出。
基於德克薩斯停電數據以及每天更改的停電百分比。
至少使用Q學習來找到最佳解決方案。
可以縮放到多個EV(需要MARL)和更大的網絡。 MARL尚未經過全面測試,可能很大。
在50K EPS的測試運行期間,與隨機代理相比(隨機操作)相比,QTABLES支持的智能代理提高了263.13%。
scripts/Data/TexasBlackout.csv
    -csv file of data collected from https://poweroutage.us/area/state/texas during the 2021 Texas Power Crisis with the following
    - Metrics: ID,County,Customers Tracked,Customers Out,Outage %,DateTime

ECEMasterProject/RL/Data/
    Avg_House_0/
        - npy files of average daily power per every 15 mins of various houses provide by Dataport

    Avg_House_1/
        - npy files of next day regression of Avg_House_0 per house

    Avg_House_n/
        - npy files of concatenation of Avg_House_0 adn Avg_House_1 per houses

    County/
        - npy files of Texas County that were effect the most during the 2021 Texas Power Crisis

RL/agent/Sim_Data
    - csv file result from various RL training, only stored reward.

RL/agent/agent_jsons/
    -various json file of EV information
    -Metrics: model, make, year, avg_energy_consumption(kWh/mile), battery_capacity(kWh), source
models/

    KM/
        -Classifier models trained using Time Series K Means stored in h5

    LSTM/
        -Old LSTM regression model trained on one house stored in h5

    LSTM_nonsolar/
        -LSTM regression model trained on non solar data stored in h5

    LSTM_solar/
        -LSTM regression model trained on solar data stored in h5

    Qtables/
        -Qtables from RL training stored in h5
notebooks/

    analysis_c0.ipynb
        -Analysis of classifier and regression model on solar houses data

    analysis_c1.ipynb
        -Analysis of classifier and regression model on nonsolar houses data

    cluster.ipynb
        -Creation and Analysis of classifier that can distinguish between solar and nonsolar data

    compare_qtable_analyis.ipynb
        -Comparing Qtable Smart Agent with Random Agent Baseline

    D_LSTM_HousingData.ipynb
        -Creation and analysis of regression on avg housing data where the original data sample occurs every 15 mins -> 98 sample per day

    Dp1_analysis.ipynb
        -Creation and analysis of regression on one house

    EveryNyHouseAvg.ipynb
        -Creation and analysis of regression on all house samples with model trained on one house (house 1)

    LSTM_cluster0.ipynb
        -Creation and analysis of regression on one house using most of the solar housing data

    LSTM_cluster1.ipynb
        -Creation and analysis of regression on one house using most of the nonsolar housing data

    qtable_analyis_4_19.ipynb
        -Analysis of Smart Agents performance

    qtable_analyis_4_22.ipynb
        -Analysis of Smart Agents performance

    qtable_analyis.ipynb
        -Analysis of Smart Agents performance

    random_agent_analyis.ipynb
        -Analysis of Random Agents performance

    Texas_Blackout.ipynb
-Analysis of recorded Blackout Data隨著天的過去,一些邊緣可以阻止並恢復(模擬自然災害)
添加測試
DRL和經典優化技術
調試馬爾
轉換為OpenAI環境
了解更多有關製作DL/ML模型的信息。
從探索數據和DL/ML培訓結果中了解了有關數據分析的更多信息。
了解了網絡X及其與項目相關的圖理論的功能。
了解更多有關增強學習環境和代理的知識。
在2021年德克薩斯州電力危機期間需要刮擦停電數據,了解了有關數據刮擦的更多信息
學會瞭如何使用Python中的圖像製作GIF。
感謝我母校普渡大學的秦教授的驚人支持,並為該項目分享了他的專業知識。
感謝Dataport和Pecan Street提供的住房數據以構建模型。
感謝棋盤遊戲的創建者Matt Leacock啟發了這種強化學習環境。


