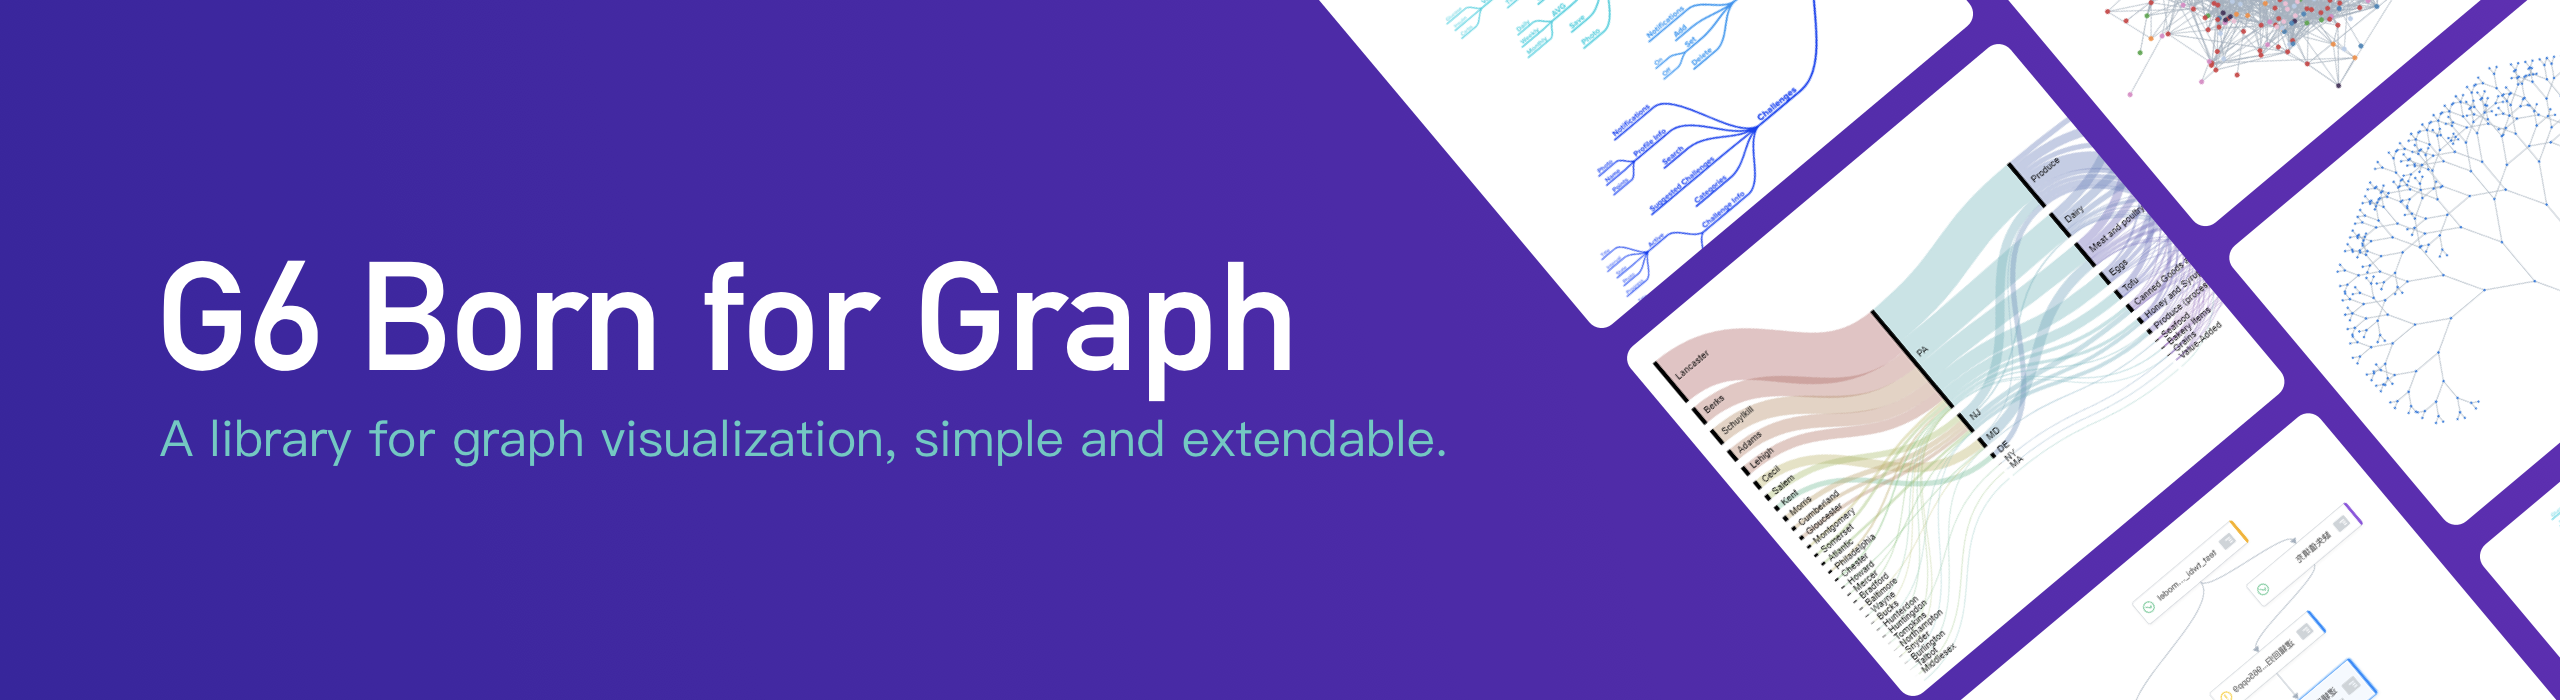
G6
5.0.33
英語| 簡體中文

簡介•示例•快速啟動•API
G6是圖形可視化引擎。它為圖形可視化和分析提供了基本功能,例如繪圖,佈局,分析,交互,動畫,主題和插件。使用G6,用戶可以快速構建自己的圖形可視化和分析應用程序,從而使關係數據簡單,透明且有意義。
G6作為專業圖形可視化引擎,擁有以下功能:
G6通常通過軟件包管理器(例如NPM或紗線)安裝。
$ npm install @antv/g6然後可以從G6導入Graph對象。
< div id =" container " > </ div > import { Graph } from '@antv/g6' ;
// Get the Data.
const data = {
nodes : [
/* your nodes data */
] ,
edges : [
/* your edges data */
] ,
} ;
// Create the Graph instance.
const graph = new Graph ( {
container : 'container' ,
data ,
node : {
palette : {
type : 'group' ,
field : 'cluster' ,
} ,
} ,
layout : {
type : 'force' ,
} ,
behaviors : [ 'drag-canvas' , 'drag-node' ] ,
} ) ;
// Render the Graph.
graph . render ( ) ;一切順利,您可以獲得以下可愛的圖!
對於更多的生態系統開源項目,歡迎捐款。請隨時提交公關以納入。
麻省理工學院。


