AppleTrace
v1.0
AppleTrace是为分析应用程序在iOS上的性能而开发的。
>>我已经开发了一个称为Messier的替代品,它更容易使用。 :)

去维基
git clone https://github.com/everettjf/AppleTrace.git
有关稳定的发布,请参考版本
trace.json中。 (可能有超过1个跟踪文件。)trace.json生成trace.html 。有关更多详细信息,请参见下文。
到目前为止,有两种生成跟踪数据的方法。
(1)手动设置部分。
在方法开始时调用APTBeginSection ,并在方法末尾APTEndSection 。对于目标C方法(无论是实例方法还是类方法),有APTBegin和APTEnd宏可轻松编码。
 void anyKindsOfMethod{
    APTBeginSection("process");
    // some code
    APTEndSection("process");
}

- (void)anyObjectiveCMethod{
    APTBegin;
    // some code
    APTEnd;
}
示例应用程序是sample/ManualSectionDemo 。
(2)动态库将所有OBJC_MSGSEND挂钩。
钩住所有OBJC_MSGSEND方法(基于钩子)。这仅支持Debugger(LLDB)下的ARM64。
样本应用程序是sample/TraceAllMsgDemo 。
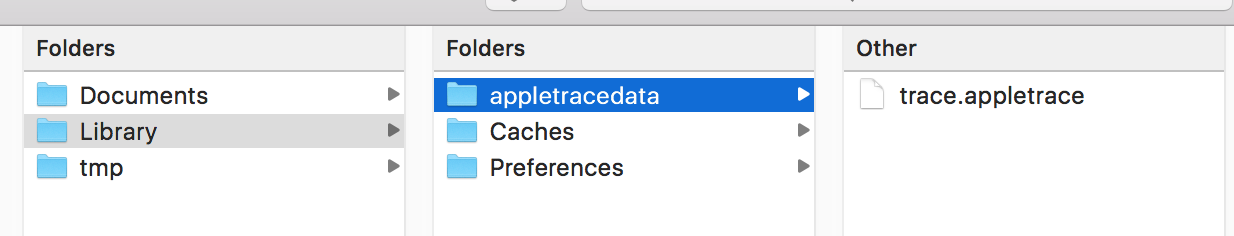
使用任何类型的方法,请将<app's sandbox>/Library/appletracedata复制到模拟器/ReaDevice中。
合并/预处理appletracedata 。
python merge.py -d <appletracedata directory>
这将在AppleTracedata目录中产生trace.json 。
trace.json chrome://tracing或者,如果要生成HTML结果,请继续到第四步。
运行sh get_catapult.sh获取弹射器源。
然后使用catapult生成trace.html 。
 python catapult/tracing/bin/trace2html appletracedata/trace.json --output=appletracedata/trace.html
open trace.html
Trace.html仅支持Chrome
使用Chrome打开sampledata/trace.html 。
欢迎关注微信订阅号,更多有趣的性能优化点点滴滴。,更多有趣的性能优化点点滴滴。