Sales Dashboard Adidas
1.0.0
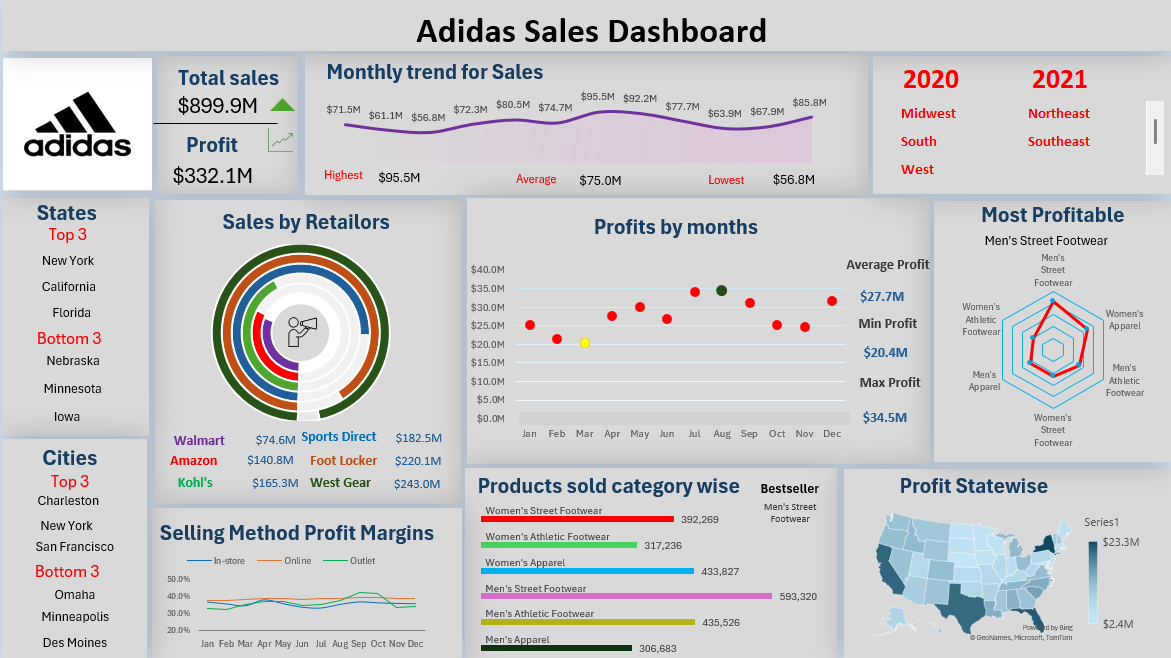
The aim of this project is to analyze adidas sales data and create a dashboard.
There is a decreasing trend in sales as well as profit form the period of April to June for the year 2020.
In comparison to year 2020 there was an increase in profit of about 200 % (But we have to take into consideration that the dataset for 2020 does not include sales revenue from Amazon )"
For year 2021 profit and sales both peaked during the summer months
Best performers amongst sales made by retailors, Foot locker made the highest number of sales in 2021 and West gear for the yeare 2020.
Although these vary if we compares regions for eg. if we see West region in Year 2021 Kohl made the maximum sales whereas Sports direst contributted the most in the South region
Also, sales numbers vary region wise for months like Sep contributes the most if we consider South region but May is the best performer for west region
In terms of selling methods , Maximum profit is generated by selling online for the year 2020 and there is not considerable difference in the yesar 2021
Within regions Online method generates the maximum profit if we only take Northeast region into consideration with New York topping the states among sales and Maine being the least contributor
If we see the sales and products sold in categories Men's street wear is the best performer and Men's apperal being the worst seller products


