hmci
Prometheus support
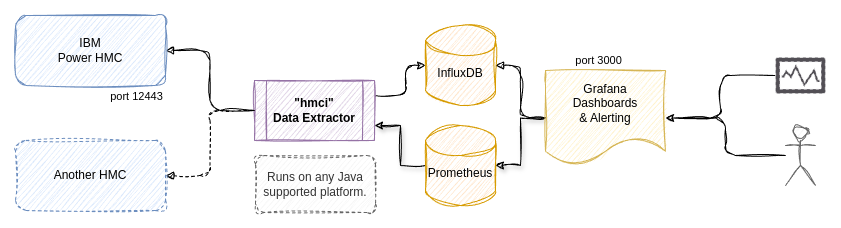
HMCi is a utility that collects metrics from one or more IBM Power Hardware Management Consoles (HMC), without the need to install agents on logical partitions / virtual machines running on the IBM Power systems. The metric data is processed and either saved into an InfluxDB time-series database, and/or made available for Prometheus to scrape. Grafana is used to visualize the metrics data through provided dashboards, or your own customized and improved dashboards.
This software is free to use and is licensed under the Apache 2.0 License, but is not supported or endorsed by International Business Machines (IBM).
Metrics includes:
Some of my other related projects are:
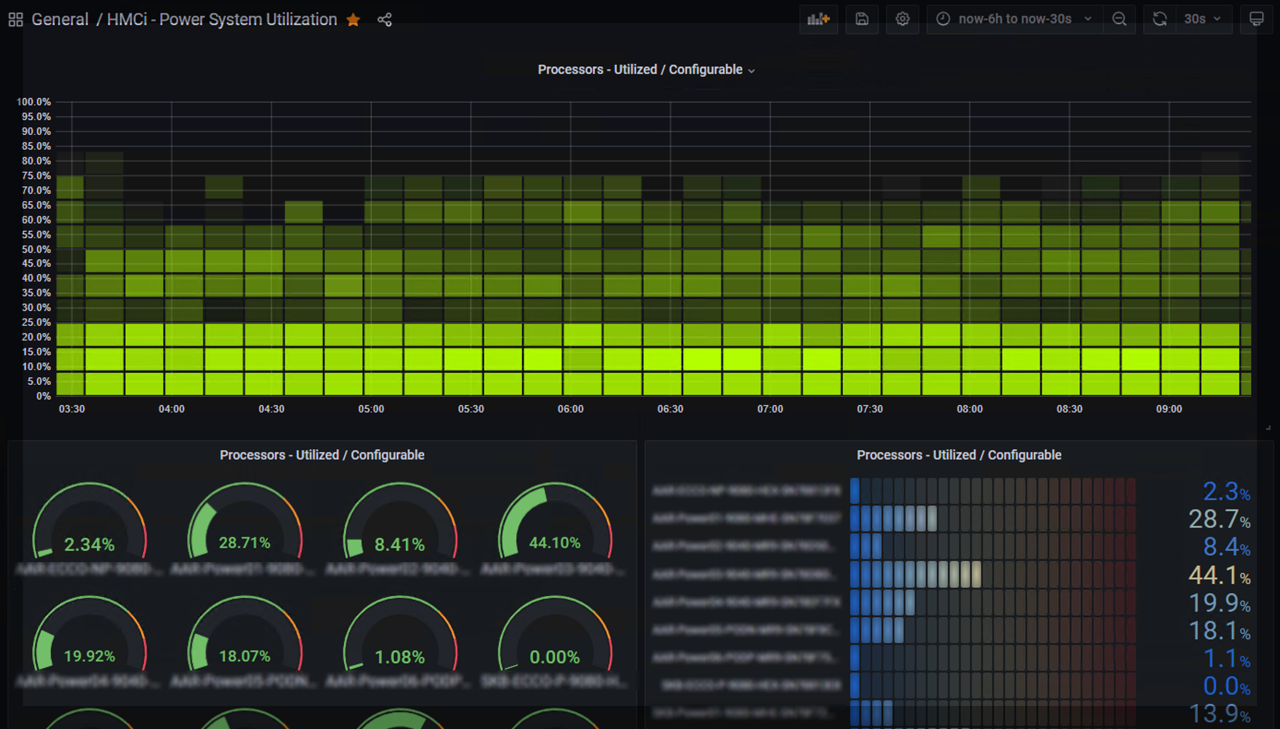
Screenshots of other dashboards are available in the screenshots folder.
There are few steps in the installation.
On the HMC we create a viewer user which are used to fetch data through it's REST API and enable collection of performance metrics.
Read the readme-hmc.md file for instructions and help.
The required software can be installed together on the same LPAR / VM or separately, as long as it's possible to ensure network connectivity.
Depending on your operating system, go through one of the documents:
HMCi packages for Debian/Ubuntu & RedHat/SUSE are available from the release page.
Read the readme-grafana.md file for instructions and help.
This is most likely due to timezone, date and/or NTP not being configured correctly on the HMC and/or host running HMCi.
You can check the timestamp of the most recent data by querying InfluxDB with the influx CLI client, and take note of the timezone when comparing:
use hmci;
precision rfc3339;
SELECT * FROM server_details GROUP BY * ORDER BY DESC LIMIT 1;Edit /opt/hmci/bin/hmci if you need to modify the default JVM heap memory settings.
Example - percentage of availabe memory
-XX:InitialRAMPercentage=25.0 -XX:MaxRAMPercentage=50.0
Example - min / max limits
-Xms64m -Xmx128m
Examples for changing the default InfluxDB retention policy for the hmci database:
ALTER RETENTION POLICY "autogen" ON "hmci" DURATION 156w
ALTER RETENTION POLICY "autogen" ON "hmci" DURATION 90d
On RPM based systems (RedHat, Suse, CentOS), download the latest hmci-x.y.z-n.noarch.rpm file and upgrade:
rpm -Uvh hmci-x.y.z-n.noarch.rpmOn DEB based systems (Debian, Ubuntu and derivatives), download the latest hmci_x.y.z-n_all.deb file and upgrade:
dpkg -i hmci_x.y.z-n_all.debRestart the HMCi service on systemd based Linux systems:
systemctl restart hmci
journalctl -f -u hmci  # to check log output
On AIX you need to pass the --ignoreos flag to the rpm command:
rpm -Uvh --ignoreos hmci-x.y.z-n.noarch.rpmI have not been able to test and verify all types of metric data. If you encounter any missing or wrong data, please contact me and I will try to fix it.
You can't have partitions (or Virtual I/O Servers) on different Systems with the same name, as these cannot be distinguished when metrics are written to InfluxDB (which uses the name as key).
If you rename a partition, the metrics in InfluxDB will still be available by the old name, and new metrics will be available by the new name of the partition. There is no easy way to migrate the old data, but you can delete it easily:
DELETE WHERE lparname = 'name';
You need Java (JDK) version 8 or later to build hmci.
Use the gradle build tool, which will download all required dependencies:
./gradlew clean buildStart a InfluxDB container:
docker run --name=influxdb --rm -d -p 8086:8086 influxdb:1.8Create the hmci database:
docker exec -i influxdb influx -execute "CREATE DATABASE hmci"Start a InfluxDB container:
docker pull docker.io/influxdb:latest
docker run --name=influxdb --rm -d -p 8086:8086 docker.io/influxdb:latestStart a Grafana container, linking it to the InfluxDB container:
docker run --name grafana --link influxdb:influxdb --rm -d -p 3000:3000 grafana/grafanaSetup Grafana to connect to the InfluxDB container by defining a new datasource on URL http://influxdb:8086 named hmci.
If you are connecting to InfluxDB v2.x, then add a custom http header, enter bucket as database and disable authorization.
Import dashboards from the doc/dashboards/ folder.


