data engineering mta turnstile
GCP Deployment
Welcome to the Data Engineering MTA Turnstile project! This repository leverages real-world MTA Turnstile data, offering a comprehensive guide to data engineering concepts through hands-on experience.
Extensive Book: Data Engineering Process Fundamentals. Dive deep into the core concepts of data engineering with this detailed guide.
YouTube Videos: Follow along with detailed video tutorials that explain each step and concept in detail.
Comprehensive Codebase: Our codebase features:
Written by Oscar Garcia
Twitter @ozkary
Use this project Wiki for installation and configuration information
Join this list to receive updates on new content about Data Engineering Sign up here
Follow us on Twitter
Data Engineering Process Fundamental Blog Series
Data Engineering Process Fundamental YouTube Video Podcast
Data Engineering Process Fundamental Book on Amazon
If you find this project useful, please consider giving it a ️ on GitHub! Your support helps us grow and reach more developers.
Why Star This Project?
Thank you for your support! ?
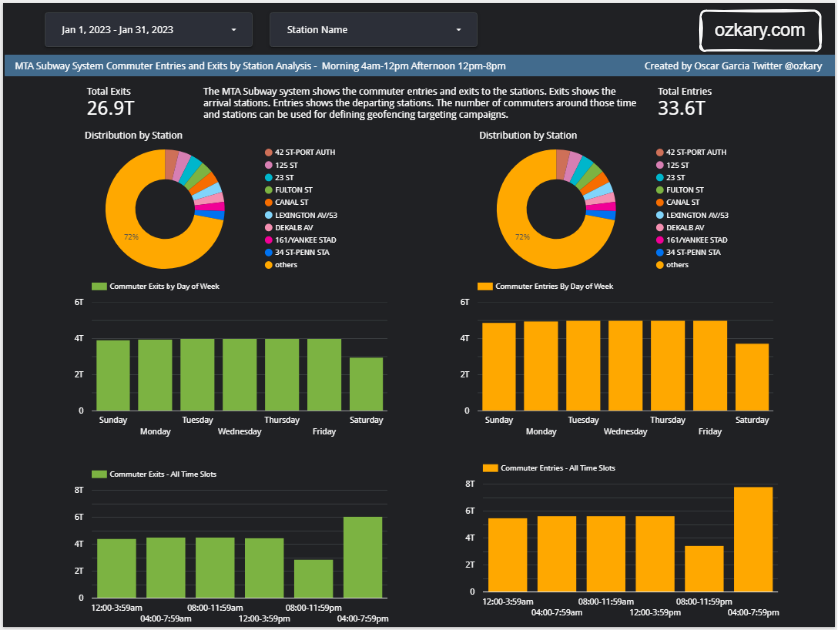
In the city of New York, commuters use the Metropolitan Transportation Authority (MTA) subway system for transportation. There are millions of people that use this system every day; therefore, businesses around the subway stations would like to be able to use Geofencing advertisement to target those commuters or possible consumers and attract them to their business locations at peak hours of the day.
Geofencing is a location based technology service in which mobile devices’ electronic signal is tracked as it enters or leaves a virtual boundary (geo-fence) on a geographical location. Businesses around those locations would like to use this technology to increase their sales.

The MTA subway system has stations around the city. All the stations are equipped with turnstiles or gates which tracks as each person enters or leaves the station. MTA provides this information in CSV files, which can be imported into a data warehouse to enable the analytical process to identify patterns that can enable these businesses to understand how to best target consumers.
We are using the MTA Turnstile data for 2023. Using this data, we can investigate the following criteria:
Exits indicates that commuters are arriving to those locations. Entries indicate that commuters are departing from those locations.
The data can be grouped into stations, date and time of the day. This data is audited in blocks of fours hours apart. This means that there are intervals of 8am to 12pm as an example. We analyze the data into those time block intervals to help us identify the best times both in the morning and afternoon for each station location. This should allow businesses to target a particular geo-fence that is close to their business.
https://lookerstudio.google.com/reporting/94749e6b-2a1f-4b41-aff6-35c6c33f401e
By looking at the dashboard, the following conclusions can be observed:
With these observations, plans can be made to optimize the marketing campaigns and target users around a geo-fence area and hours of the day with proximity to the corresponding business locations.
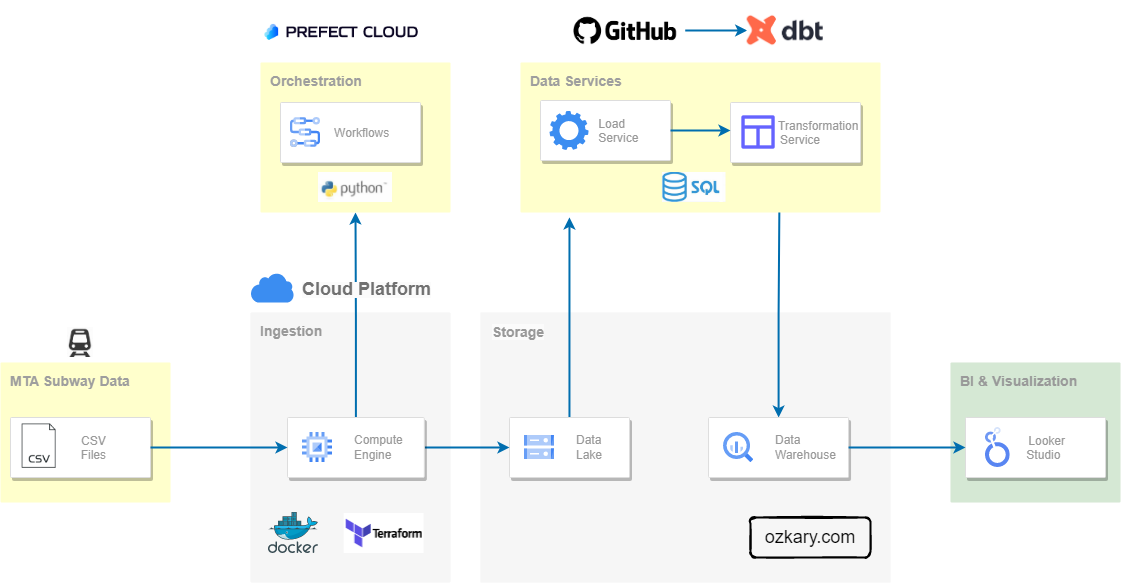
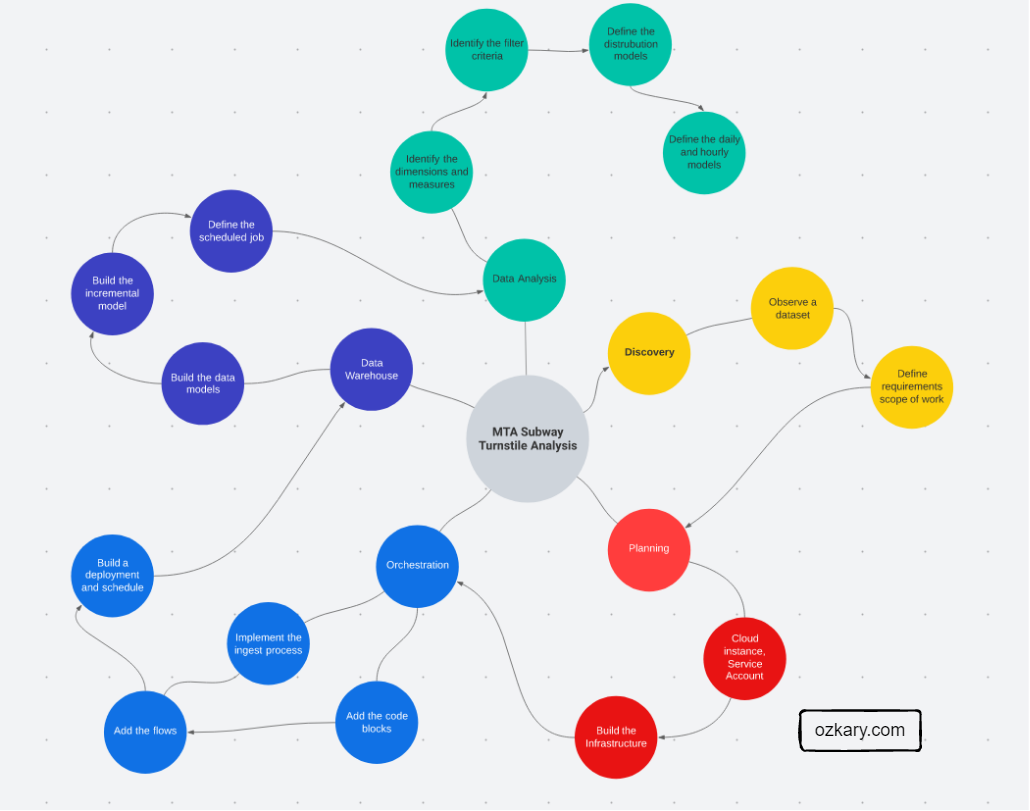
This project was executed following this process. The details for each of these steps can be found in this project subdirectories.
Note: Follow each link for more details
The following technologies have been used for this project:


