node_profiling_example
1.0.0
Example of using the built-in nodejs profiler. I didn't improve performance, but I learned some stuff.
Building a full-text search index of text files on a local filesystem, using lunr. It currently takes about 3 seconds to index 1000 files.
./profile.sh
This outputs a file profile_output.txt. See the 'Reading the nodejs profiler
output' section below for how to interpret this file.
We can see that 81% of process time is spent in 'shared libraries', 77/81 of that being node.exe:
 [Summary]:
   ticks  total  nonlib   name
    315   18.6%   96.6%  JavaScript
      0    0.0%    0.0%  C++
     80    4.7%   24.5%  GC
   1369   80.8%          Shared libraries
     11    0.6%          Unaccounted

 [Shared libraries]:
   ticks  total  nonlib   name
   1303   76.9%          C:Program Filesnodejsnode.exe
     65    3.8%          C:WINDOWSSYSTEM32ntdll.dll
      1    0.1%          C:WINDOWSSystem32KERNEL32.DLL
Using this online profile visualiser, it seems that most of the calls to node are due to builder.add, which is a little confusing. I think this may be due to the async readfile calling add, which is 'blaming' builder.add for the time spent reading files from the filesystem. Let's separate the two operations.
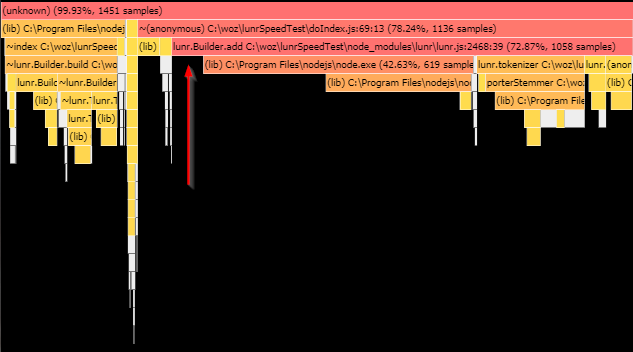
It turns out that reading files is very fast. The majority of the app time is spent in builder.add. However, builder.add calls node.exe, beyond which we get no information.
Is spy-js useful? I tried it for a few minutes, and could only really get it to tell me 'yes, builder.add is called a lot'.
Is there a way to see more about what in node is being called? And by what?
The default profiler is a sampling profiler, which means it records the current instruction pointer at certain intervals.
There are a number of tools, here's a handy online one:
https://mapbox.github.io/flamebearer/# Drag the profile_output.json file into
that site to visualise the profiler data.


