gatotray
1.0.0
gatotray is a tiny CPU monitor displaying several stats graphically
(usage, temperature, frequency) in small space, and tight on resources.
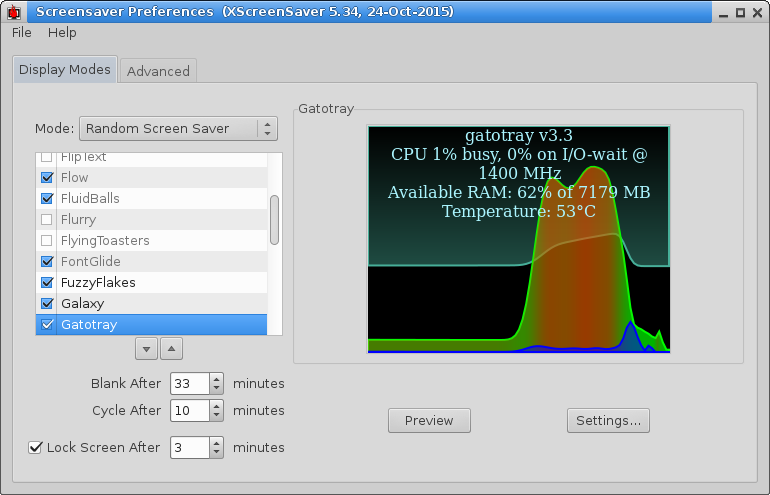
Since version 3.0, It can also run as a screensaver.
(c) 2011-2020 by gatopeich, licensed under a Creative Commons Attribution 3.0 Unported License: http://creativecommons.org/licenses/by/3.0/ Briefly: Use it however suits you better and just give me due credit.
Requires GTK2 libraries and procps: sudo apt install libgtk2.0-dev libprocps-dev
Very lightweight, colourful, user friendly, broadly compatible.
Tracks top consuming processes.
Designed to run continuously in small screen space to provide good idea of the CPU's status in a glimpse.
Can run as a xscreensaver plugin, so you can see your CPUs at work from a
prudential distance.
Works in almost any Linux desktop, as long as it is Freedesktop compatible: XFCE, GNOME, GTK+, KDE, and more.
Logarithmic time scale tells a long story in very small space.
Thermometer graph, blinks when temperature reaches a configurable threshold.
Tooltip shows a textual summary of system status.
On click, it opens a customizable top window for detailed system usage.
Easy customization of colors and options, including transparency.
(Outdated info but the same principle still applies)
gatotray aims to be a reliable and lightweight application, suitable for usage in the most resource constrained systems. Here are some measures comparing different versions running on:
After 7 hours this is a pretty version of what we get with the command "ps -o bsdtime,rss,etime,pid,command -C gatotray|sort -n".
CPU%  CPUtime    RSS  ElapsedTime  Version and options:
0.17     0:45   6984     07:11:57  gatotray v2.0 64 bits opaque 21x21
0.19     0:48   7464     07:11:14  gatotray v2.0 64 bits transparent 21x21
0.19     0:49   6176     07:10:13  gatotray v2.0 32 bits opaque 21x21
0.21     0:54   6560     07:09:48  gatotray v2.0 32 bits transparent 21x21
So gatotray v2.0 eats roughly less than 6 bogomips in its several configurations , transparency costing ~10% additional CPU, and running the 32 bit version saving a bit under 1MB RSS memory.
Here is the "watchRSS" script used to produce the data above:
#!sh

#!/bin/bash
$@ &
pid=$!
while watch="`ps -o bsdtime $pid` `grep RSS /proc/$pid/status`"; do
	[ "$watch" != "$old" ] && echo `ps -o etime $pid` CPU$watch
	old="$watch"
	sleep .1
done


