jvmm
2.4.3

JVMM (JVM Monitor) is a tool that provides service-based monitoring of Java virtual machines and operating systems. It has rich data acquisition functions: OS (memory, CPU, disk status and IO, network card status and IO, etc.), JVM (memory, thread, thread pool, memory pool, GC, class loader, etc.), and also provides functions such as generating flame diagrams, hot updates of Java code, decompilation, etc. Suitable for use in scenarios such as service health monitoring, program tuning, problem investigation, performance testing, etc.
Please go to releases to download the latest version of jvmm and unzip it
Tips: Some functions of Jvmm depend on jdk in the local environment. Please make sure that you install jdk instead of just jre in your environment. Simple verification: execute
jps -lin your environment. If it can be executed normally and output the result, it means that the environment is OK, otherwise Jvmm may not be able to run.
First, execute the following command to generate the service jar package
java -jar jvmm.jar -m jar -sThen start the server, please pay attention to your jdk version when starting
 # 启动server,jdk 8使用下面命令
java -jar jvmm-server.jar

# jdk 9+ 为确保成功运行建议使用下面命令
java -jar --add-opens java.base/jdk.internal.loader=ALL-UNNAMED
          --add-opens jdk.zipfs/jdk.nio.zipfs=ALL-UNNAMED
          --add-opens java.base/java.net=ALL-UNNAMED
          --add-opens java.management/sun.management=ALL-UNNAMED
          jvmm-server.jar
If the Jvmm Server is successfully started, it will run on port 5010 by default, and then you need to set up a new window in the current directory to execute:
java -jar jvmm.jar -m client -a 127.0.0.1:5010 If the server connection is successful, you will enter client mode. You can enter the following command to collect process data. Of course, you can enter help to view the usage of all executable instructions in this mode.
info -t processHere are examples of data collected in Jvmm client mode. The functions provided by Jvmm are much more than that. For more functions, please read the Jvmm usage documentation.
Jvmm's core data acquisition function is in the core module, and the service-oriented function is in the server module. According to your usage scenario, you can choose the following two usage methods:
core module (more functions) First of all, you need to understand what server can do? Server provides three service modes. Before using it, which one you need to choose is more suitable for you. Here are the three service modes:
Any service mode is inseparable from the configuration file jvmm.yml. server.type is used to configure which mode or which mode you choose. They can run at the same time . The specific configurations of each mode correspond to server.jvmm , server.http , and server.sentinel .
 server :
  type : jvmm,http,sentinel  # 支持同时开启多种模式
  jvmm :
    # ...
  http :
    # ...
  sentinel :
# ...For the default configuration, see jvmm.yml, and for the configuration information, see the comments in the configuration file.
Jvmm provides four ways to start your server:
-javaagent parameter)jvmm-server.jar directly (decompilation and code hot update functions do not support)Notice! ! !
No matter which way you start the Server, if your running environment is jdk 9+ or above, it is recommended to add the following JVM parameters at startup to ensure successful operation.
--add-opens java.base/jdk.internal.loader=ALL-UNNAMED
--add-opens jdk.zipfs/jdk.nio.zipfs=ALL-UNNAMED
--add-opens java.base/java.net=ALL-UNNAMED
--add-opens java.management/sun.management=ALL-UNNAMED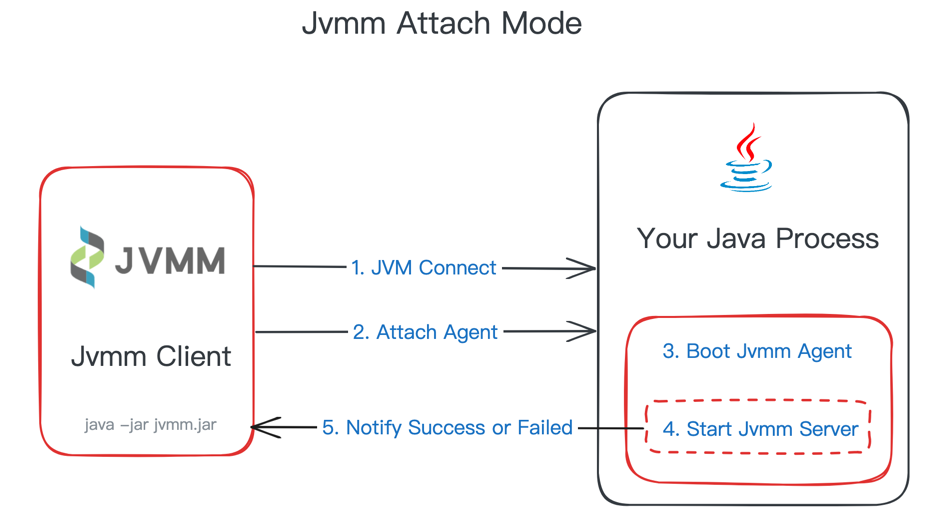
Run jvmm.jar and select attach mode
java -jar jvmm.jar -m attach -c ./jvmm.ymlThen you will be prompted to select the number of the target process. After selecting, the server will be started in the target process.
If you already know the pid of the target process, you can specify it directly:
java -jar jvmm.jar -m attach -c ./jvmm.yml -pid 80080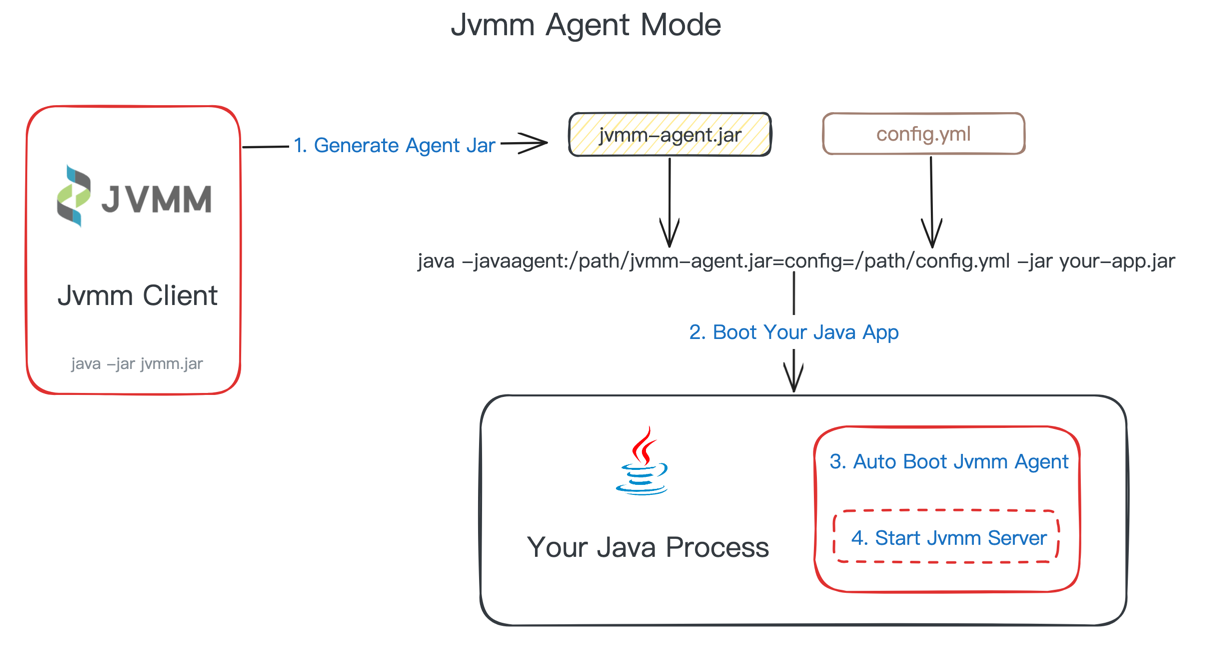
In Java Agent method, you need to create the required jar package and use the -a parameter to specify the generation agent :
 # 如果你的宿主程序中包含了 SLF4J 的实现(例如 logback),需要在生成时使用 -e 参数排除掉jvmm自带的 slf4j 实现
java -jar jvmm.jar -m jar -a -e logger

# 如果你的宿主程序中没有 SLF4J 的实现,无需排除 logger
java -jar jvmm.jar -m jar -a
After execution, the corresponding file will be generated in the same level directory: jvmm-agent.jar , and then -javaagent parameter is added when starting the target program (assuming it is app.jar). The format is as follows:
java -javaagent:<jvmm-agent.jar路径>=config=<jvmm.yml路径> -jar your-app.jar
For example:
java -javaagent:/path/jvmm-agent.jar=config=/path/jvmm.yml -jar app.jarTo be compatible with the functionality of using external servers, the complete javaagent format is:
-javaagent:<jvmm-agent.jar路径>=server=<jvmm-server.jar路径>;config=<jvmm.yml路径>
When your program starts, Jvmm will start as an Agent
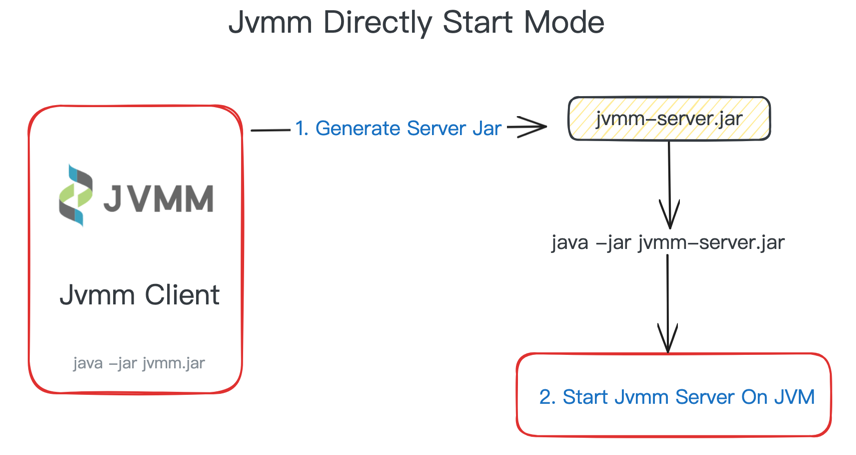
If you don't want to be attached to any host program, you can choose to start a Jvmm server separately, such as in the scenario of monitoring a physical machine.
First, you need to generate the started jar dependency and use the -s parameter to specify the generation server :
java -jar jvmm.jar -s After the execution is completed, a jvmm-server.jar will be generated in the same directory, and then the server will be started. Please pay attention to your jdk version when starting.
 # 启动server,jdk 8使用下面命令
java -jar jvmm-server.jar

# jdk 9+ 为确保成功运行建议使用下面命令
java -jar --add-opens java.base/jdk.internal.loader=ALL-UNNAMED
          --add-opens jdk.zipfs/jdk.nio.zipfs=ALL-UNNAMED
          --add-opens java.base/java.net=ALL-UNNAMED
          --add-opens java.management/sun.management=ALL-UNNAMED
jvmm-server.jarIf you want to use server in your project, you need to first introduce maven dependencies
< dependencies >
  < dependency >
    < groupId >io.github.tzfun.jvmm</ groupId >
    < artifactId >jvmm-server</ artifactId >
    < version >${jvmm-version}</ version >
  </ dependency >

<!-- jvmm日志依赖,如果你的项目中有 SLF4J、Log4J2、Log4J中任意一个依赖,可以去掉此依赖 -->
  < dependency >
    < groupId >io.github.tzfun.jvmm</ groupId >
    < artifactId >jvmm-logger</ artifactId >
    < version >${jvmm-version}</ version >
  </ dependency >
</ dependencies >
Start server with one line of code
 import org . beifengtz . jvmm . server . ServerBootstrap ;

public class Jvmm {
  public static void main ( String [] args ) {
    ServerBootstrap . getInstance (). start ();
  }
}
Of course, the above startup method will use the default configuration, and generally requires custom configuration. getInstance method can pass into an org.beifengtz.jvmm.server.entity.conf.Configuration object. Custom configuration can be implemented by constructing Configuration.
Connect Jvmm Server ServerConveyDemo.java using JvmmConnector
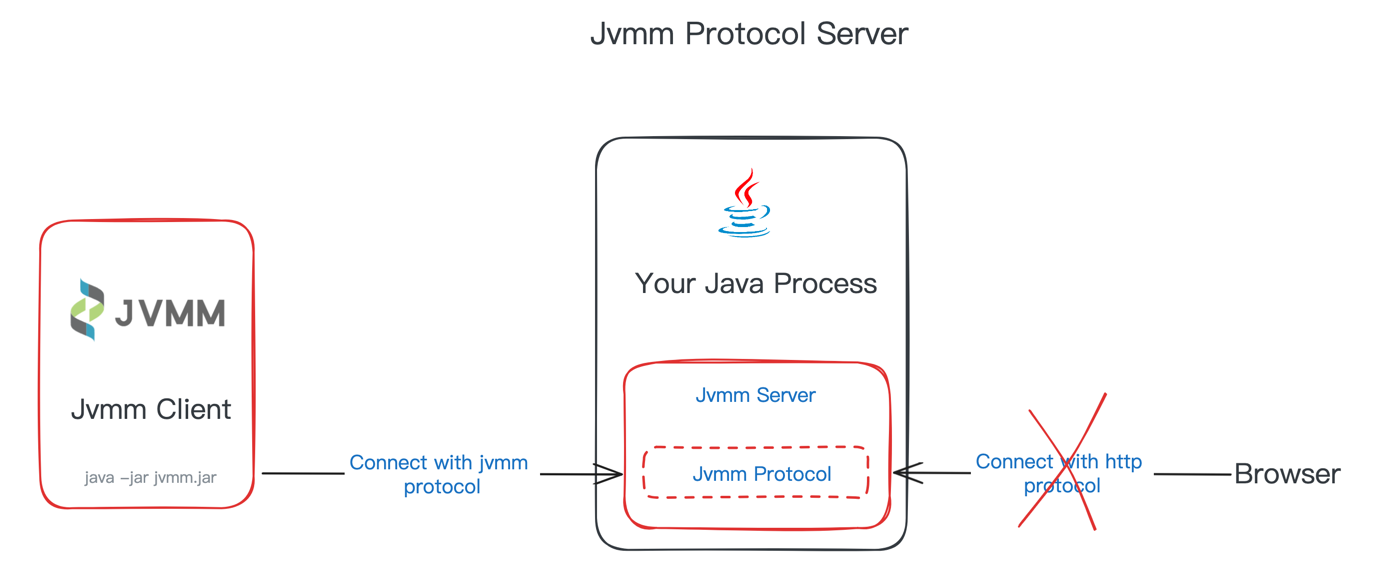
When the server is started in jvmm or http mode, you can remotely call the built-in interface.
Jvmm Service provides the following API interfaces:
| Type | Data | Description |
|---|---|---|
| JVMM_COLLECT_SYS_INFO | / | Collect operating system information |
| JVMM_COLLECT_SYS_MEMORY_INFO | / | Collect operating system memory data |
| JVMM_COLLECT_SYS_FILE_INFO | / | Collect operating system disk partition usage data |
| JVMM_COLLECT_PROCESS_INFO | / | Collect current process data |
| JVMM_COLLECT_DISK_INFO | / | Collect physical machine disk data |
| JVMM_COLLECT_DISK_IO_INFO | / | Collect disk IO and throughput data of physical machine |
| JVMM_COLLECT_CPU_INFO | / | Collect CPU load data of physical machine |
| JVMM_COLLECT_NETWORK_INFO | / | Collect physical machine network card information and IO data |
| JVMM_COLLECT_PORT_STATUS | JsonArray, whose element is port number | Collect physical machine port usage |
| JVMM_COLLECT_JVM_CLASSLOADING_INFO | / | Collect JVM class loading information |
| JVMM_COLLECT_JVM_CLASSLOADER_INFO | / | Collect JVM class loader information |
| JVMM_COLLECT_JVM_COMPILATION_INFO | / | Collect JVM compilation information |
| JVMM_COLLECT_JVM_GC_INFO | / | Collect JVM garbage collector information |
| JVMM_COLLECT_JVM_MEMORY_MANAGER_INFO | / | Gather JVM memory manager information |
| JVMM_COLLECT_JVM_MEMORY_POOL_INFO | / | Collect JVM memory pool information |
| JVMM_COLLECT_JVM_MEMORY_INFO | / | Collect JVM memory usage |
| JVMM_COLLECT_JVM_THREAD_INFO | / | Collect JVM thread statistics |
| JVMM_COLLECT_JVM_THREAD_STACK | See ThreadInfoDTO | Collect the specified JVM thread stack data |
| JVMM_COLLECT_JVM_THREAD_DETAIL | JsonArray, whose element is thread ID | Collect JVM thread details (CPU Time, Block Time, Locks, etc.) |
| JVMM_COLLECT_JVM_THREAD_POOL | JsonObject, its properties are: classLoaderHash(String), clazz(String), instanceField(String), field(String) | Collect JVM thread pool information |
| JVMM_COLLECT_JVM_THREAD_ORDERED_CPU_TIME | JsonObject, its properties are: type(String, stack|info), durationSeconds(int) | Acquisition of CPU usage in JVM threads within a certain time |
| JVMM_COLLECT_JVM_DUMP_THREAD | / | dump all thread stack data |
| JVMM_COLLECT_BATCH | CollectionType[] | Data collection in batches based on options |
| JVMM_EXECUTE_GC | / | Execute gc |
| JVMM_EXECUTE_JAVA_PROCESS | / | List all Java processes |
| JVMM_EXECUTE_JVM_TOOL | String | Execute the jvm tool command |
| JVMM_EXECUTE_JAD | JsonObject, its properties are: className(String), methodName(String) | Code decompilation (only agents are supported) |
| JVMM_EXECUTE_LOAD_PATCH | JsonArray, whose element is PatchDTO | Code hot updates. When specifying the hash of ClassLoader, it is only hot updates for changing the class loaded by ClassLoader. |
| JVMM_EXECUTE_SWITCHES_GET | / | Get the acquisition switch information |
| JVMM_EXECUTE_SWITCHES_SET | JsonObject, its properties are: names(Switches[]), open(boolean) | Set up the acquisition switch |
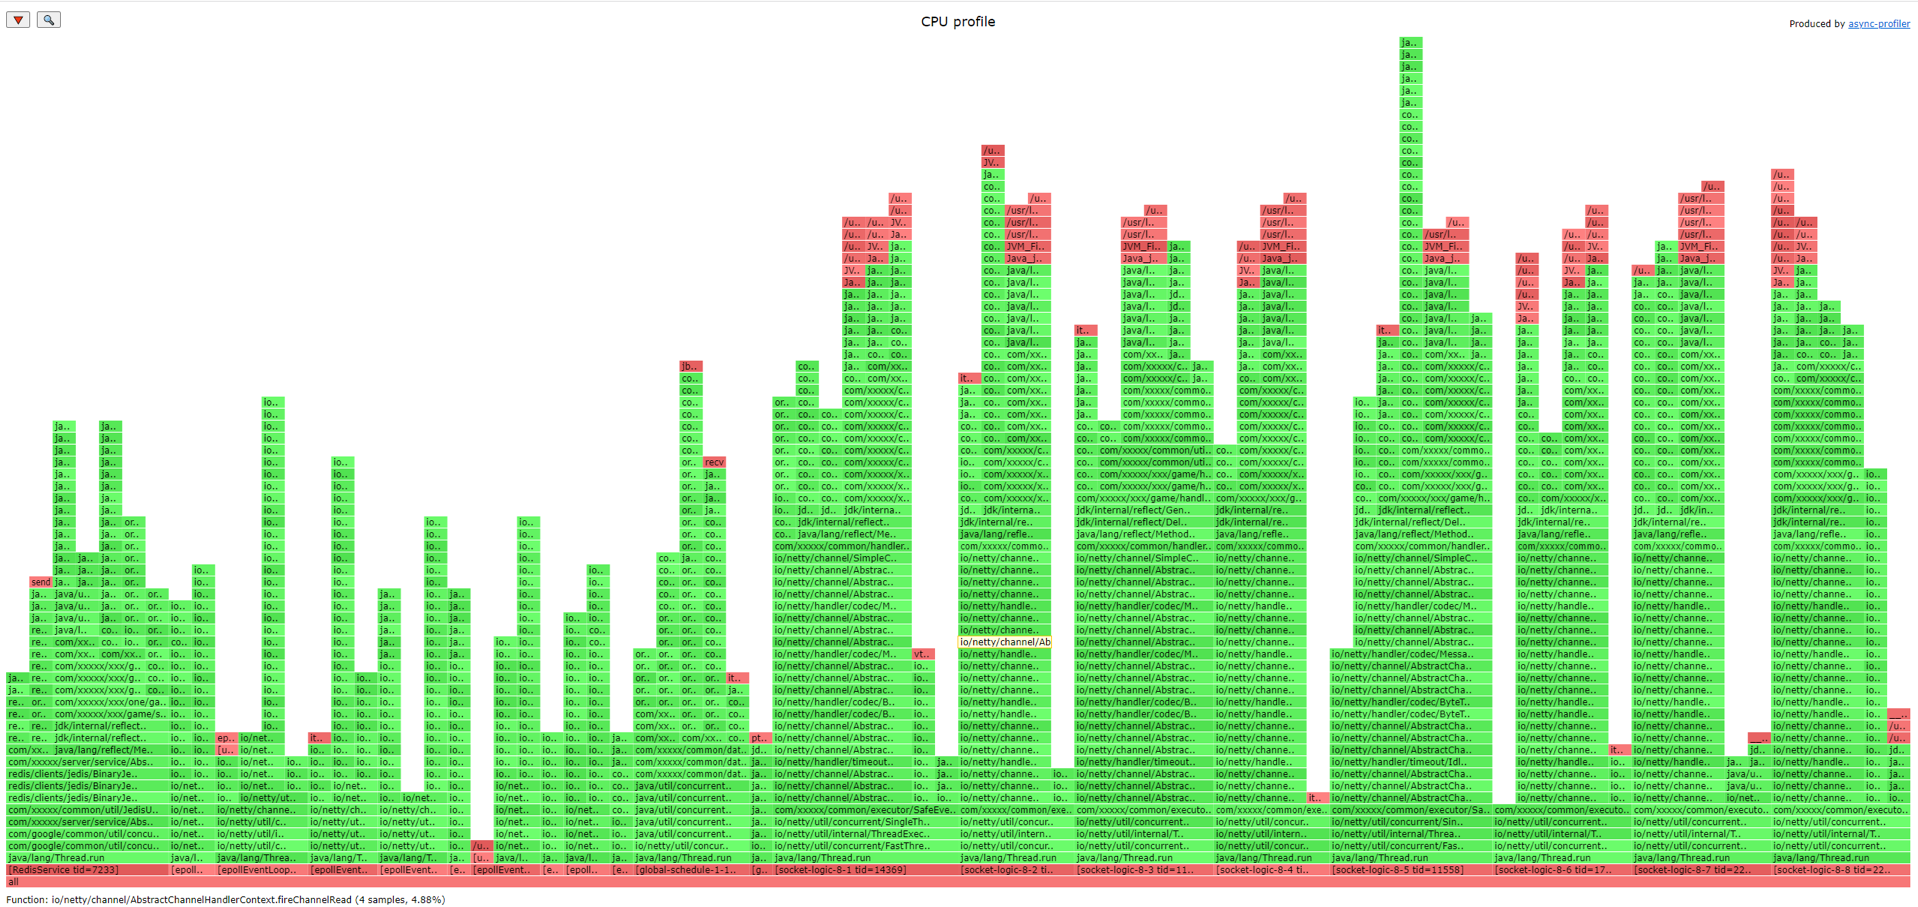
| JVMM_PROFILER_SAMPLE | See ProfilerSampleDTO | Generate flame map |
| JVMM_PROFILER_EXECUTE | String | Execute the profiler command, see async-profiler |
| JVMM_PROFILER_START | See ProfilerSampleDTO, where only eventcounterinteval field is valid | Execute the profiler start sampling command |
| JVMM_PROFILER_STOP | String, format field in ProfilerSampleDTO, optional value is htmltxtjfr | Execute the profiler to end sampling and export file command |
| JVMM_PROFILER_STATUS | / | Get the current profiler status |
| JVMM_PROFILER_LIST_EVENTS | / | Get the profiler events supported by the current environment |
| JVMM_SERVER_SHUTDOWN | String | Close the service, data is the service type |
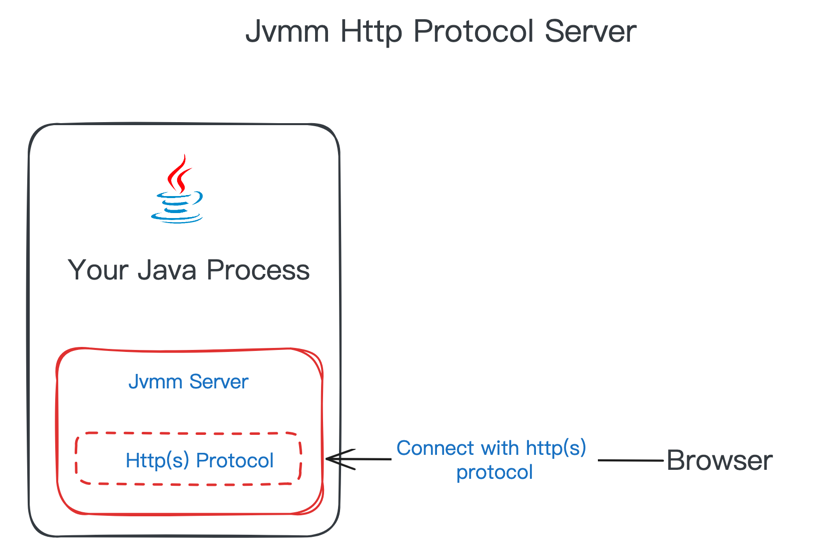
Http Service provides the following API interfaces:
| Uri | method | parameter | Body | describe |
|---|---|---|---|---|
| /collect/process | GET | / | / | Collect process information |
| /collect/disk | GET | / | / | Collect physical machine disk data |
| /collect/disk_io | GET | / | / | Collect disk IO and throughput data of physical machine |
| /collect/cpu | GET | / | / | Collect CPU load data of physical machine |
| /collect/network | GET | / | / | Collect physical machine network card information and IO data |
| /collect/sys | GET | / | / | Collect operating system information |
| /collect/sys/memory | GET | / | / | Collect operating system memory data |
| /collect/sys/file | GET | / | / | Collect operating system disk partition usage data |
| /collect/port | GET | ports(int[]) | / | Acquisition of operating system port occupation |
| /collect/jvm/classloading | GET | / | / | Collect JVM class loading information |
| /collect/jvm/classloader | GET | / | / | Collect JVM class loader information |
| /collect/jvm/compilation | GET | / | / | Collect JVM compilation information |
| /collect/jvm/gc | GET | / | / | Collect JVM garbage collector information |
| /collect/jvm/memory_manager | GET | / | / | Gather JVM memory manager information |
| /collect/jvm/memory_pool | GET | / | / | Collect JVM memory pool information |
| /collect/jvm/memory | GET | / | / | Collect JVM memory usage |
| /collect/jvm/thread | GET | / | / | Collect JVM thread statistics |
| /collect/jvm/thread_stack | POST | / | See ThreadInfoDTO | Collect the specified JVM thread stack data |
| /collect/jvm/dump_thread | GET | / | / | dump all thread stack data |
| /collect/jvm/thread_ordered_cpu_time | GET | type(String, stack|info), durationSeconds(int) | / | Acquisition of CPU usage in JVM threads within a certain time |
| /collect/jvm/thread_detail | GET | id(long[]) | / | Collect JVM thread details (CPU Time, Block Time, Locks, etc.) |
| /collect/jvm/thread_pool | GET | classLoaderHash(String), clazz(String), instanceField(String), field(String) | / | Collect JVM thread pool information |
| /collect/by_options | GET | options(CollectionType[]) | Data collection in batches based on options | |
| /execute/gc | GET | / | / | Execute gc |
| /execute/jps | GET | / | / | List all Java processes |
| /execute/jvm_tool | POST | / | command(String) | Execute the jvm tool command |
| /execute/jad | GET | className(String), methodName(String) | / | Code decompilation (only agents are supported) |
| /execute/load_patch | POST | / | JsonArray, whose element is PatchDTO | Code hot updates. When specifying the hash of ClassLoader, it is only hot updates for changing the class loaded by ClassLoader. |
| /execute/get_switches | GET | / | / | Get the acquisition switch information |
| /execute/set_switches | GET | names(Switches[]), open(boolean) | / | Set up the acquisition switch |
| /profiler/flame_graph | POST | / | See ProfilerSampleDTO | Generate flame map |
| /profiler/start | POST | / | See ProfilerSampleDTO, where only eventcounterinteval field is valid | Execute the profiler start sampling command |
| /profiler/stop | POST | / | String, format field in ProfilerSampleDTO, optional value is htmltxtjfr | Execute the profiler to end sampling and export file command |
| /profiler/status | GET | / | / | Get the current profiler status |
| /profiler/list_events | GET | / | / | Get the profiler events supported by the current environment |
| /profiler/execute | POST | / | command(String) | Execute the profiler command, see async-profiler |
| /server/shutdown | GET | target(String) | / | Close the service, data is the service type |
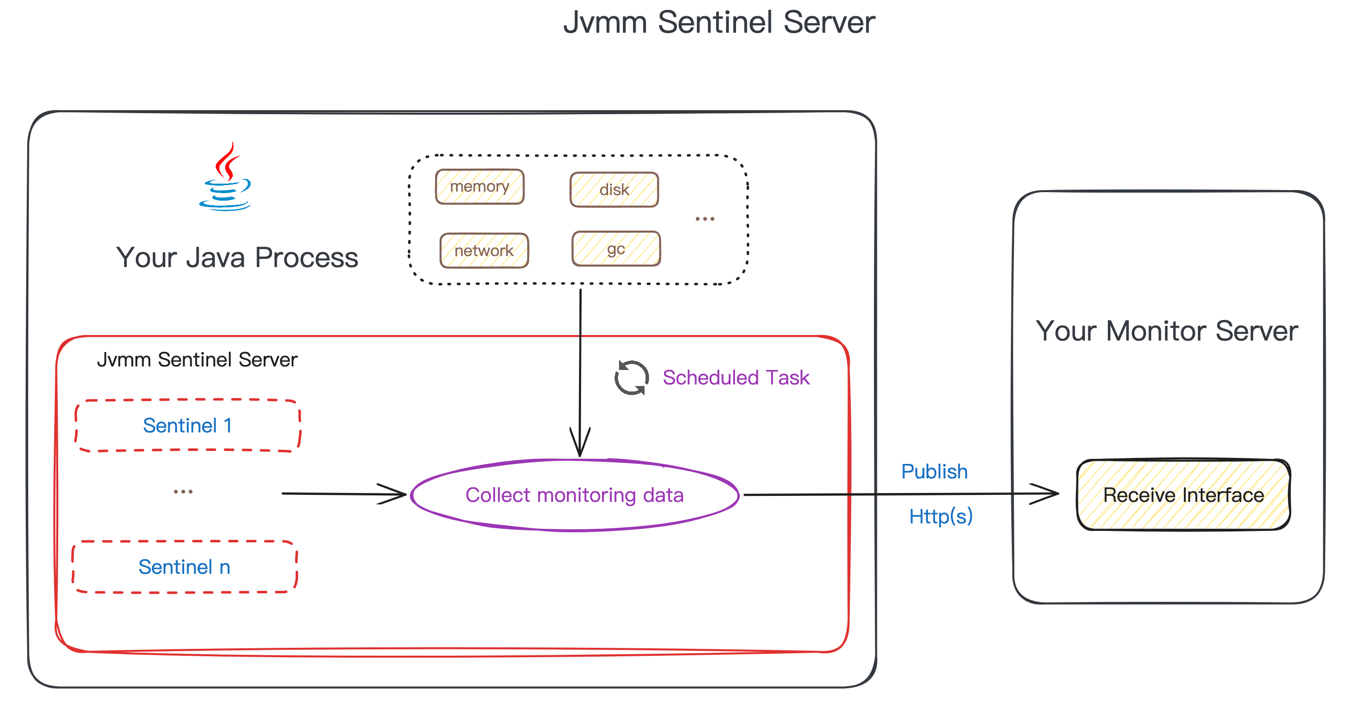
The operating logic of Sentinel mode is to regularly collect specified data items and then push them to subscribers . You need to provide a subscription service (http interface) that can receive data. If the interface access requires identity authentication, the subscriber Http interface currently only supports Basic authentication.
Sentinel mode configuration
 server :
  type : sentinel
  sentinel :
    - subscribers :
      # publish jvmm data to custom http server
      - type : http
        url : http://127.0.0.1:9999/monitor/subscriber
        auth :
          enable : true
          username : 123456
          password : 123456
      # publish jvmm data to prometheus
      - type : prometheus
        url : http://127.0.0.1:9090/api/v1/write
        auth :
          enable : true
          username : 123456
          password : 123456
      interval : 15
      tasks :
      - process
      - disk
      - disk_io
      - cpu
      - port
...A total of the following collection items are supported:
[
  " process " ,
  " disk " ,
  " disk_io " ,
  " cpu " ,
  " network " ,
  " sys " ,
  " sys_memory " ,
  " sys_file " ,
  " port " ,
  " jvm_classloading " ,
  " jvm_classloader " ,
  " jvm_compilation " ,
  " jvm_gc " ,
  " jvm_memory " ,
  " jvm_memory_manager " ,
  " jvm_memory_pool " ,
  " jvm_thread " ,
  " jvm_thread_stack " ,
  " jvm_thread_detail " ,
  " jvmm_thread_pool "
]Currently only the following collection items support Prometheus
[
" process " ,
" disk_io " ,
" cpu " ,
" network " ,
" sys " ,
" sys_memory " ,
" sys_file " ,
" jvm_classloading " ,
" jvm_compilation " ,
" jvm_gc " ,
" jvm_memory " ,
" jvm_memory_pool " ,
" jvm_thread "
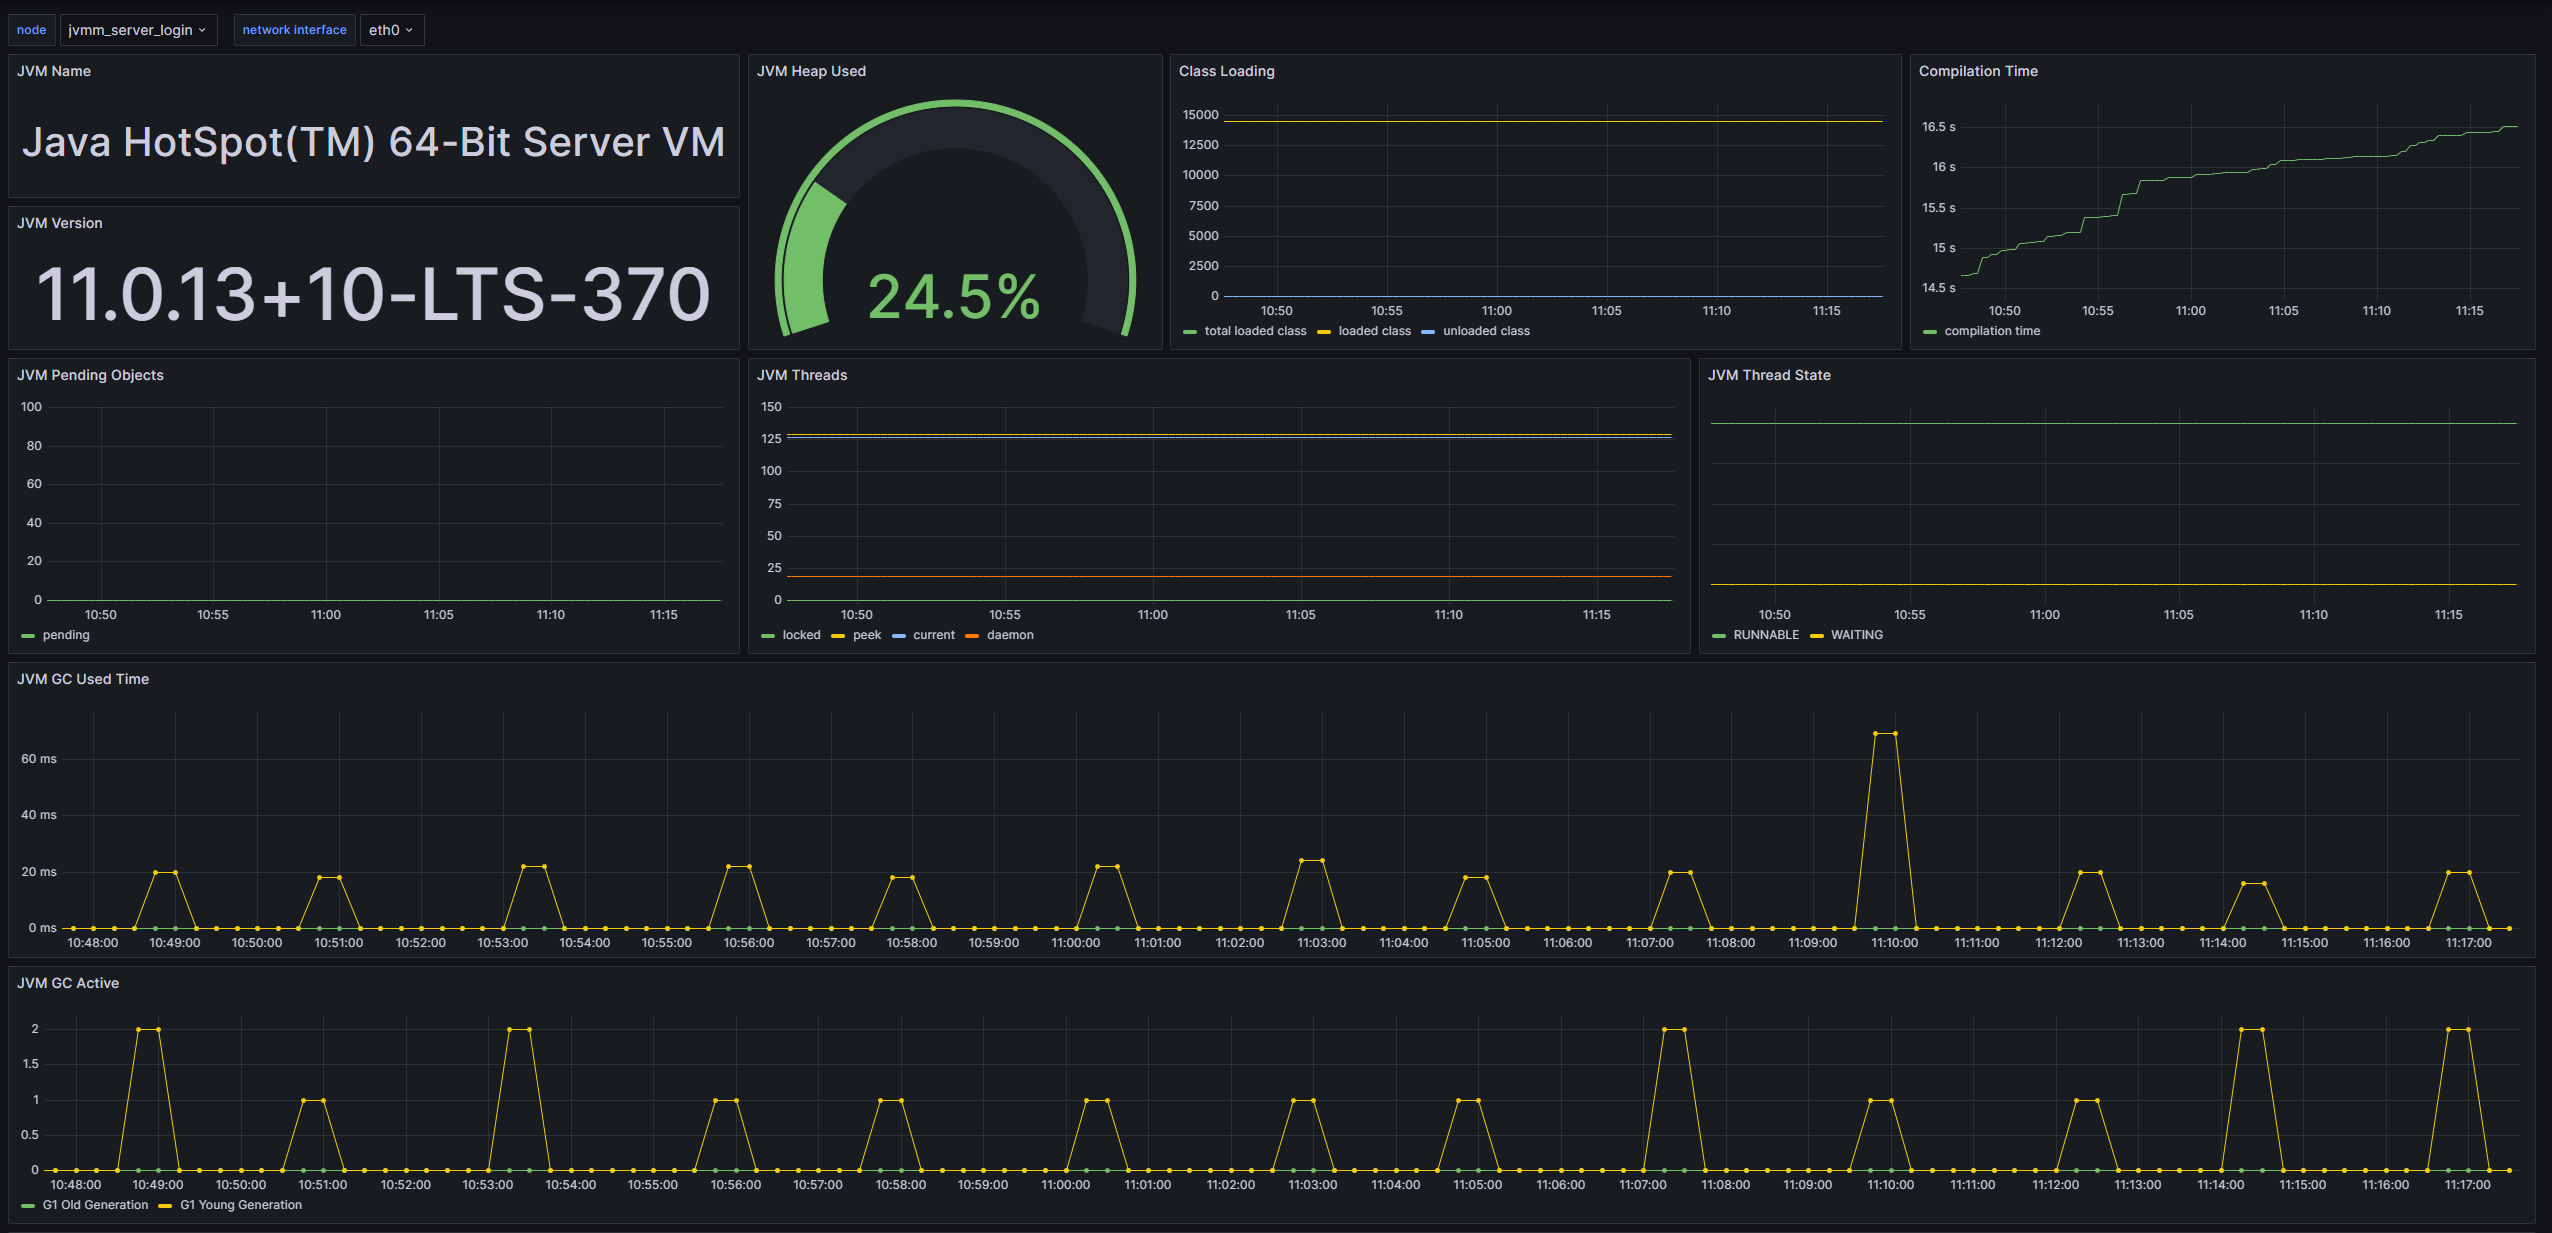
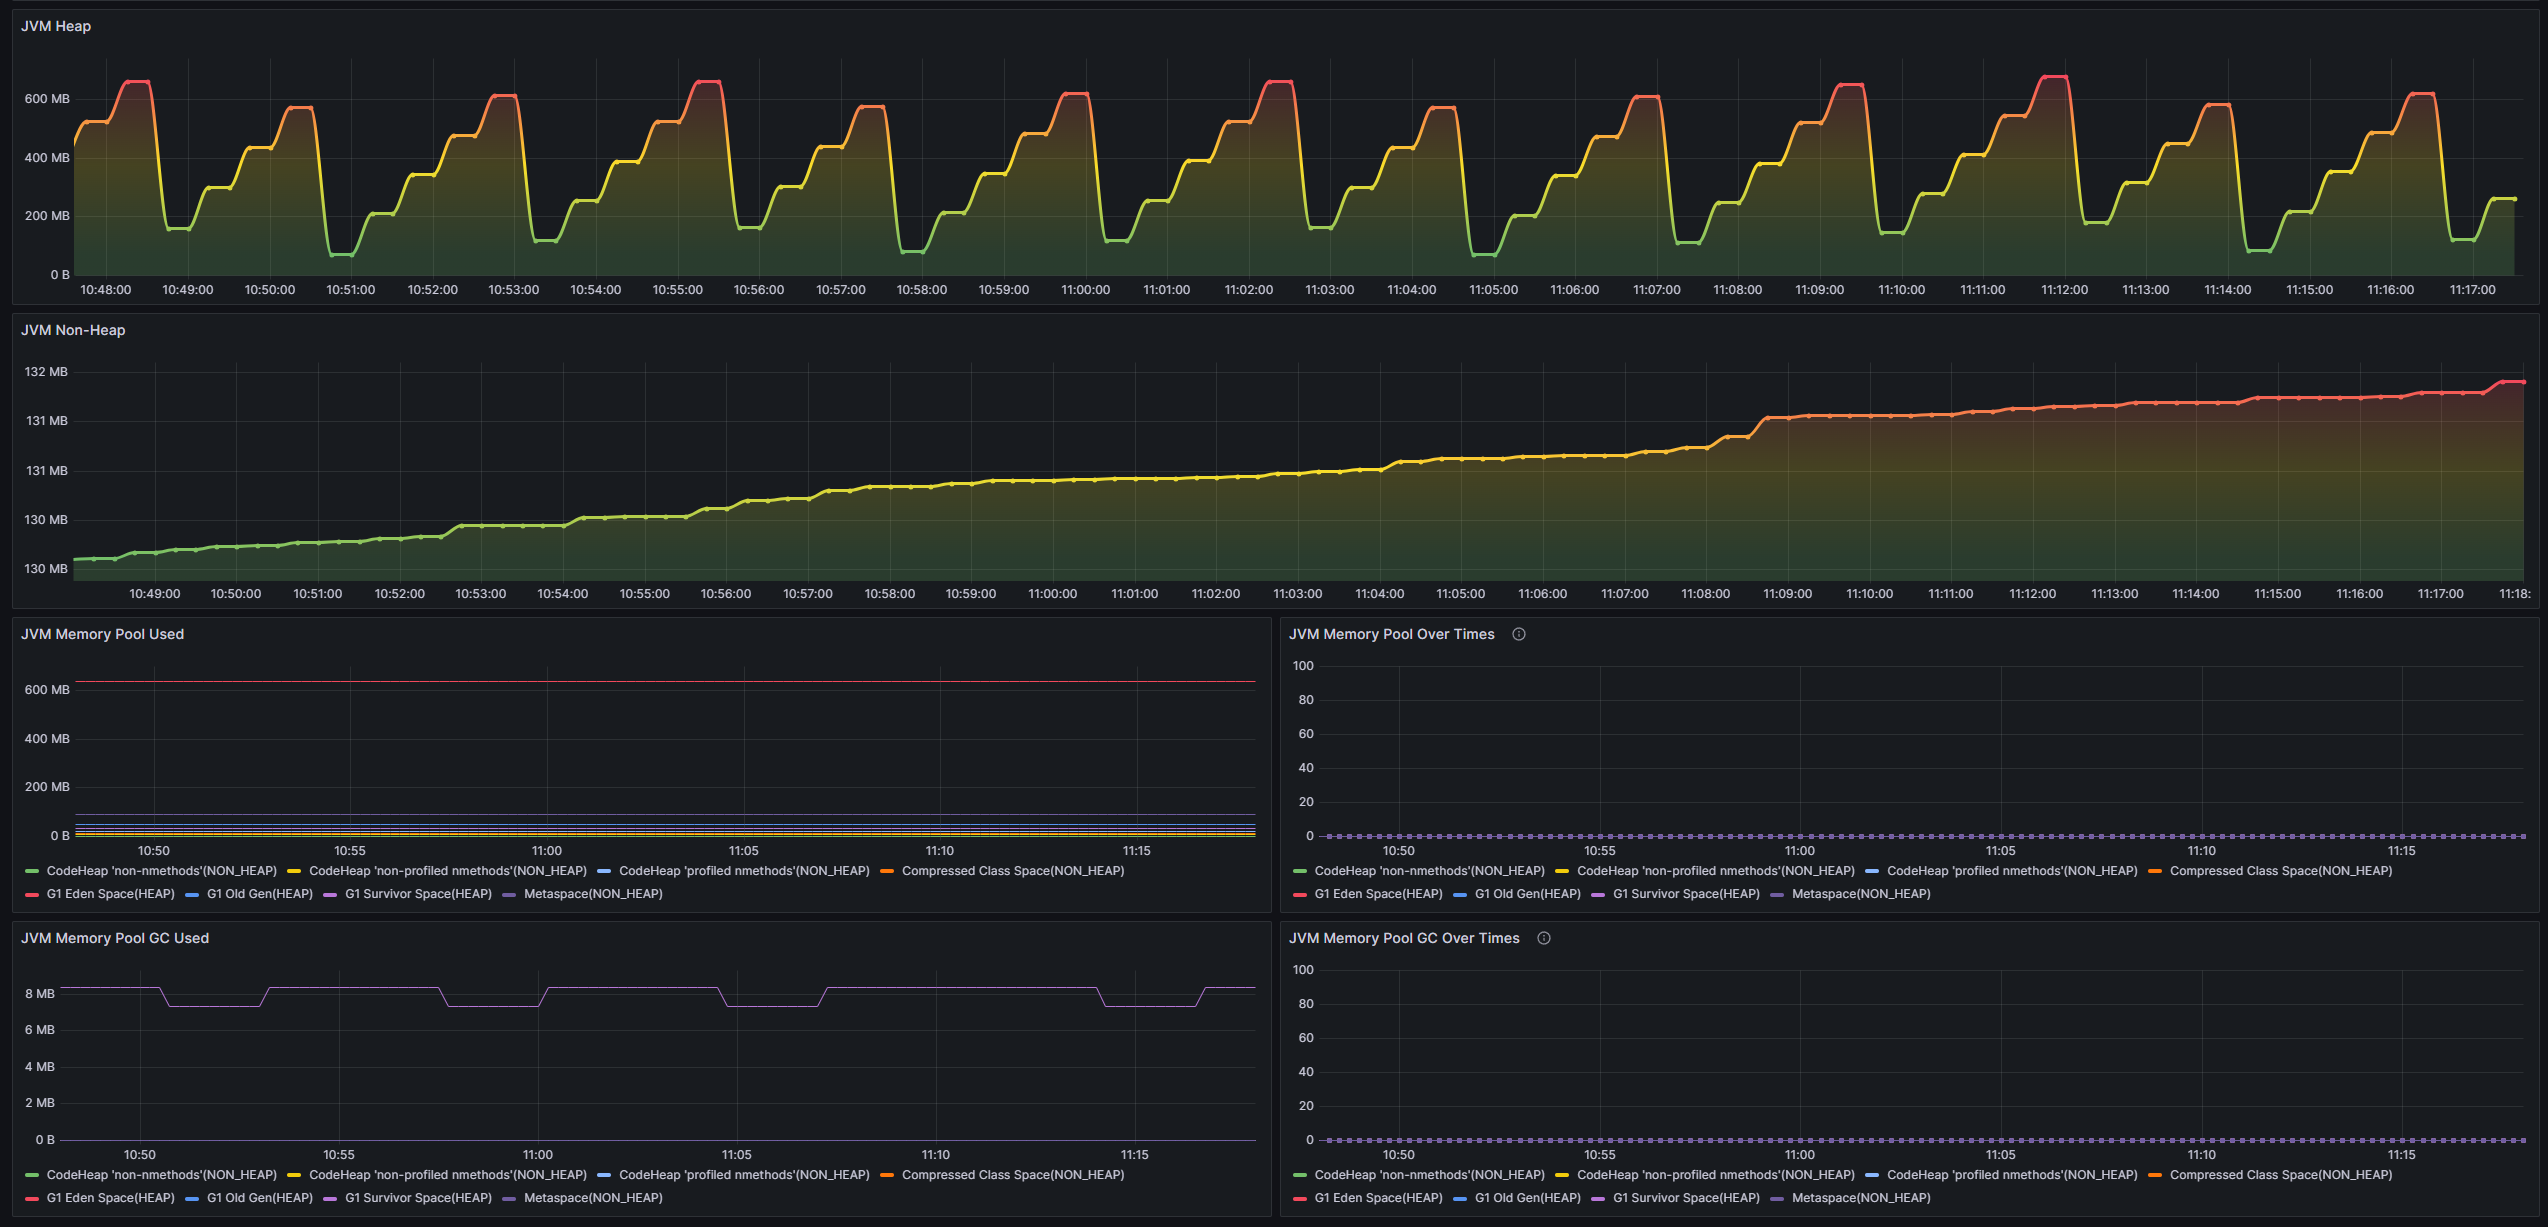
]jvmm provides two Grafana template Dashboards, namely: node and jvm
The node template is a collection of system-related monitoring items, which can help you focus more on monitoring data of physical machines or cloud hosts.
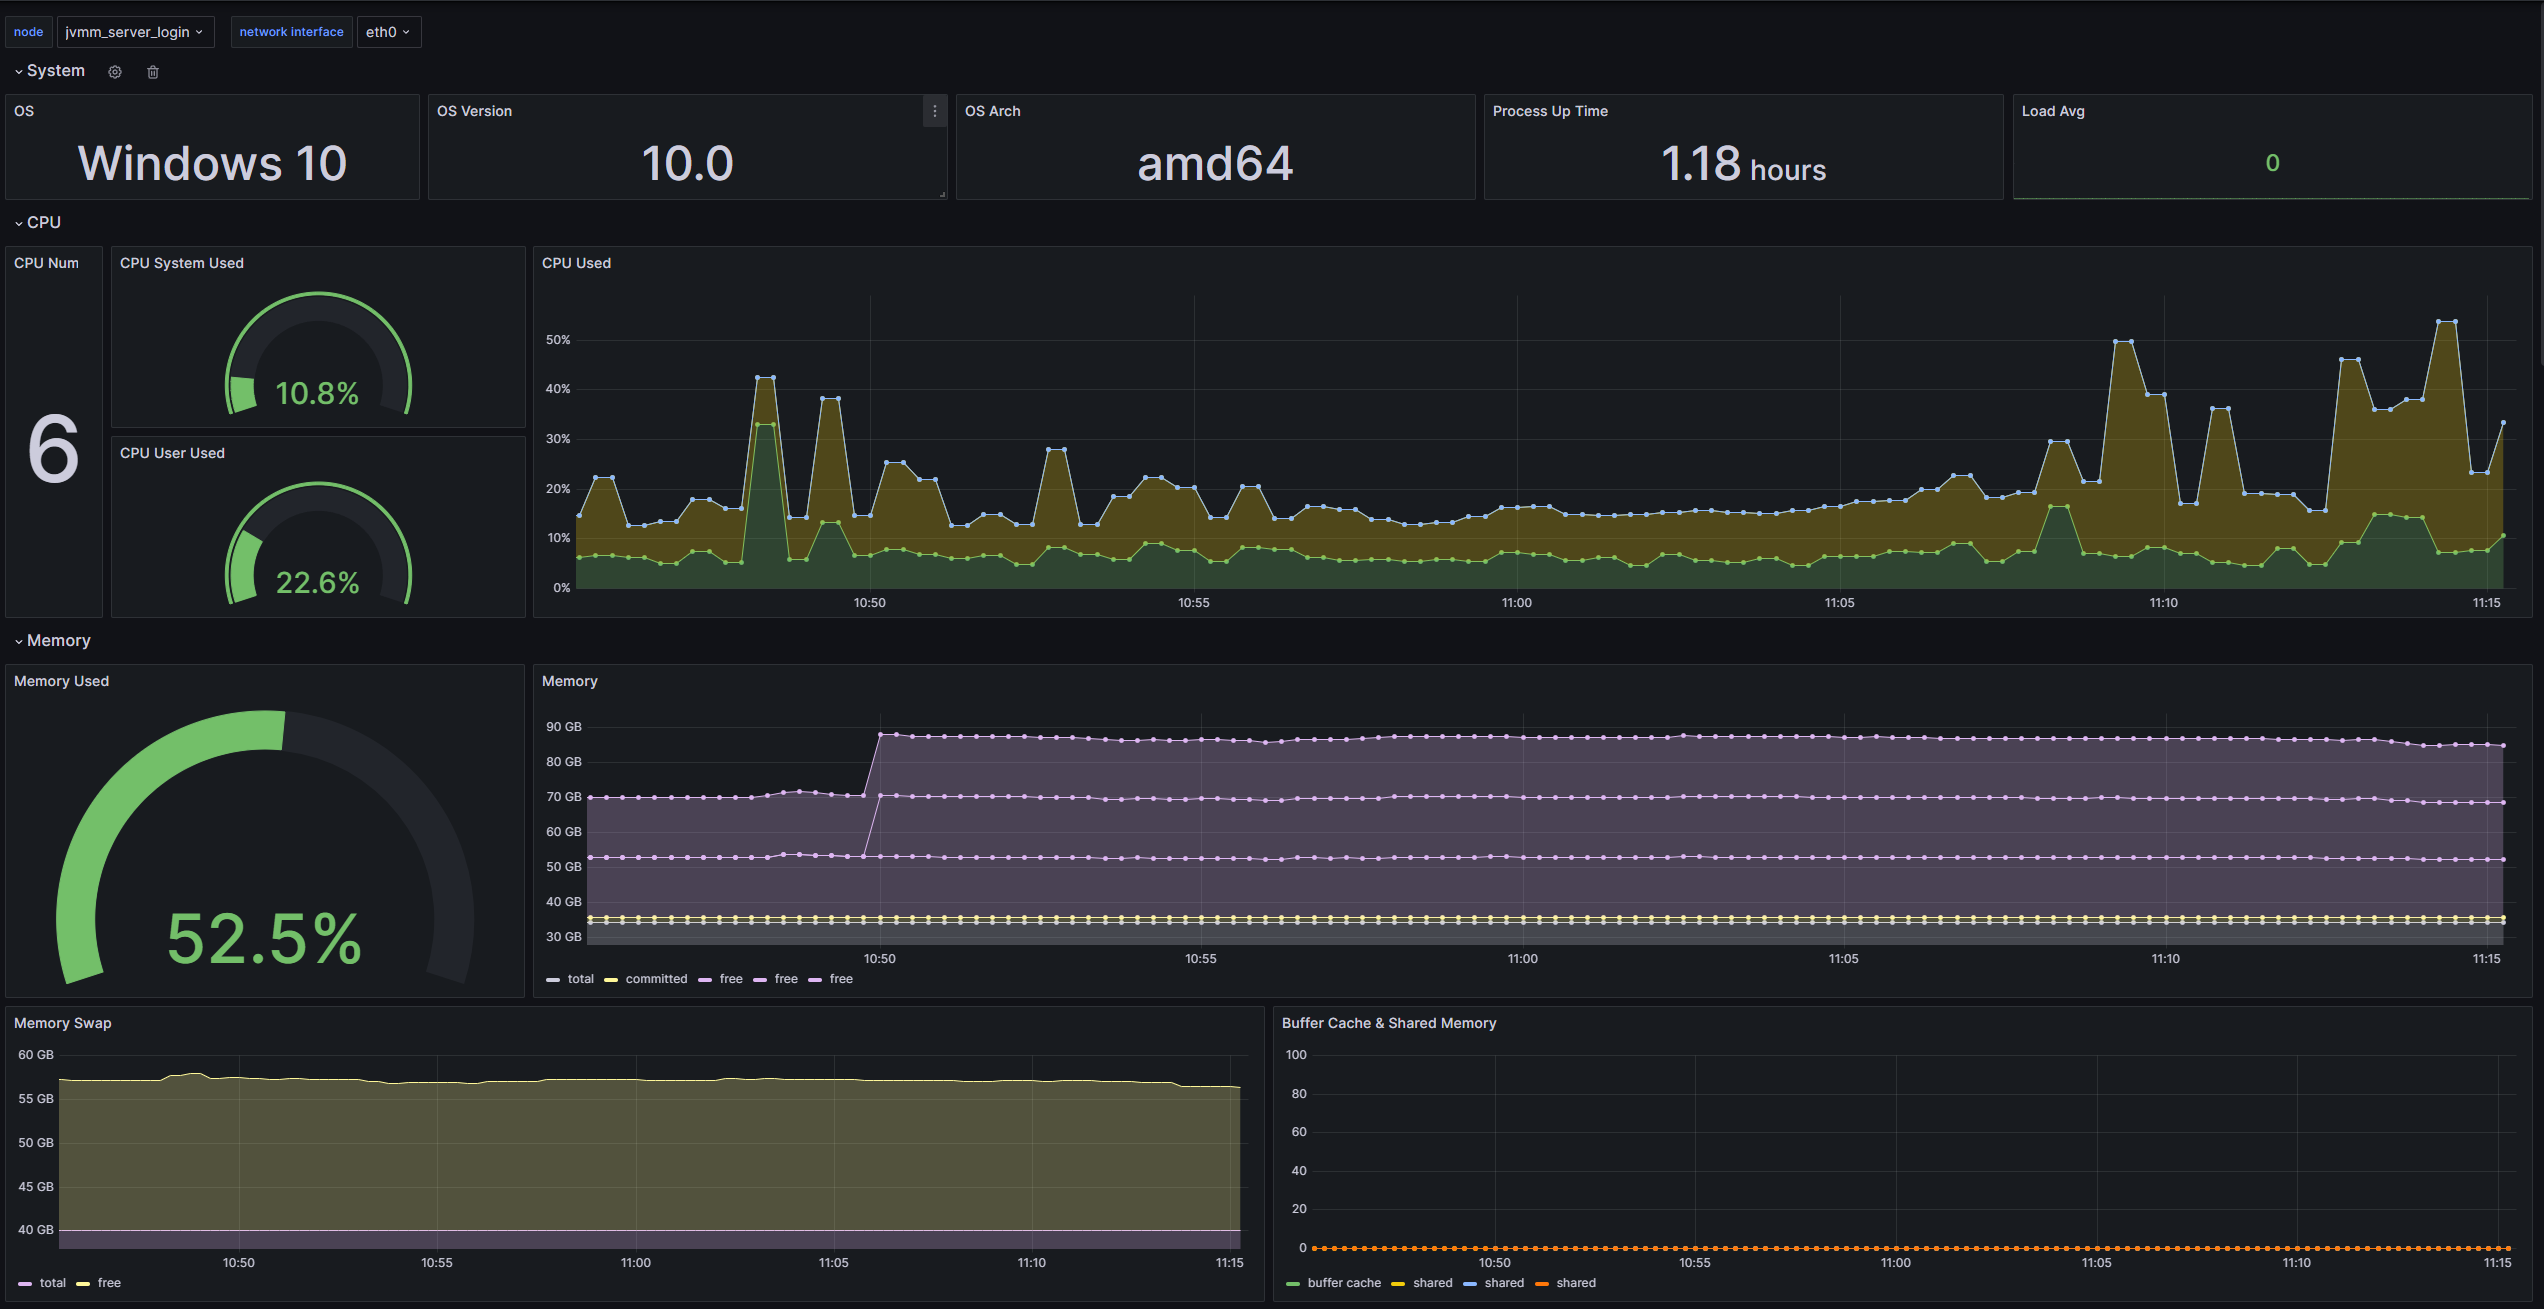
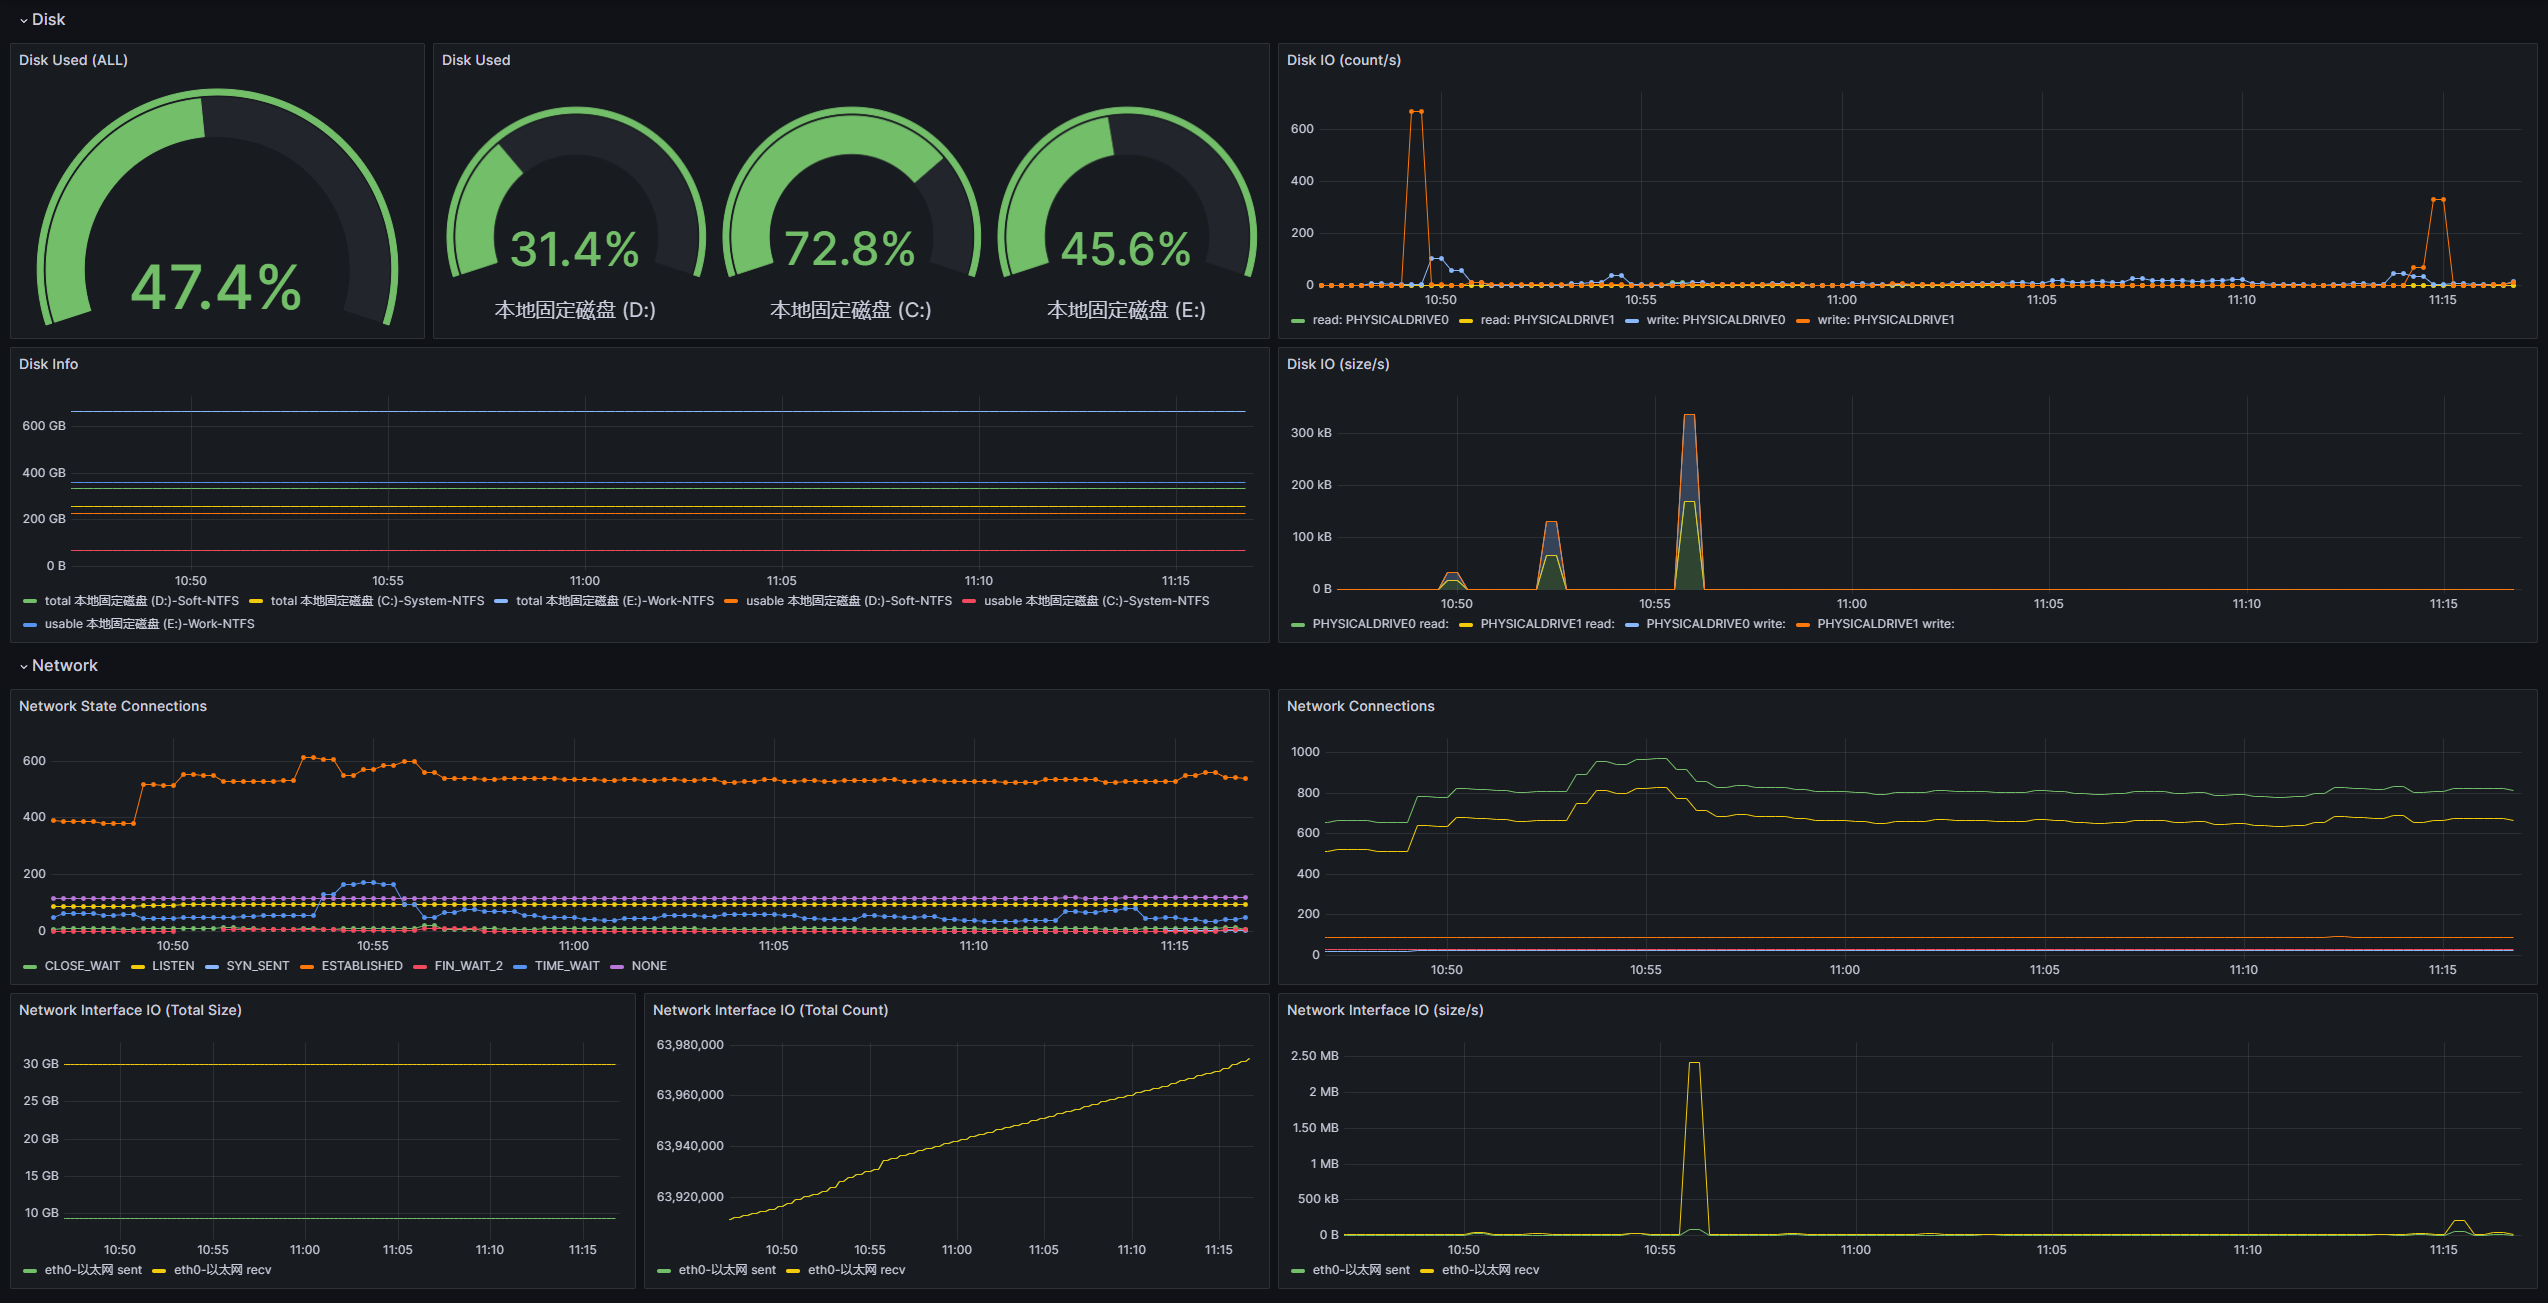
Import method: import Dashboard ID 20430 or import dashboard-node.json
To cooperate with this template, the following tasks need to be configured:
[
  " process " ,
  " disk_io " ,
  " cpu " ,
  " network " ,
  " sys " ,
  " sys_memory " ,
  " sys_file "
]
jvm template is a collection of JVM-related monitoring items, which can help you focus more on the monitoring data of the process.
Import method: import Dashboard ID 20429 or import dashboard-jvm.json
To cooperate with this template, the following tasks need to be configured:
[
  " process " ,
  " jvm_classloading " ,
  " jvm_compilation " ,
  " jvm_gc " ,
  " jvm_memory " ,
  " jvm_memory_pool " ,
  " jvm_thread "
]If you want to develop secondary based on Jvmm, you only need to introduce core dependencies
< dependency >
  < groupId >io.github.tzfun.jvmm</ groupId >
  < artifactId >jvmm-core</ artifactId >
  < version >${jvmm-version}</ version >
</ dependency >
All data acquisition functional interfaces provided by the previous Server and other functional interfaces that do not provide remote calling interfaces can be obtained through a factory class: org.beifengtz.jvmm.core.JvmmFactory
 public class Jvmm {
  public static void main ( String [] args ) {
      //    提供所有的数据采集接口
      JvmmCollector collector = JvmmFactory . getCollector ();
      //    提供所有的执行接口
      JvmmExecutor executor = JvmmFactory . getExecutor ();
      //    提供火焰图生成器
      JvmmProfiler profiler = JvmmFactory . getProfiler ();
  }
}The Jvmm client tool provides a simple and fast way to remotely call Jvmm. Of course, it also undertakes important functions such as attach server and generating dependency jars.
The client tool provides a bootstrap command execution function, and it will be executed inquiry even if you don’t take any parameters. For specific usage, please use the following command to view the help document:
java -jar jvmm.jar -hExample of data acquisition by client tool
Generate flame diagram example
Code call example
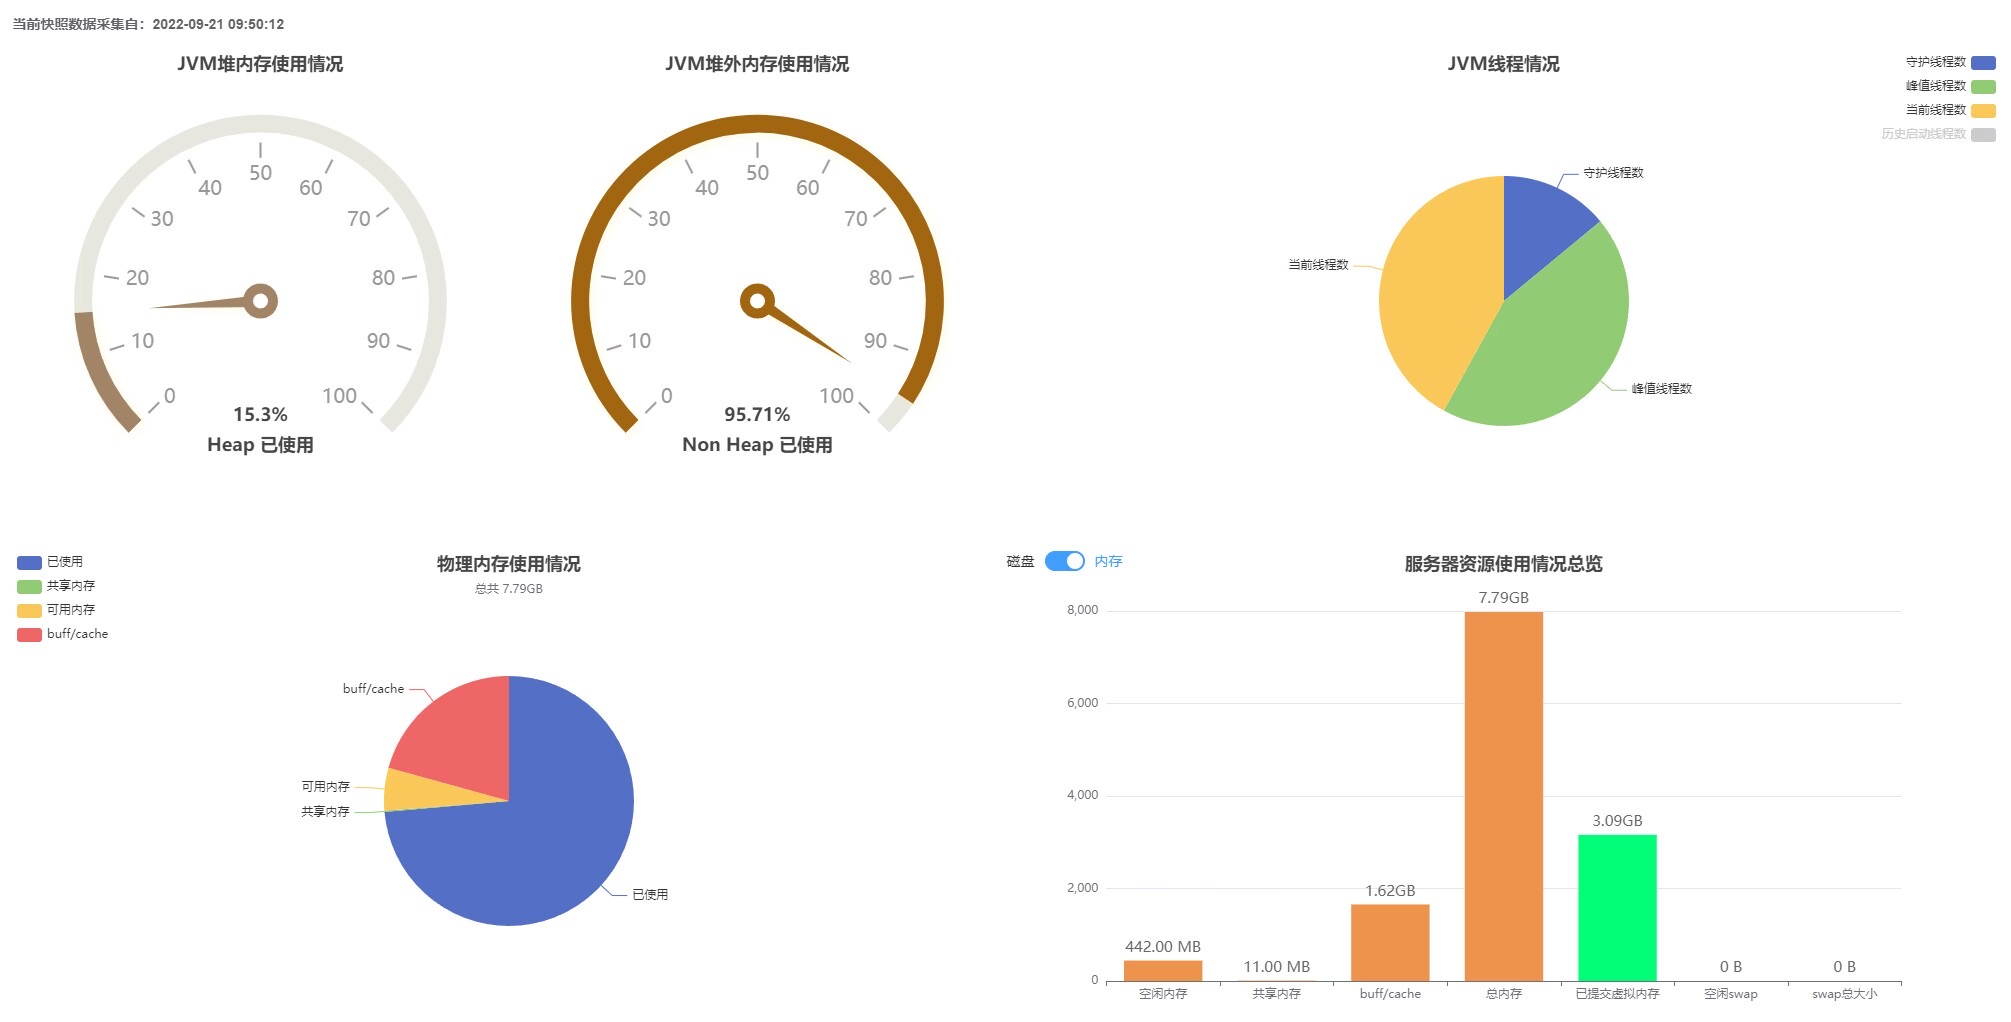
Custom Dashboard application example
Some components inside the project can be used without the project, lightweight and easy to use
The reason is that your environment does not have jdk tools or environment variables are not configured. Please make sure that your environment is installed with jdk instead of just jre. Simple verification: execute jps -l in your environment, and if it can be executed normally and output the result, it means that the environment is OK.
Solution: Configure your local jdk bin directory as an environment variable
If you start jvmm-server.jar, the reason is that you are using JDK 9 and above, Java prohibits reflective access to some classes starting with JDK 9+.
java.lang.reflect.InaccessibleObjectException: Unable to make field final jdk.internal.loader.URLClassPath jdk.internal.loader.ClassLoaders$AppClassLoader.ucp accessible: module java.base does not "opens jdk.internal.loader" to unnamed module @2d127a61
Solution: Add the following virtual machine parameters
 # JDK 9+ 为确保成功运行建议设置以下几个虚拟机参数
# --add-opens java.base/jdk.internal.loader=ALL-UNNAMED
# --add-opens jdk.zipfs/jdk.nio.zipfs=ALL-UNNAMED
# --add-opens java.base/java.net=ALL-UNNAMED
# --add-opens java.management/sun.management=ALL-UNNAMED
java -jar --add-opens java.base/jdk.internal.loader=ALL-UNNAMED
          --add-opens jdk.zipfs/jdk.nio.zipfs=ALL-UNNAMED
          --add-opens java.base/java.net=ALL-UNNAMED
          --add-opens java.management/sun.management=ALL-UNNAMED
jvmm-server.jar ./jvmm.yml If you prompt No access to perf events. Try --fdtransfer or --all-user option or 'sysctl kernel.perf_event_paranoid=1' , the reason is that the system kernel prohibits detection of system performance by default, and you need to enable this option.
sudo systcl -w kernel.perf_event_paranoid=1Or modify the sysctl file
sudo sh -c ' echo "kernel.perf_event_paranoid=1" >> /etc/sysctl.conf '
sudo sysctl -pThis tool is completely open source and free, and it is not easy to create. If you think it is good, you can donate to support this project.
Donation list:
If you encounter any problems during use, or have unique insights or suggestions about this project, please submit an issue or send a private message to me
Email: [email protected]
WeChat: beifeng-tz (please note jvmm if you add it)


