Windows Custom Updates Solution
Version_1.0.1.0
This project is light weight patch management tool for Windows based OS. It helps to monitor and control patch management of OS. Originally written to help with patch management for Windows Virtual Desktop (WVD) based solutions but works also very well for other - non WVD based solutions or setups. (E.g. patch management for family computers)
For patch management for Windows based workloads you have typically many enterprise level options. For example System Center Configuration Manager, Windows Update for Business, Windows Update, in case of WVD patch management also injection into base WVD image.
But sometimes, maybe you do not have setup which allows you to use tools highlighted above. Maybe you have many AD domains and forests, maybe you might be missing some capabilities like reporting, dashboards, telemetry to name few.
This is when you might benefit from this project which is trying to address such needs.
Generally, our recommendation is always to look first on professional solutions described above and only if you see some gaps with those professional solutions you might want to check this open source project.
Telemetry data now supports information coming from Azure platform (If the VM runs inside Azure Platform). Information about VM metadata like Azure VM name (VMResourceName), resource group name (ResourceGroupName) and subscription ID (SubscriptionId). Basically information where your Azure VM is defined.
This allows to support richer filtering capabilities and identifying Azure VMs and where such VMs are defined. In cases when this hosting environment is NOT running inside Azure Platform, such information is not available in telemetry header.
Application Insights and Log Analytics Workspace. You can also create free Azure account if needed: https://azure.microsoft.com/en-us/freeWVDCUS.zip - contains binary files which needs to be deployed to monitored hostsSource code.zip - Source code of this projectSource code.tar.gz - Source code of this project in different tar/zip formatWVDCUS.zip. In the downloads directory right click Properties on the file and mark the checkbox Unblock. Click OK.WVDCUS.zip file on all monitored hosts into the WVDCUS directory. For example into the directory: C:Program FilesWVDCUSLog Analytics Workspace in preferred region, with unique name and pay-as-you-go plan: https://docs.microsoft.com/en-us/azure/azure-monitor/learn/quick-create-workspace#create-a-workspaceApplication Insights into the same region as previous resource, with unique name, with workspace-based option and select the workspace you created before. https://docs.microsoft.com/en-us/azure/azure-monitor/app/create-workspace-resource#create-workspace-based-resourceApplication Insights resource click Overview and copy Instrumentation Key alias Telemetry Key which will be used later during configuration.C:Program FilesWVDCUSWVDCUS.Service.exe.config in the notepad (or any other text editor)TelemetryKey and replace the content 00000000-0000-0000-0000-000000000000 with the value you obtained from the Application Insights resource from Instrumentation Key item.CheckForUpdatesIntervalHours to more suitable value. This value specifies how frequently check for new updates should be done. Default is 4 hours and valid value can be between 1 - 590 hours.UpdatesSearchQuery to more suitable value. This value specifies which type and categories of patches should be installed automatically. Description of the query and parameters are here: https://docs.microsoft.com/en-us/previous-versions/windows/desktop/ff357803(v=vs.85) and here: https://docs.microsoft.com/en-us/windows/win32/api/wuapi/nf-wuapi-iupdatesearcher-searchWVDCUS.Console.exe.config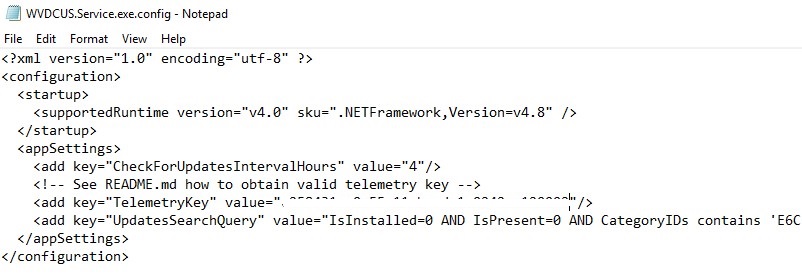
WVDCUS.Console.exe now to see if the application is configured correctly. Watch for any errors in the application output. If you see some errors verify that you have enough permissions. Application might to check, download and install patches if they are available.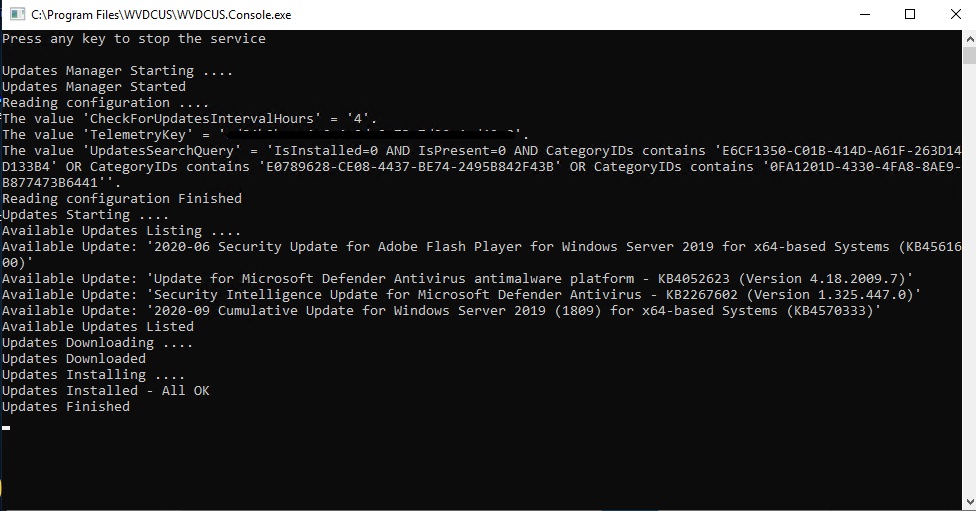
Once you verified a configuration with the console application you can finalize configuration with registration of application to run as Windows service.
To register application to run as Windows service, you must have administrator credentials on the computer where it's installed.
You need to use installutil.exe tool, which is part of .NET runtime.
This tool is installed with the .NET Framework to the folder %windir%Microsoft.NETFramework[64]<framework version>. For example, the default path for the 64-bit version is %windir%Microsoft.NETFramework64v4.0.30319InstallUtil.exe.
Run as Administratorcd C:Program FilesWVDCUSC:WindowsMicrosoft.NETFramework64v4.0.30319InstallUtil.exe WVDCUS.Service.exeinstallutil.exe process fails, check the install log to find out why. By default, the log is in the same folder as the service executable.WVDCUS.Console.exe before - then the installutil.exe will fail. The error is that Event Log is registered already by console application. If fails, just uninstall the Windows service with command bellow (removes Event Log) and install Windows service again.C:WindowsMicrosoft.NETFramework64v4.0.30319InstallUtil.exe /u WVDCUS.Service.exeC:WindowsMicrosoft.NETFramework64v4.0.30319InstallUtil.exe WVDCUS.Service.exe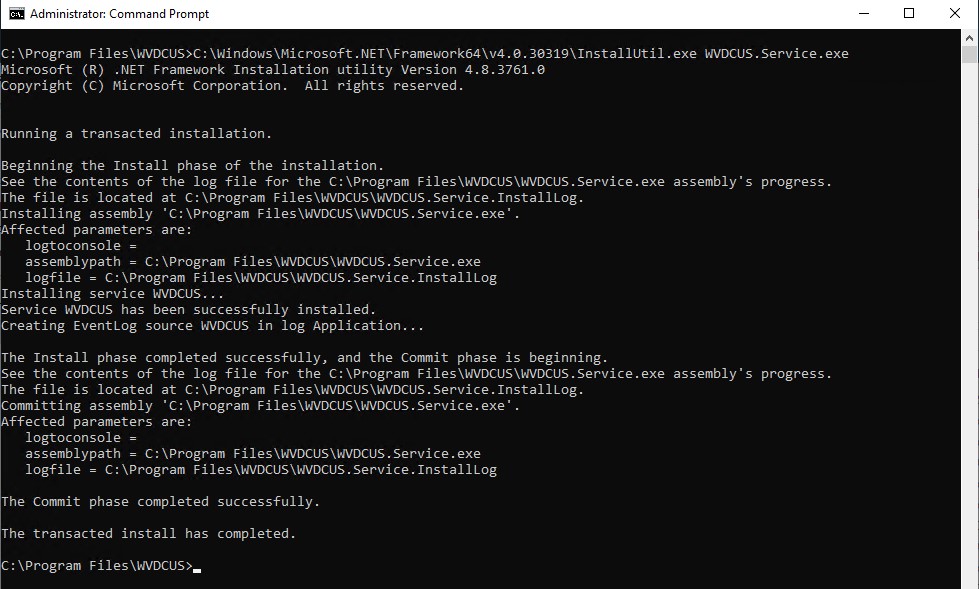
services.msc where you can find just registered Windows Service under the display name WVDCUS Service. The name of the service itself is WVDCUS.WVDCUS Service. On Recovery tab specify for First and Second failure Restart the Service action.ApplyStart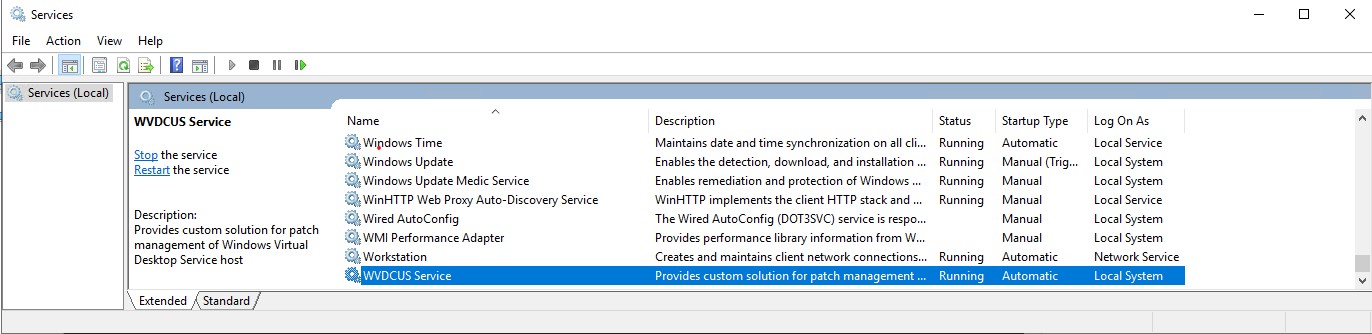
You can see detailed information about health of service, failures, informational messages in an event log.
eventvwr.msc where you can find detailed information in log files.WVDCUSLog log.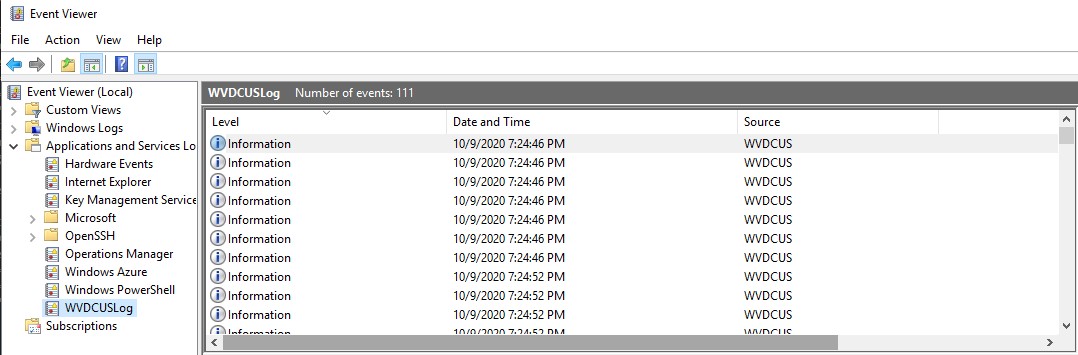
Once the Windows Service is up and in running state it will start to generate Telemetry data and store
them into provisioned Application Insights resource through TelemetryKey identifier.
Because the Application Insights resource was connected with Log Analytics Workspace during provisioning process you might benefit from
all features which are available in Log Analytics Workspace resource.
For more details see: https://docs.microsoft.com/en-us/azure/azure-monitor/log-query/log-query-overview
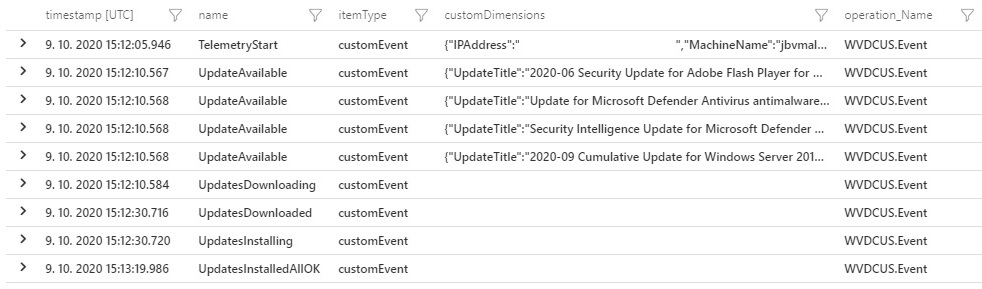
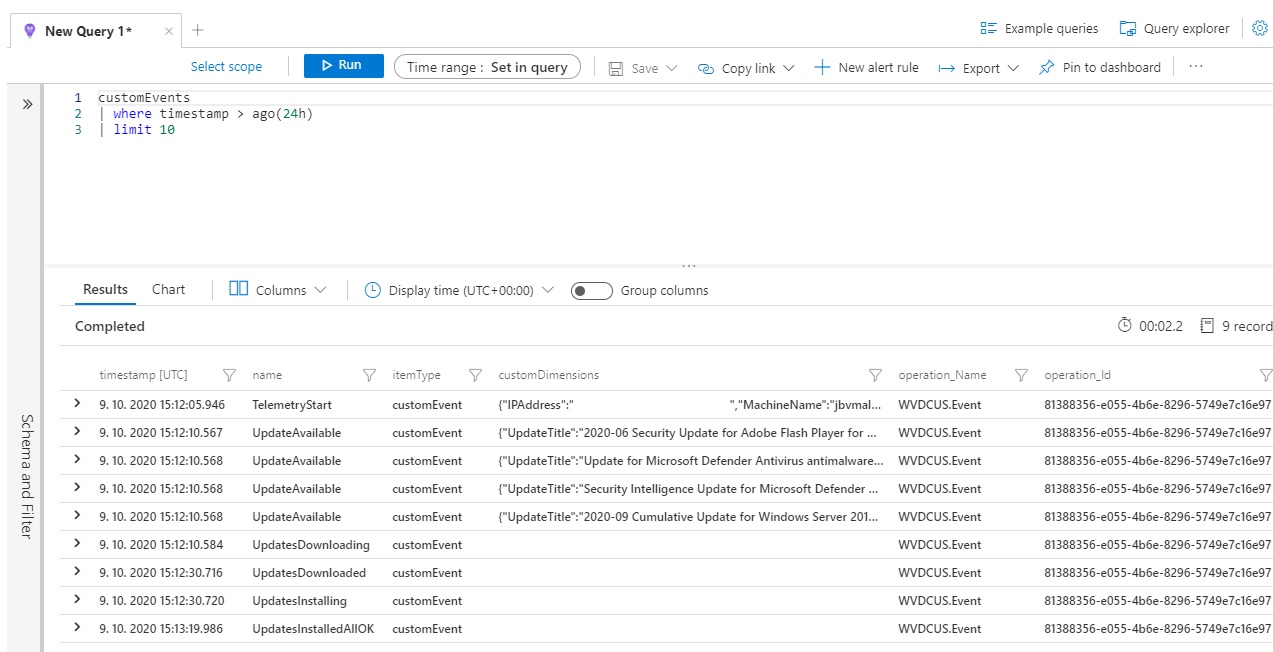
Telemetry data are stored as custom events and you might find them in the customEvents table.
This allows you to view and analyze data from all hosts and see current state, health and informational messages about patch management from many perspectives
and specified time range.
For more details see: https://docs.microsoft.com/en-us/azure/azure-monitor/log-query/get-started-queries
Analyzing data through queries and multiple perspectives is very powerful feature.
However, for daily monitoring you typically need to quickly see overall state of your hosts through
some kind of reports.
Fortunately, Log Analytics Workspace resource has such capability as well.
You can create custom workbook with custom queries over telemetry data and render results through relevant visual representation.
For more details see: https://docs.microsoft.com/en-us/azure/azure-monitor/platform/workbooks-overview
Application Insights resource, section WorkbooksCheckForUpdatesIntervalHours settings. When Time Range is lower you might not see any data.Run Query button to render chart from the latest dataDone Editing buttonSave button and save the Workbook under some preferred name.Next time you can go directly into the Workbooks sections and click on just created Workbook to see the report with latest data.
let WVDCUS = customEvents
| where itemType == 'customEvent' and operation_Name == 'WVDCUS.Event';
let WVDCUS_TelemetryStart = WVDCUS
| where name == 'TelemetryStart'
| project MachineName = tostring(customDimensions.MachineName), operation_Id, timestamp, VMResourceName = tostring(customDimensions.VMResourceName), ResourceGroupName = tostring(customDimensions.ResourceGroupName), SubscriptionId = tostring(customDimensions.SubscriptionId)
| summarize arg_max(timestamp, *) by MachineName;
let WVDCUS_Result = WVDCUS_TelemetryStart
| join kind = innerunique customEvents on operation_Id
| where name in ('NoUpdatesAvailable', 'UpdatesInstalledNoUpdates', 'UpdatesNotInstalledFailed', 'UpdatesInstalledRebootRequired', 'UpdatesInstalledAllOK', 'Error')
| extend State=replace(@'NoUpdatesAvailable', @'Up to date', name)
| extend State=replace(@'UpdatesInstalledNoUpdates', @'Up to date', State)
| extend State=replace(@'UpdatesNotInstalledFailed', @'Failed', State)
| extend State=replace(@'UpdatesInstalledRebootRequired', @'Reboot Required', State)
| extend State=replace(@'UpdatesInstalledAllOK', @'Up to date', State)
| extend State=replace(@'Error', @'Error', State)
| project MachineName, Timestamp = timestamp1, State, VMResourceName, ResourceGroupName, SubscriptionId;
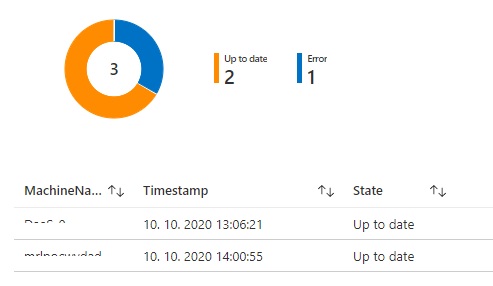
WVDCUS_Result
| project MachineName, State, VMResourceName, ResourceGroupName, SubscriptionId
| summarize Count=count() by State
| render piechart;
You might want to also see report showing current state of each host. You can extend just created Workbook with new report part.
Edit buttonAdd button. Click it and select Add Query.CheckForUpdatesIntervalHours settings. When Time Range is lower you might not see any data.Run Query button to see results from the latest dataDone Editing buttonSave buttonlet WVDCUS = customEvents
| where itemType == 'customEvent' and operation_Name == 'WVDCUS.Event';
let WVDCUS_TelemetryStart = WVDCUS
| where name == 'TelemetryStart'
| project MachineName = tostring(customDimensions.MachineName), operation_Id, timestamp, VMResourceName = tostring(customDimensions.VMResourceName), ResourceGroupName = tostring(customDimensions.ResourceGroupName), SubscriptionId = tostring(customDimensions.SubscriptionId)
| summarize arg_max(timestamp, *) by MachineName;
let WVDCUS_Result = WVDCUS_TelemetryStart
| join kind = innerunique customEvents on operation_Id
| where name in ('NoUpdatesAvailable', 'UpdatesInstalledNoUpdates', 'UpdatesNotInstalledFailed', 'UpdatesInstalledRebootRequired', 'UpdatesInstalledAllOK', 'Error')
| extend State=replace(@'NoUpdatesAvailable', @'Up to date', name)
| extend State=replace(@'UpdatesInstalledNoUpdates', @'Up to date', State)
| extend State=replace(@'UpdatesNotInstalledFailed', @'Failed', State)
| extend State=replace(@'UpdatesInstalledRebootRequired', @'Reboot Required', State)
| extend State=replace(@'UpdatesInstalledAllOK', @'Up to date', State)
| extend State=replace(@'Error', @'Error', State)
| project MachineName, Timestamp = timestamp1, State, VMResourceName, ResourceGroupName, SubscriptionId;
WVDCUS_Result
| project MachineName, Timestamp, State, VMResourceName, ResourceGroupName, SubscriptionId
You can see combined example report - containing two parts on picture below.
Finally, you might not have interest in checking reports daily. Maybe you want to do it only if this is really needed. In this case you might benefit from alerting mechanism which will notify you that some host needs your attention.
Again, Log Analytics Workspace has such built-in capability.
For more details see: https://docs.microsoft.com/en-us/azure/azure-monitor/learn/tutorial-response
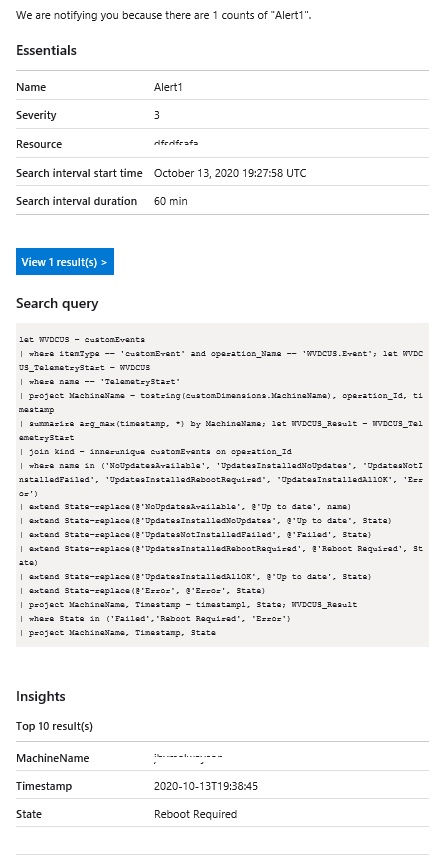
Here is how you can create Alert based on set of conditions.
Application Insights resource, section Logs, close window with Example queriescustomEvents table.See in query editorNew alert rule button in the toolbarScope as it is - should be pointing to correct Application Insights instance.Condition section, specify Time range value - This value needs to be aligned with CheckForUpdatesIntervalHours settings. When Time Range is lower you might not see any data.Search query text boxNumber of results, Greater than and threshold value 0 - basically the alert will be triggered if some new record
which is in state Failed, Reboot Required, Error was returned by query.Action Group. Click the button Select action group. If needed, click to Create action group. See https://docs.microsoft.com/en-us/azure/azure-monitor/platform/action-groups?WT.mc_id=Portal-Microsoft_Azure_Monitoring.Create alert rulelet WVDCUS = customEvents
| where itemType == 'customEvent' and operation_Name == 'WVDCUS.Event';
let WVDCUS_TelemetryStart = WVDCUS
| where name == 'TelemetryStart'
| project MachineName = tostring(customDimensions.MachineName), operation_Id, timestamp, VMResourceName = tostring(customDimensions.VMResourceName), ResourceGroupName = tostring(customDimensions.ResourceGroupName), SubscriptionId = tostring(customDimensions.SubscriptionId)
| summarize arg_max(timestamp, *) by MachineName;
let WVDCUS_Result = WVDCUS_TelemetryStart
| join kind = innerunique customEvents on operation_Id
| where name in ('NoUpdatesAvailable', 'UpdatesInstalledNoUpdates', 'UpdatesNotInstalledFailed', 'UpdatesInstalledRebootRequired', 'UpdatesInstalledAllOK', 'Error')
| extend State=replace(@'NoUpdatesAvailable', @'Up to date', name)
| extend State=replace(@'UpdatesInstalledNoUpdates', @'Up to date', State)
| extend State=replace(@'UpdatesNotInstalledFailed', @'Failed', State)
| extend State=replace(@'UpdatesInstalledRebootRequired', @'Reboot Required', State)
| extend State=replace(@'UpdatesInstalledAllOK', @'Up to date', State)
| extend State=replace(@'Error', @'Error', State)
| project MachineName, Timestamp = timestamp1, State, VMResourceName, ResourceGroupName, SubscriptionId;
WVDCUS_Result
| where State in ('Failed','Reboot Required', 'Error')
| project MachineName, Timestamp, State, VMResourceName, ResourceGroupName, SubscriptionId
This should trigger action and attention when some host will fall into the one of the states Failed, Reboot Required, Error.
Alert email which you can receive to attract your attention.