rl plotter
v2.4.0
readme | 中文文档
هذه أداة بسيطة يمكنها رسم منحنيات التعلم بسهولة لتعلم التعزيز (RL)
من PIP
pip install rl_plotter
من المصدر
python setup.py install
1. أضف المسجل الأساسي
أضف مسجلنا في رمز التقييم الخاص بك (أوصي)
 from rl_plotter . logger import Logger
logger = Logger ( exp_name = "your_exp_name" , env_name , seed , locals ())
····
logger . update ( score = evaluation_score_list , total_steps = current_training_steps )
أو مجرد استخدام Openai-Spinningup لتسجيل (دعم)
أو يمكنك استخدام Openai-Baseline Bench.monitor (لا يوصي)
env = logger . monitor_env ( env )2. تتبع المتغيرات الأخرى (اختياري)
إذا كنت ترغب في تتبع المتغيرات الأخرى ، فيمكنك استخدام Custom_logger:
 custom_logger = logger . new_custom_logger ( filename , fieldnames = [ "variable 1" , "variable 2" , ..., "variable n" ])
custom_logger . update ( fieldvalues = variable_value_list , total_steps = current_training_steps )
3. ارسم النتائج
بعد التدريب أو عند تدريب وكيلك ، يمكنك رسم منحنيات التعلم بهذه الطريقة:
التبديل إلى دليل السجل أو دليل الوالد الخاص بـ Multi Log (افتراضي: ./)
تشغيل الأمر للتخطيط:
rl_plotter --save --show
يمكنك أيضًا استخدام kernel seaborn للحصول على نفس نمط المؤامرة مثل Openai-Spinningup:
rl_plotter_spinup --save --show
1. أوامر شائعة الاستخدام
 rl_plotter --save --show --filter HalfCheetah
rl_plotter --save --show --filter Ant --avg_group --shaded_std
rl_plotter --save --show --filter Swimmer --avg_group --shaded_std --shaded_err
rl_plotter --save --show --filter Walker2d --filename progress.txt --xkey TotalEnvInteracts --ykey AverageEpRet
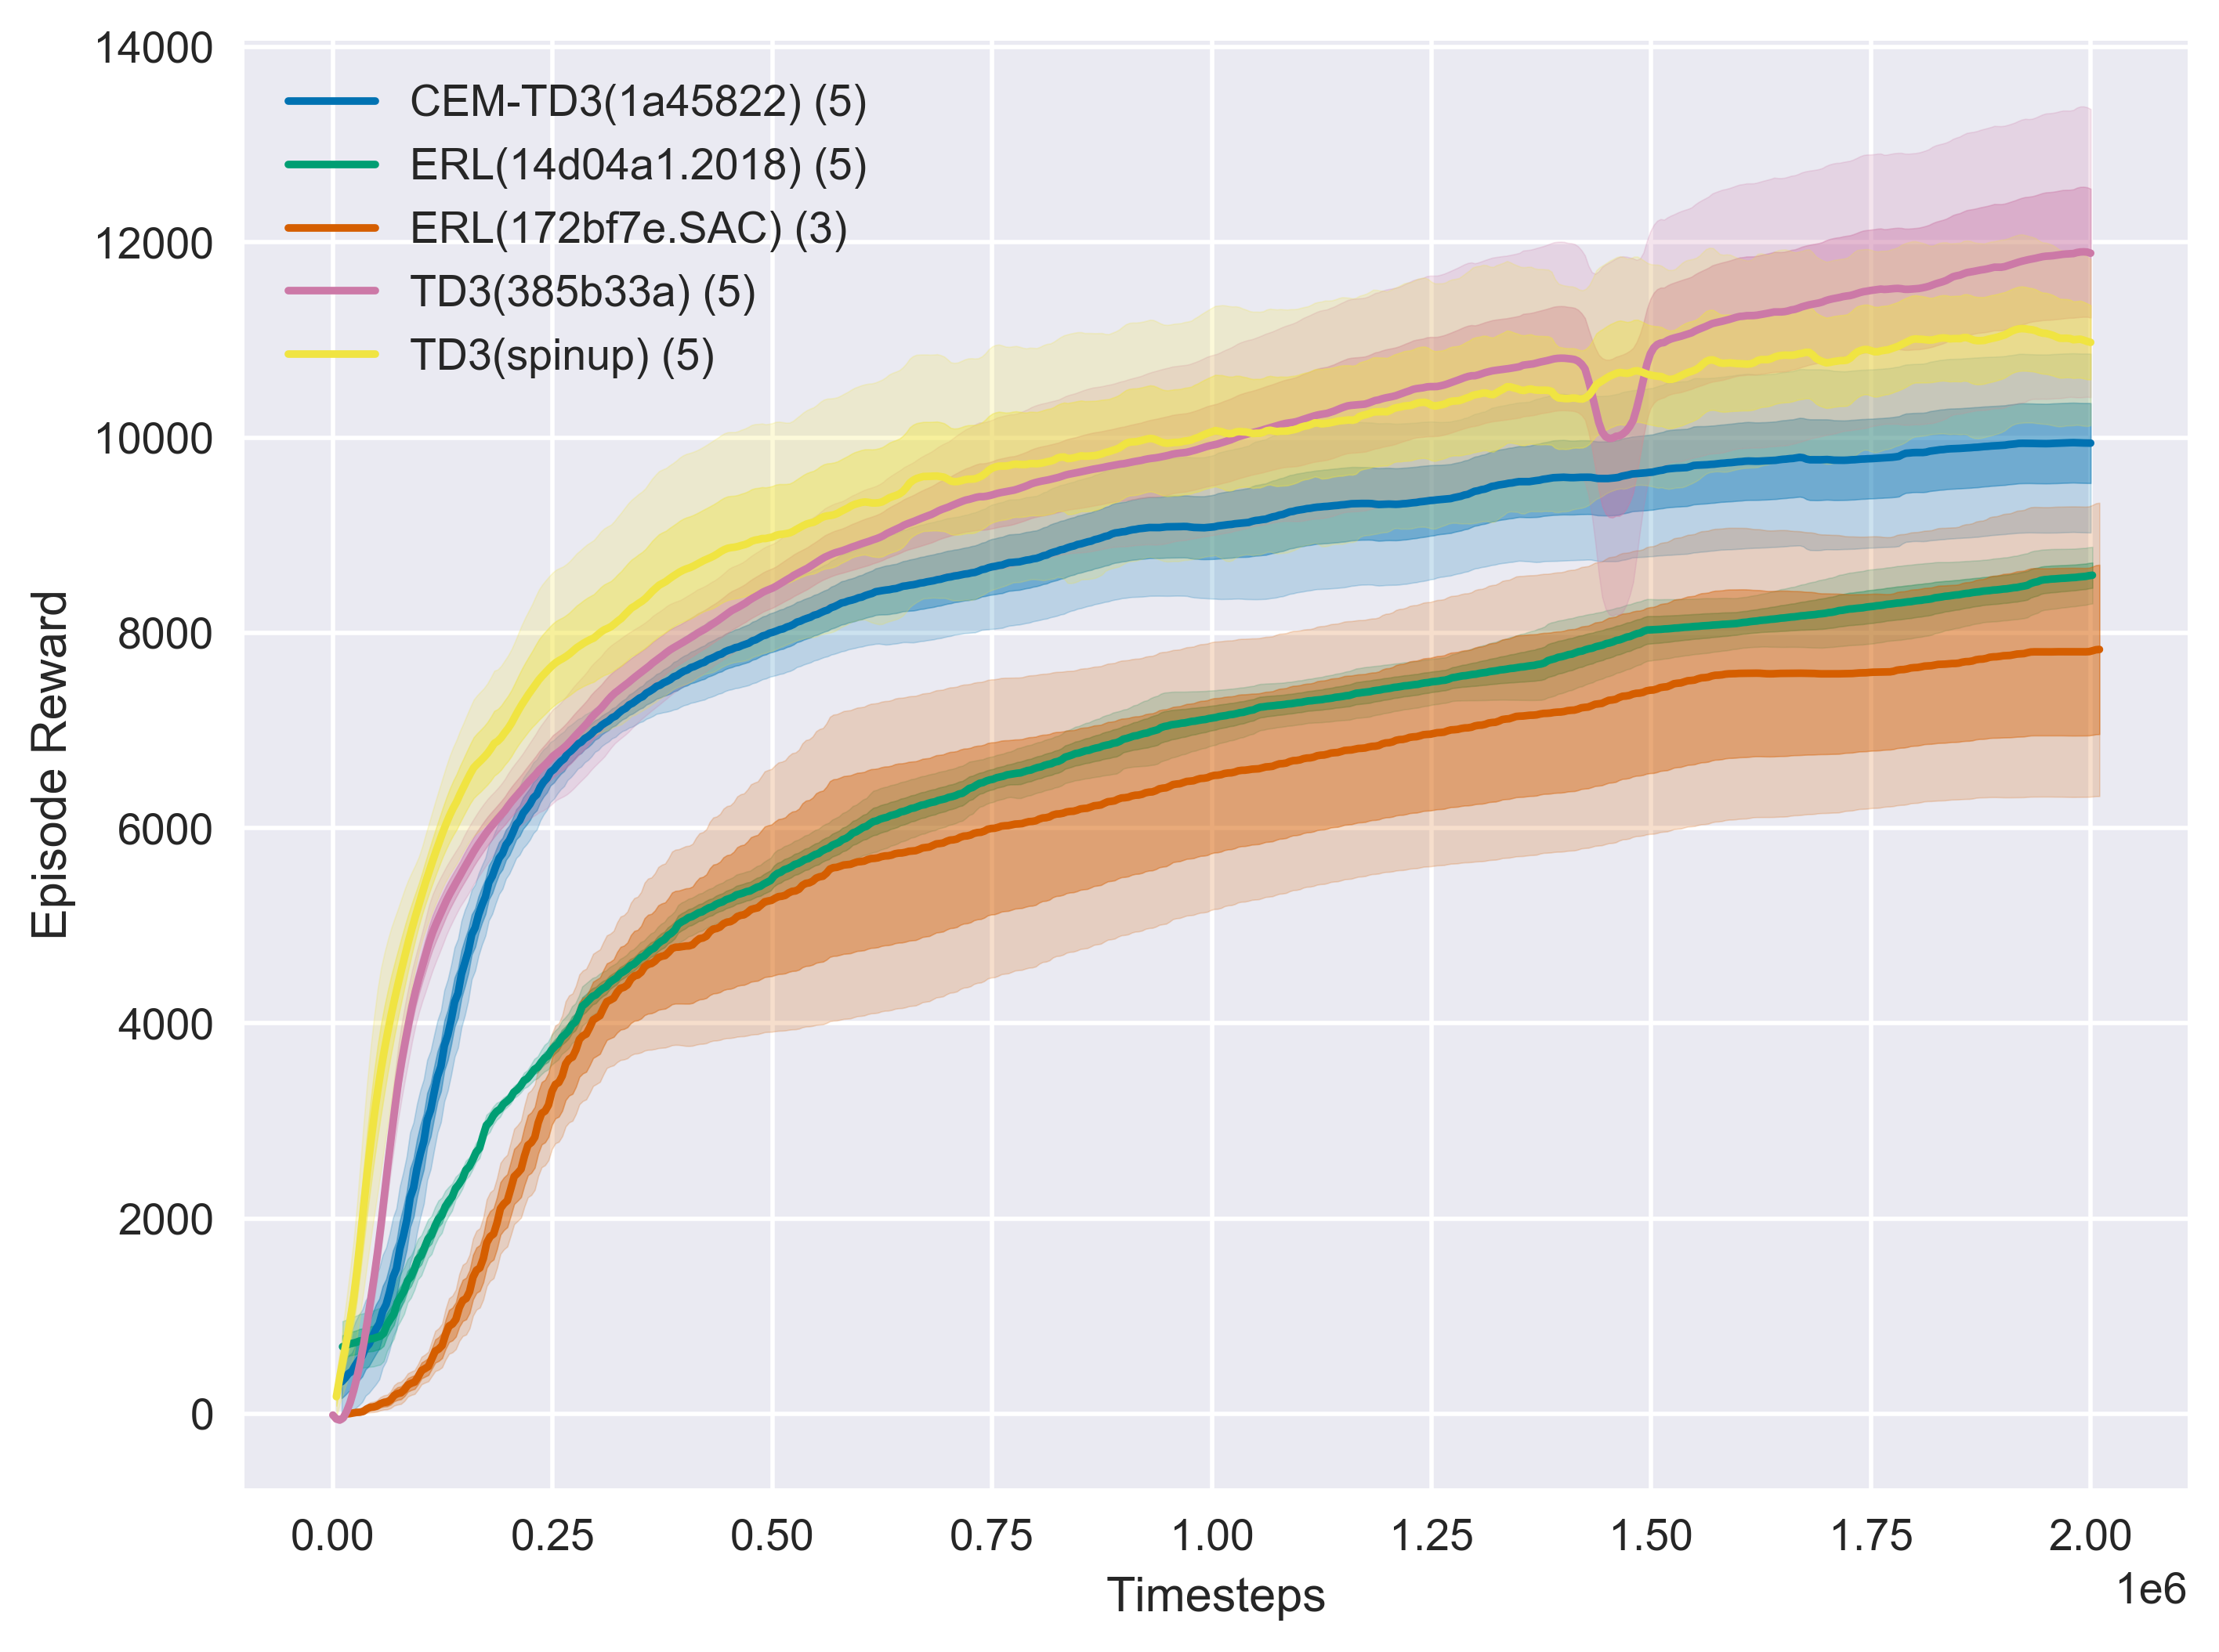
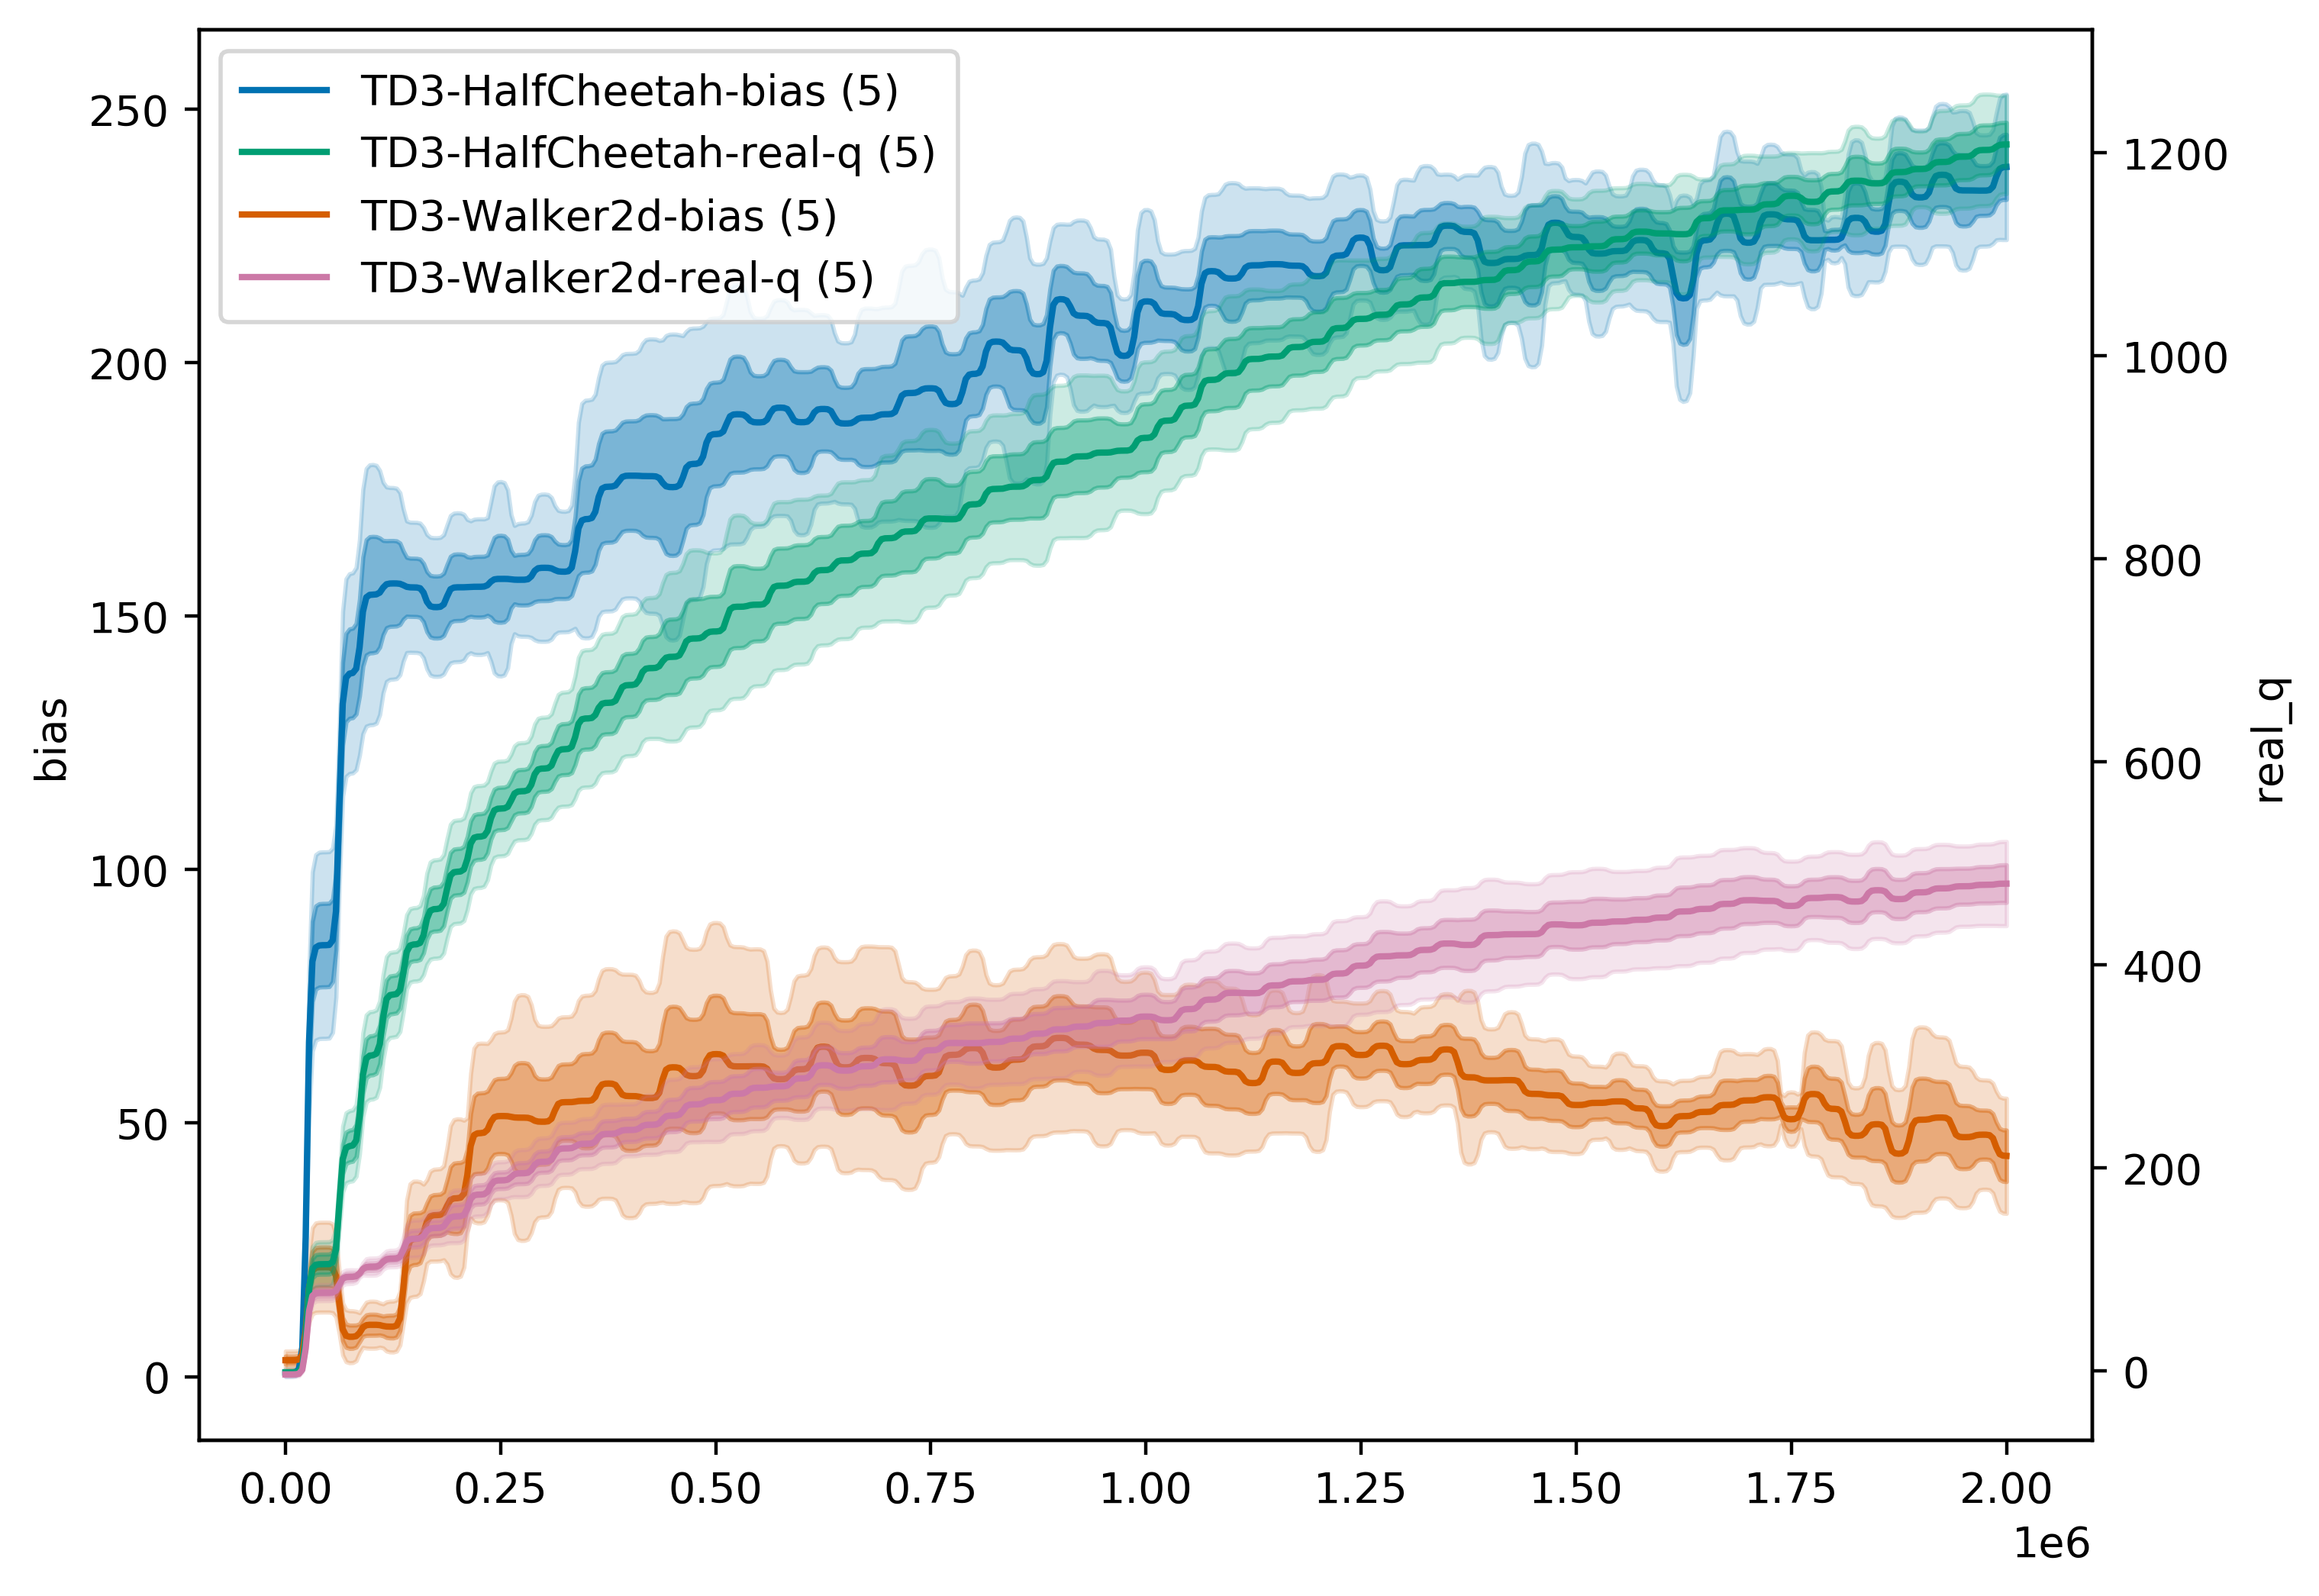
2. أمثلة عملية
rl_plotter --show --save --avg_group --shaded_err --shaded_std
rl_plotter --show --save --avg_group --shaded_err --shaded_std --filename q --filters Walker HalfCheetah --ykey bias real_q --yduel --style default --smooth 0
3. استخدام أكثر تحديدا
يمكنك العثور على جميع المعلمات التي يمكنها تخصيص نمط المنحنيات الخاصة بك باستخدام help
rl_plotter --help
 optional arguments:
-h, --help            show this help message and exit
--fig_length          matplotlib figure length (default: 8)
--fig_width           matplotlib figure width (default: 6)
--style               matplotlib figure style (default: seaborn)
--title               matplotlib figure title (default: None)
--xlabel              matplotlib figure xlabel
--xkey                x-axis key in csv file (default: l)
--ykey                y-axis key in csv file (support multi) (default: r)
--yduel               duel y axis (use if has two ykeys)
--ylabel              matplotlib figure ylabel
--smooth              smooth radius of y axis (default: 10)
--resample            if not zero, size of the uniform grid in x direction
                      to resample onto. Resampling is performed via
                      symmetric EMA smoothing (see the docstring for
                      symmetric_ema). Default is zero (no resampling). Note
                      that if average_group is True, resampling is
                      necessary; in that case, default value is 512.
                      (default: 512)
--smooth_step         when resampling (i.e. when resample > 0 or
					  average_group is True), use this EMA decay parameter
                      (in units of the new grid step). See docstrings for
                      decay_steps in symmetric_ema or one_sided_ema functions.
                      (default: 1.0)
--avg_group           average the curves in the same group and plot the mean
--shaded_std          shaded region corresponding to standard deviation of the group
--shaded_err          shaded region corresponding to error in mean estimate of the group
--legend_loc          location of legend
--legend_outside      place the legend outside of the figure
--borderpad           borderpad of legend (default: 0.5)
--labelspacing        labelspacing of legend (default: 0.5)
--no_legend_group_num don't show num of group in legend
--time                enable this will activate parameters about time
--time_unit           parameters about time, x axis time unit (default: h)
--time_interval       parameters about time, x axis time interval (default: 1)
--xformat             x-axis format
--xlim                x-axis limitation (default: None)
--log_dir             log dir (default: ./)
--filters             filter of dirname
--filename            csv filename
--show                show figure
--save                save figure
--dpi                 figure dpi (default: 400)
إذا كنت تستخدم هذا المستودع لبحثك أو منشورك ، يرجى الاستشهاد:
 @misc{rl-plotter,
  author = {Xiaoyu Gong},
  title = {RL-plotter: A plotter for reinforcement learning},
  year = {2020},
  publisher = {GitHub},
  journal = {GitHub repository},
  howpublished = {url{https://github.com/gxywy/rl-plotter}},
}
جوهر هذه الأداة مستوحى من خطوط الأساس/plot_util.py و spinningup/plot.py


